Most walkable towns in Kentucky
Ranked by street connectivity: intersections per square mile, the standard walkability measure the EPA uses. 19 towns with 2,500+ residents.
 1
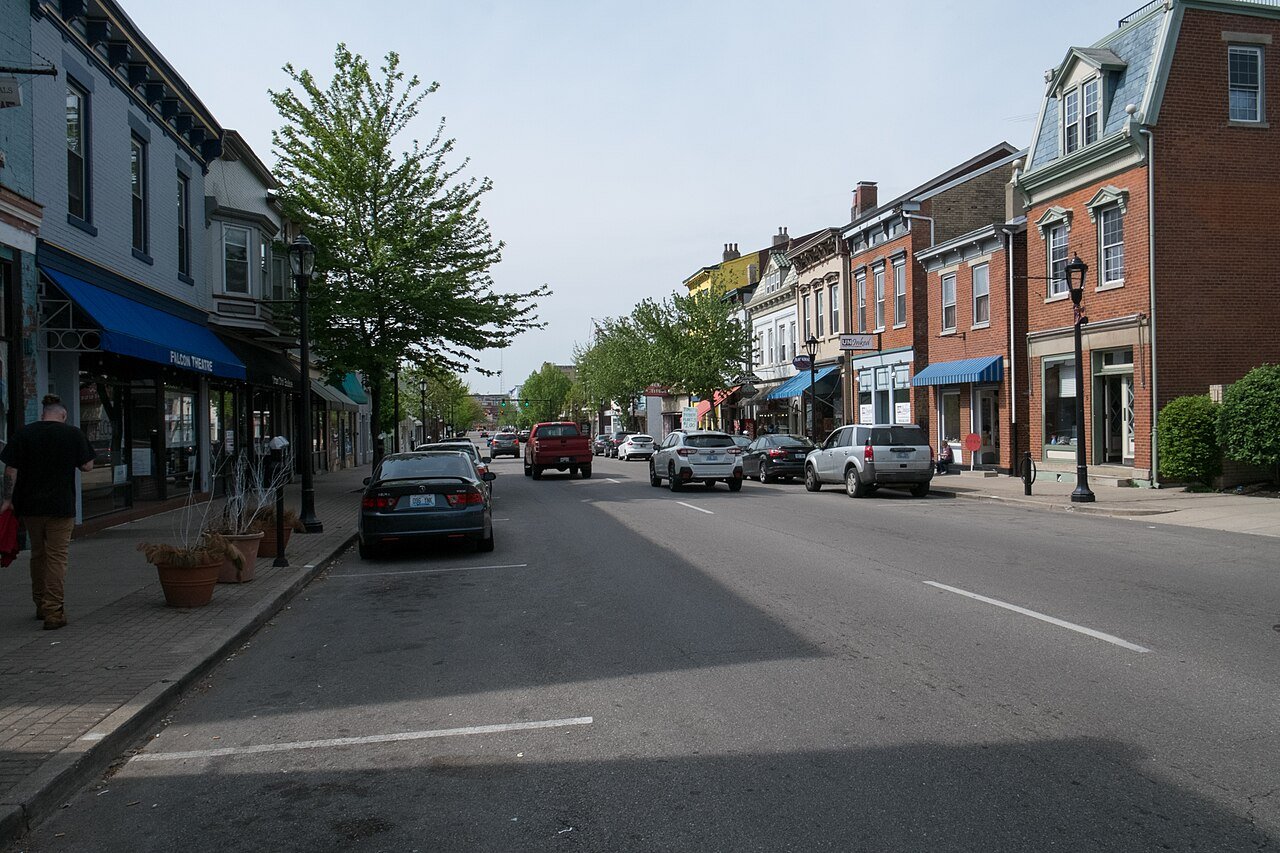
Newport
109 / sq mi
Dead ends 18.8%
1
Newport
109 / sq mi
Dead ends 18.8%
 2
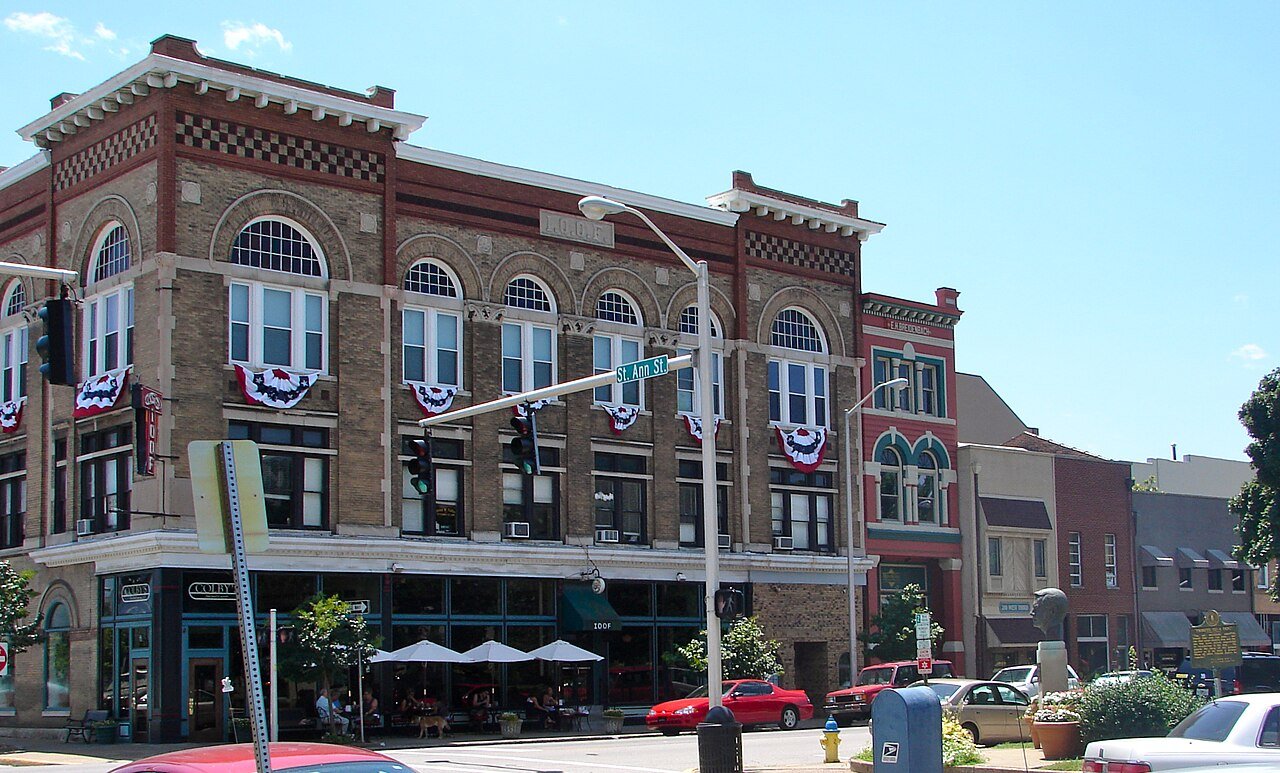
Owensboro
93.7 / sq mi
Dead ends 18%
2
Owensboro
93.7 / sq mi
Dead ends 18%
 3
Campbellsville
81.9 / sq mi
Dead ends 16.8%
3
Campbellsville
81.9 / sq mi
Dead ends 16.8%
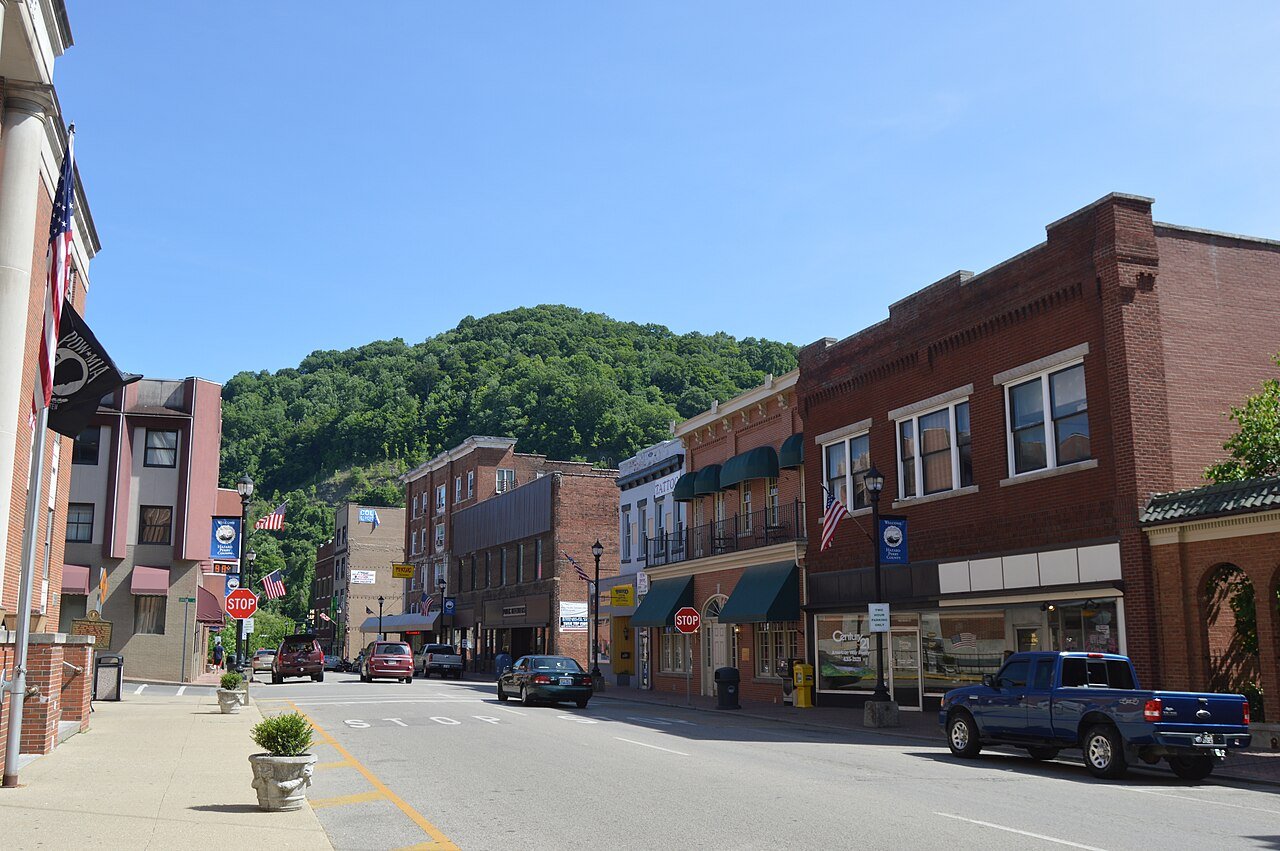
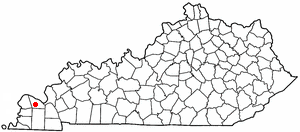
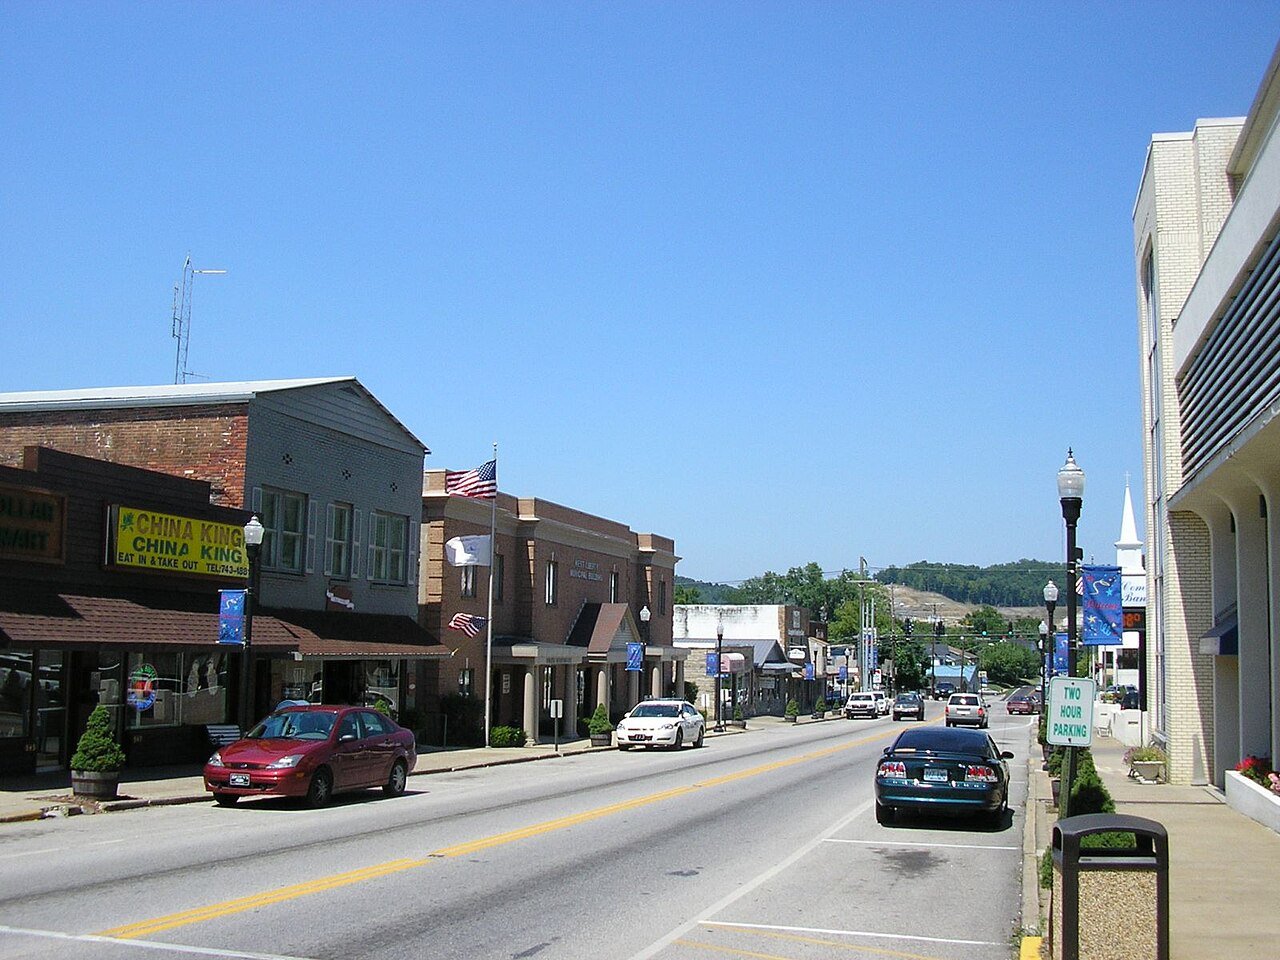
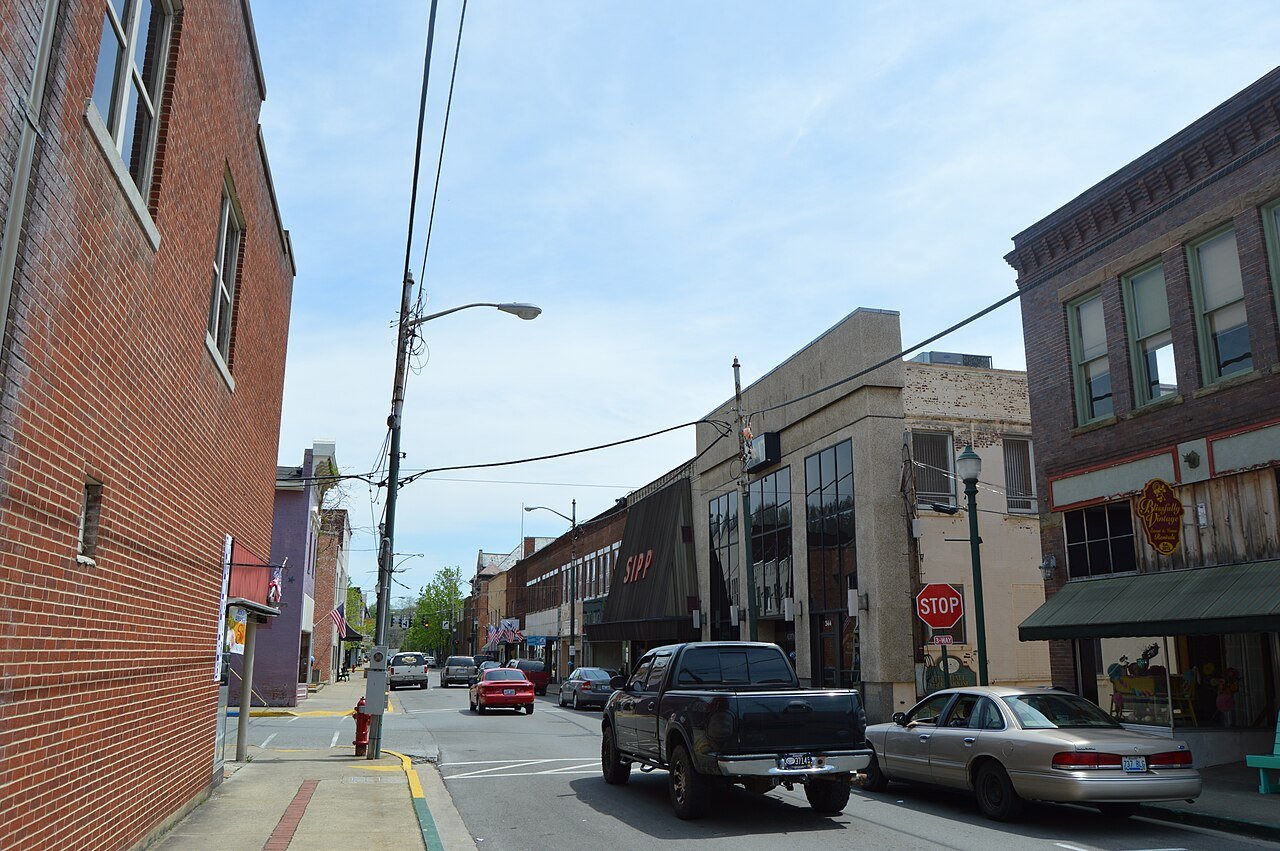
How this ranking works
We rank every town by street connectivity: intersections per square mile, the standard walkability measure the EPA uses. More intersections mean shorter, more direct walks, while cul-de-sac layouts with long dead ends rank lower. Sidewalks are not mapped consistently enough to rank, so this measures the street grid itself. The town with the highest figure ranks #1.
Only towns with at least 2,500 residents are ranked; Census estimates for smaller places are too uncertain. Population and income: U.S. Census Bureau American Community Survey 5-year estimates. Trails, streets and parks: © OpenStreetMap contributors (ODbL). Conserved land: USGS PAD-US. Measured within each town's Census boundary. Town photos: Wikimedia Commons, credited on each town’s page.