MSMississippi rankings

Safest towns in Mississippi

Ranked by crime reported to police per 1,000 residents, averaged over 2023–2025, with violent crimes counted four times as heavily as property crimes. Lower is safer. 41 towns with 2,500+ residents whose police reported every year.
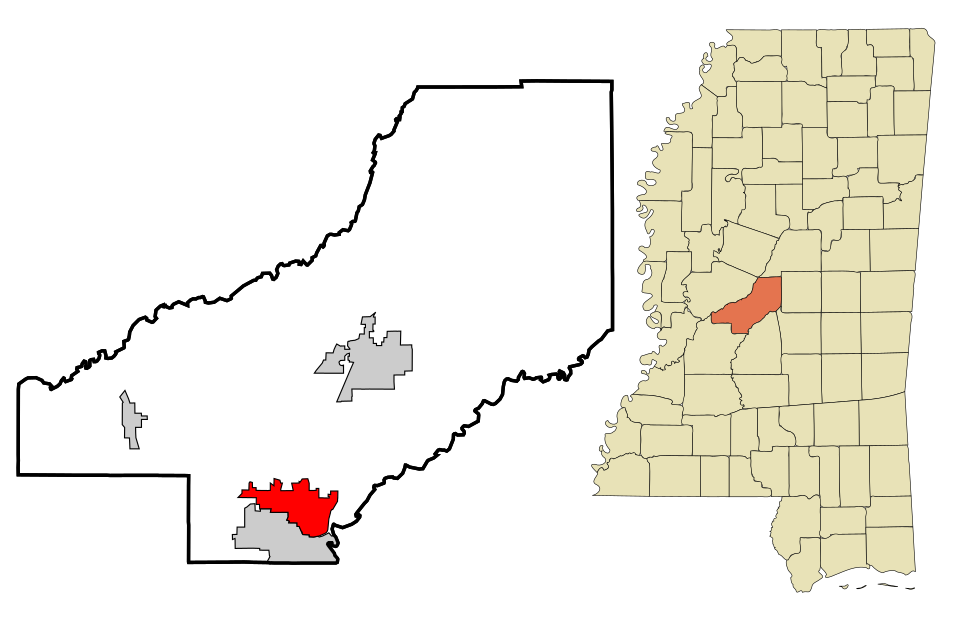
U.S. Census ACS 2020–2024 5-year

#TownWeighted crime rateViolentProperty
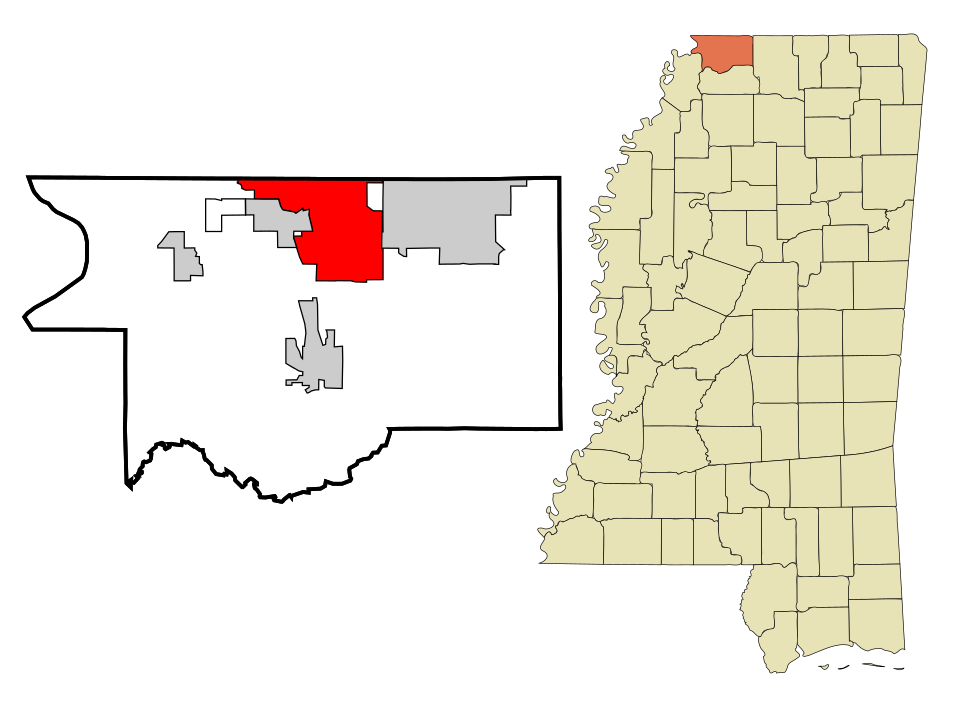
1 Map of Madison Madison27,946 people 6.2 0.4 per 1,000 4.6 per 1,000
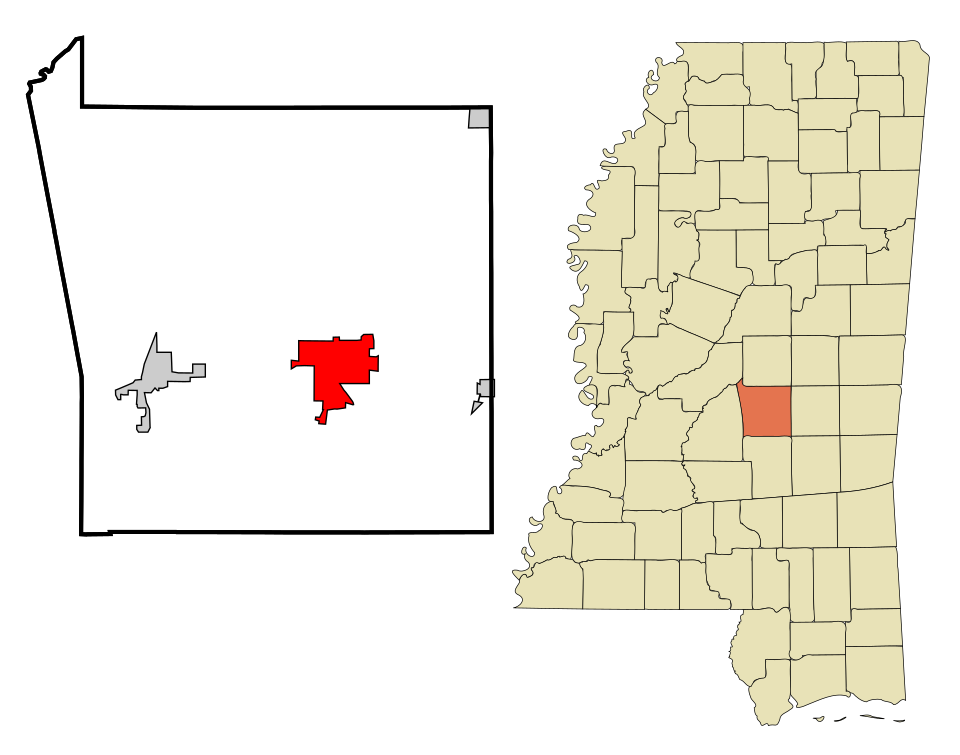
2 Brandon Brandon25,542 people 6.4 0.8 per 1,000 3.4 per 1,000
3 Petal Petal11,294 people 6.9 0.7 per 1,000 4.1 per 1,000

4 Hernando Hernando17,949 people 7.8 0.8 per 1,000 4.5 per 1,000
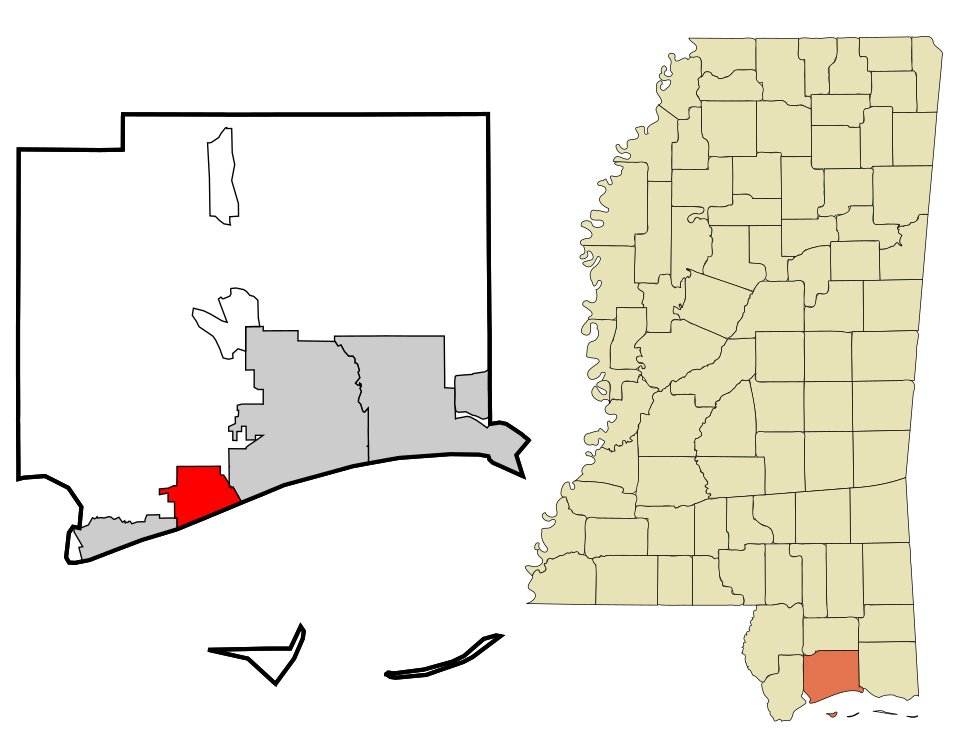
5 Map of Long Beach Long Beach17,009 people 11.0 0.5 per 1,000 9.1 per 1,000
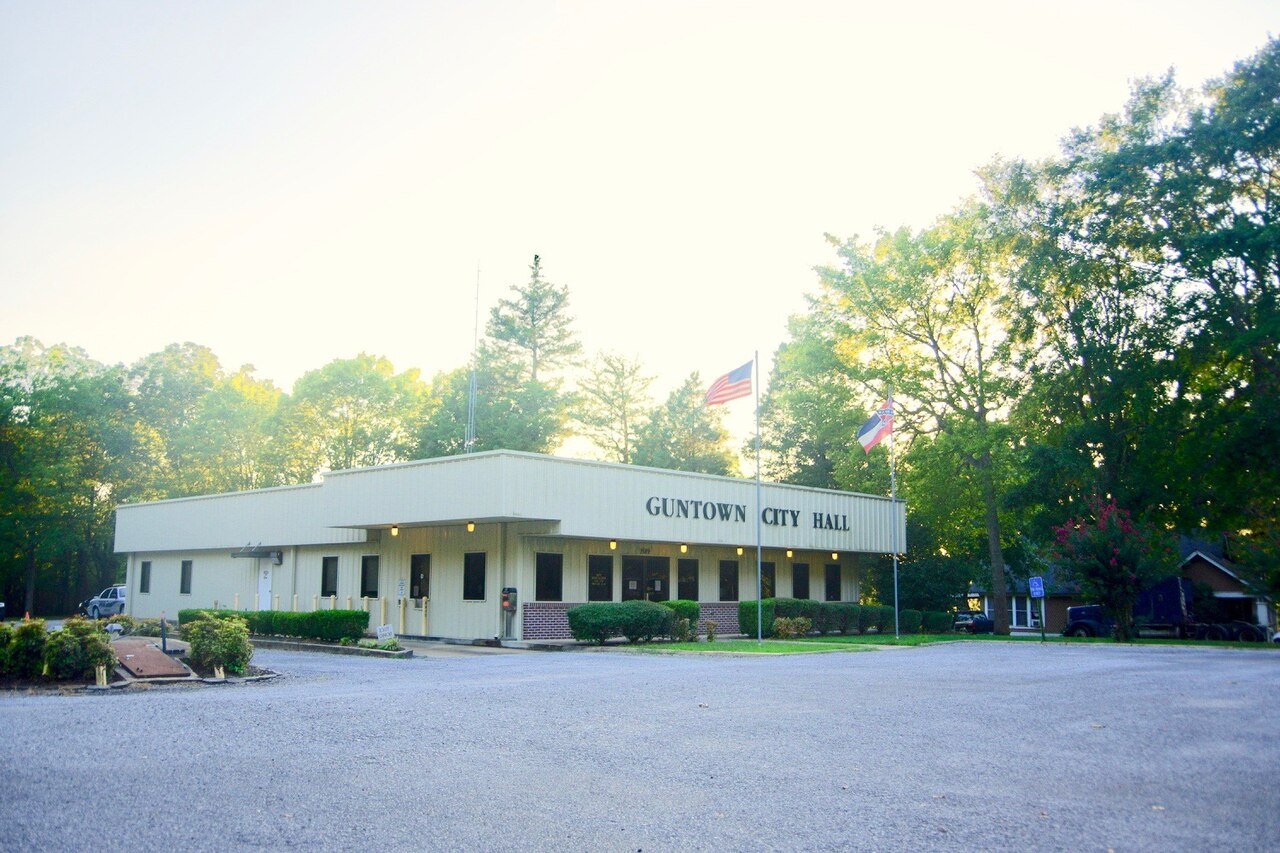
6 Guntown Guntown2,594 people 11.5 0.4 per 1,000 9.9 per 1,000
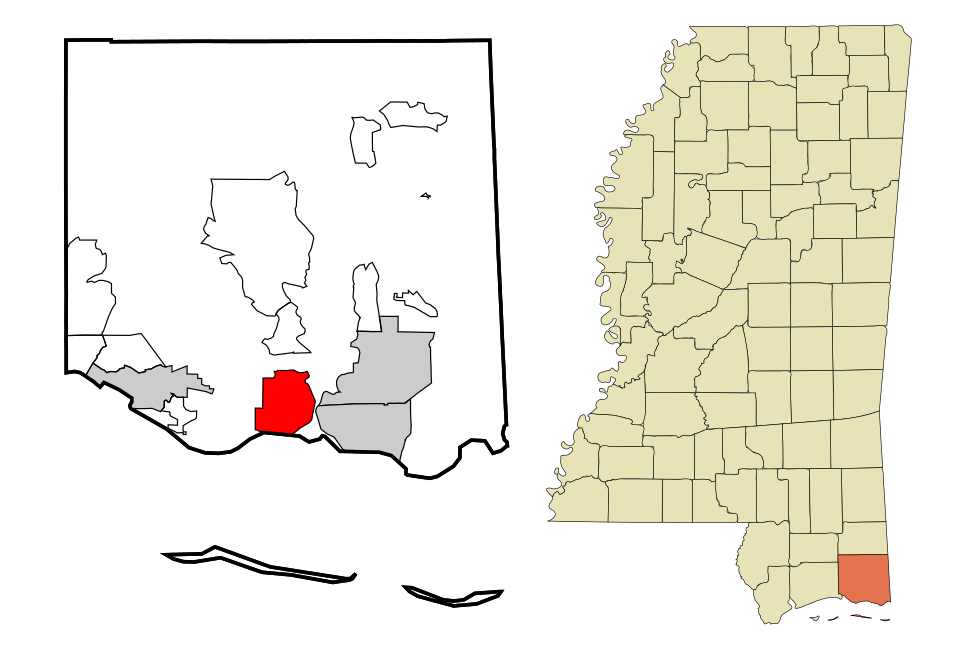
7 Pass Christian Pass Christian6,097 people 13.1 0.1 per 1,000 12.9 per 1,000
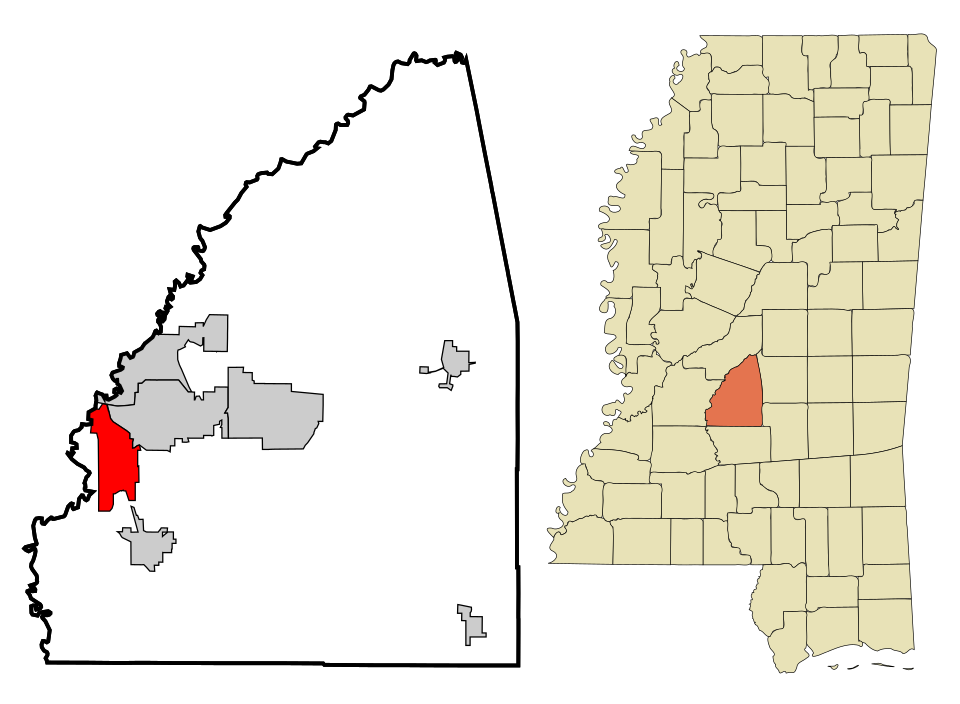
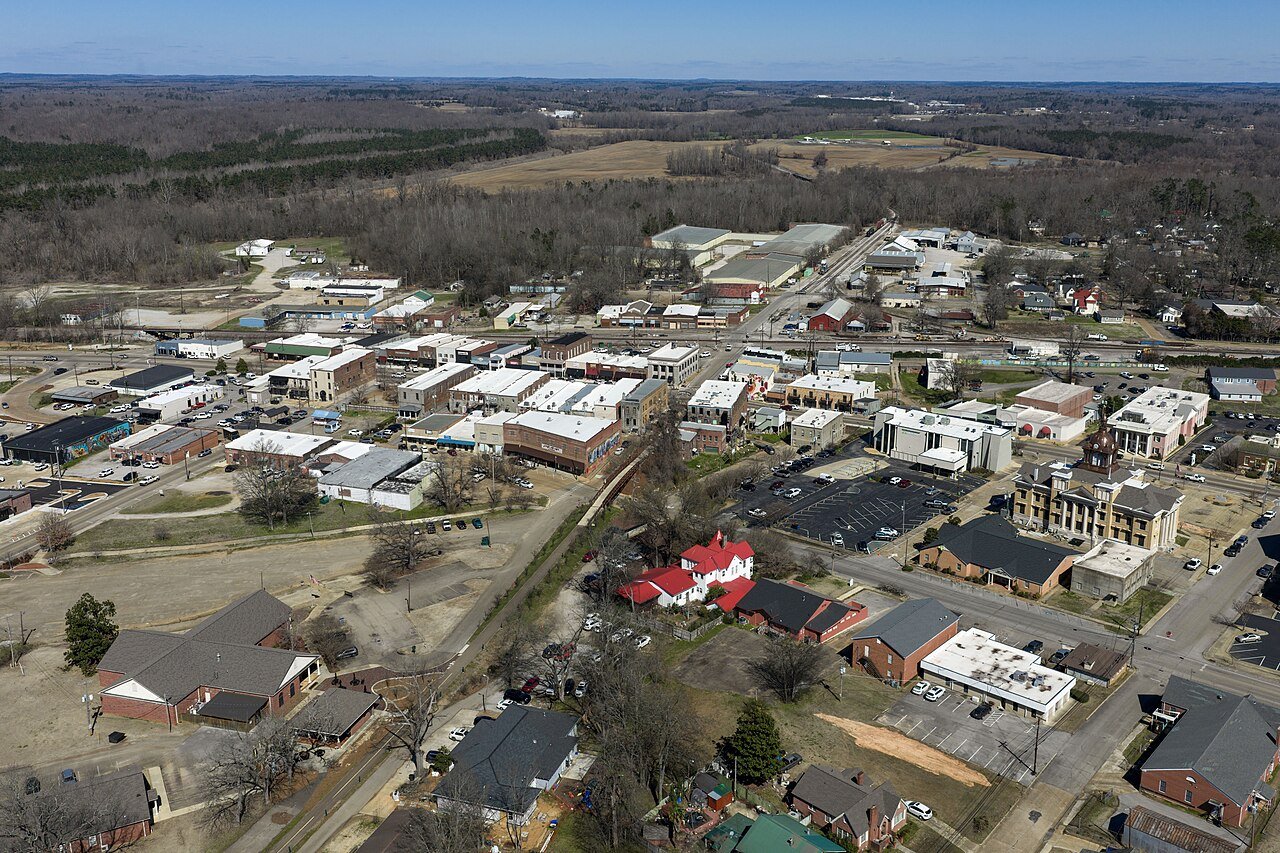
8 Clinton Clinton27,195 people 14.8 0.9 per 1,000 11.2 per 1,000
9 Byram Byram12,799 people 14.9 0.9 per 1,000 11.2 per 1,000
10 Map of Richland Richland7,346 people 15.0 1.2 per 1,000 10.1 per 1,000
11 New Albany New Albany7,663 people 16.5 0.8 per 1,000 13.3 per 1,000
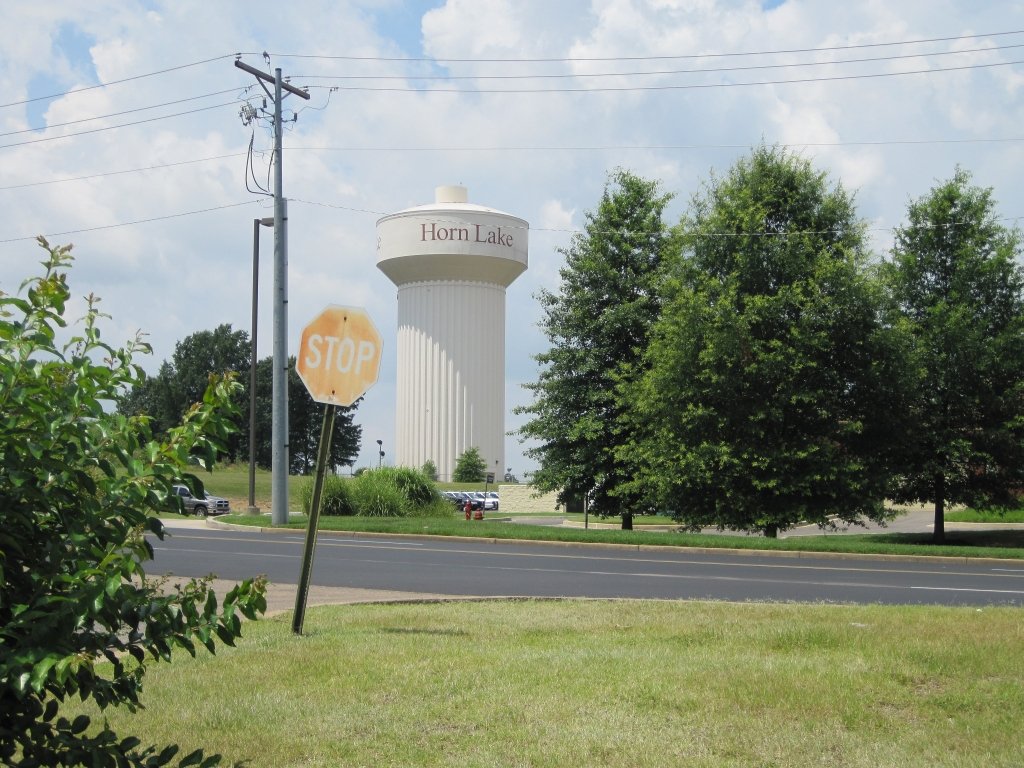
12 Horn Lake Horn Lake26,647 people 19.8 0.9 per 1,000 16.1 per 1,000
13 Iuka Iuka3,110 people 20.1 1.6 per 1,000 13.6 per 1,000
14 Ellisville Ellisville4,521 people 20.4 1.8 per 1,000 13.3 per 1,000
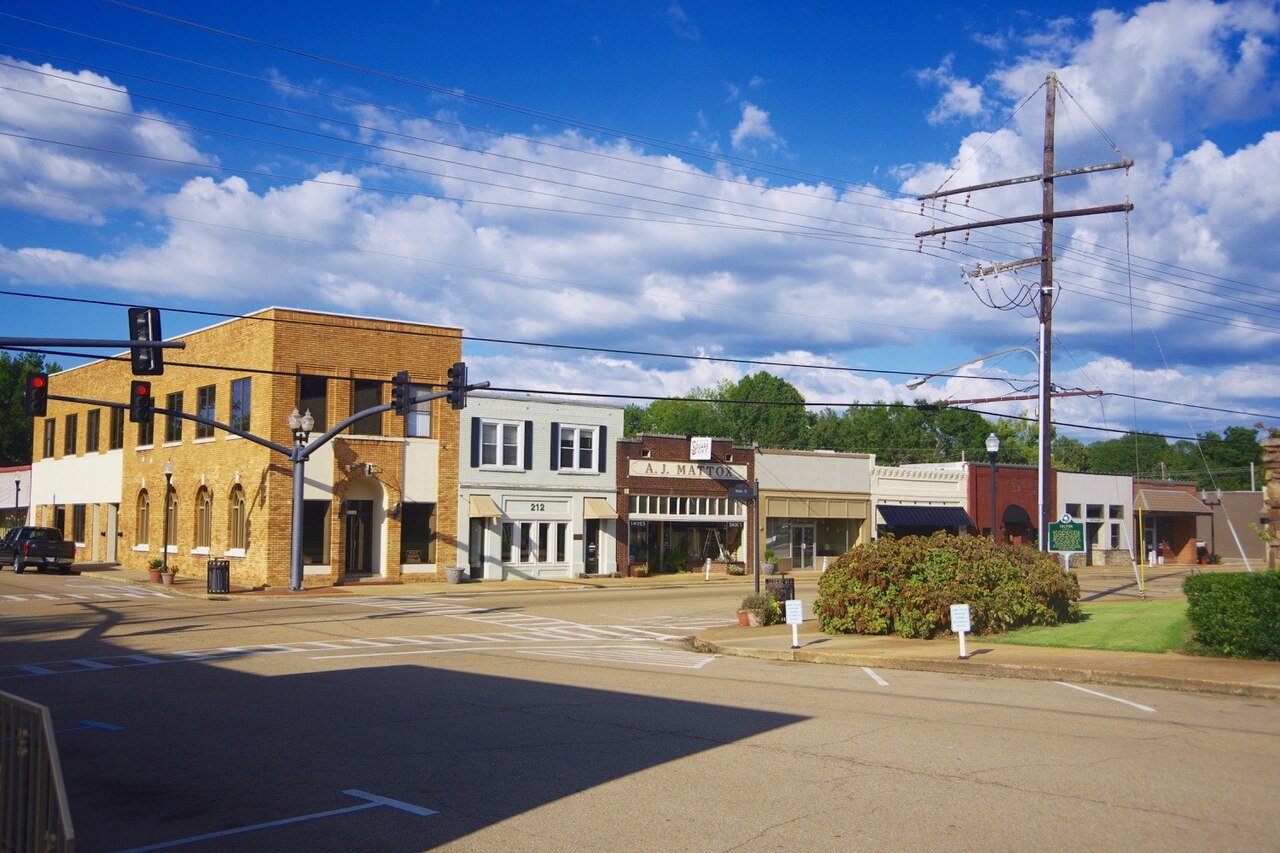
15 Fulton Fulton4,576 people 20.9 1.2 per 1,000 15.9 per 1,000
16 Olive Branch Olive Branch47,019 people 21.5 1.9 per 1,000 13.8 per 1,000
17 Poplarville Poplarville2,847 people 21.8 1.4 per 1,000 16.2 per 1,000
18 Oxford Oxford26,411 people 21.8 1.4 per 1,000 16.3 per 1,000
19 Kosciusko Kosciusko6,933 people 22.2 1.5 per 1,000 16.1 per 1,000
20 Waveland Waveland7,062 people 22.6 0.5 per 1,000 20.7 per 1,000
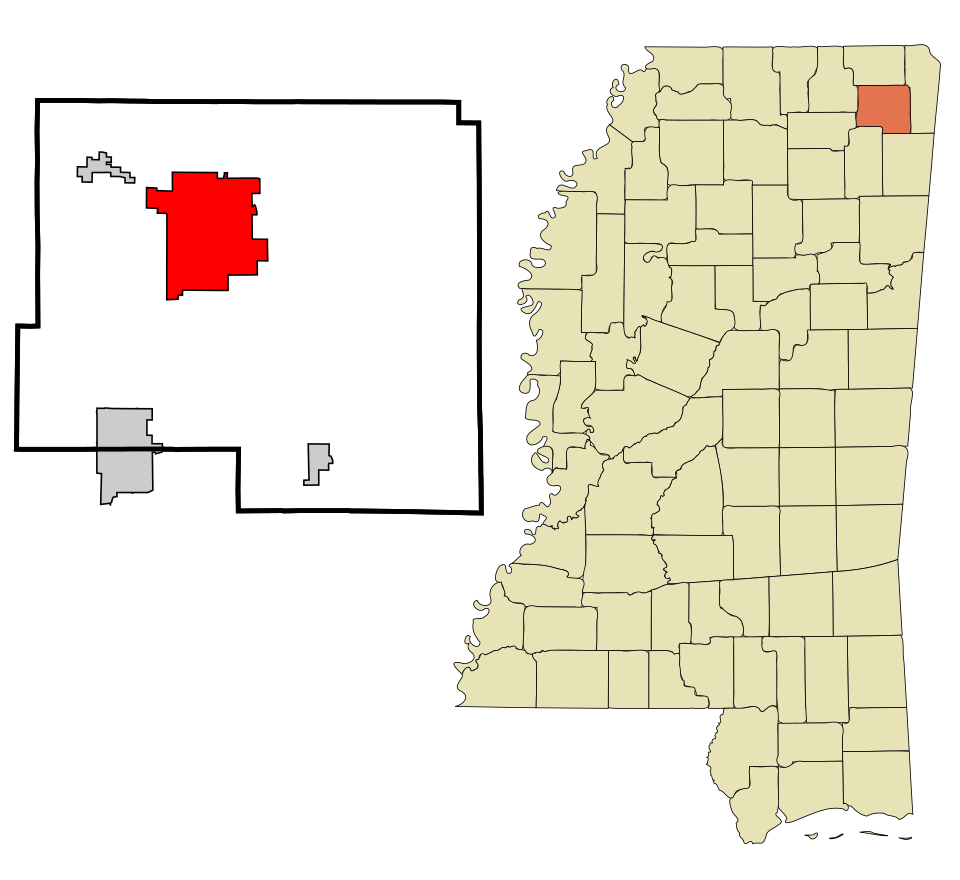
21 Starkville25,721 people 23.7 0.7 per 1,000 20.9 per 1,000
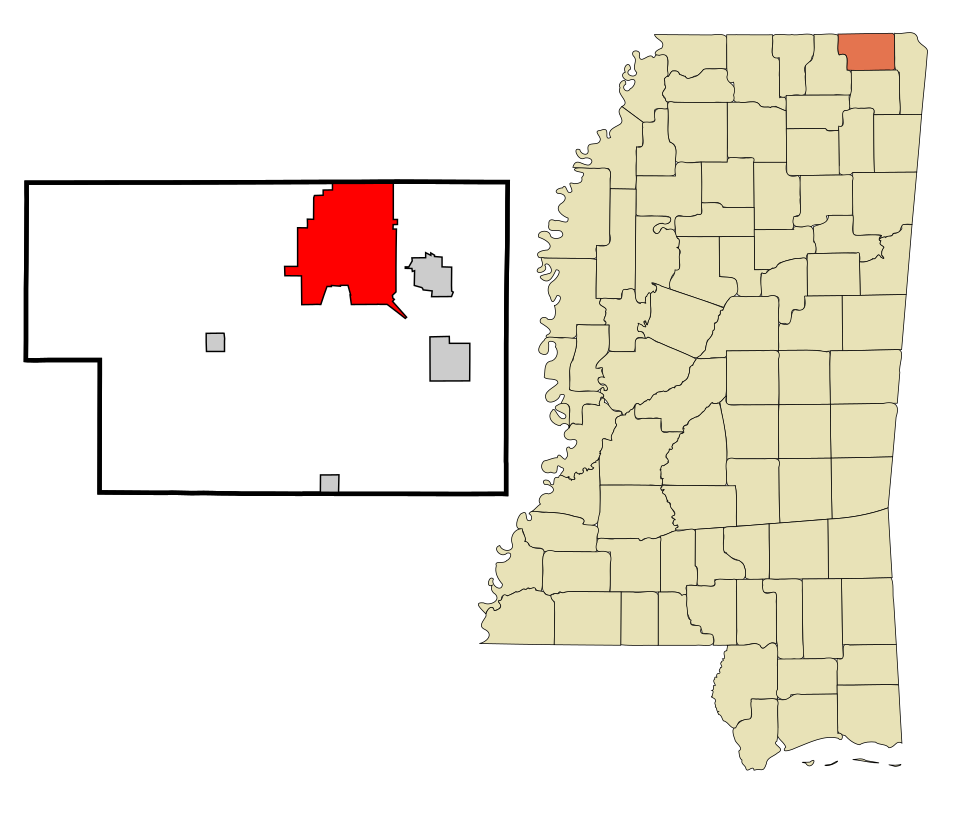
22 Senatobia Senatobia8,380 people 26.9 2.5 per 1,000 17.0 per 1,000
23 Bay St. Louis Bay St. Louis10,188 people 27.9 1.0 per 1,000 23.7 per 1,000
24 Map of Gautier Gautier19,046 people 30.0 2.5 per 1,000 20.1 per 1,000
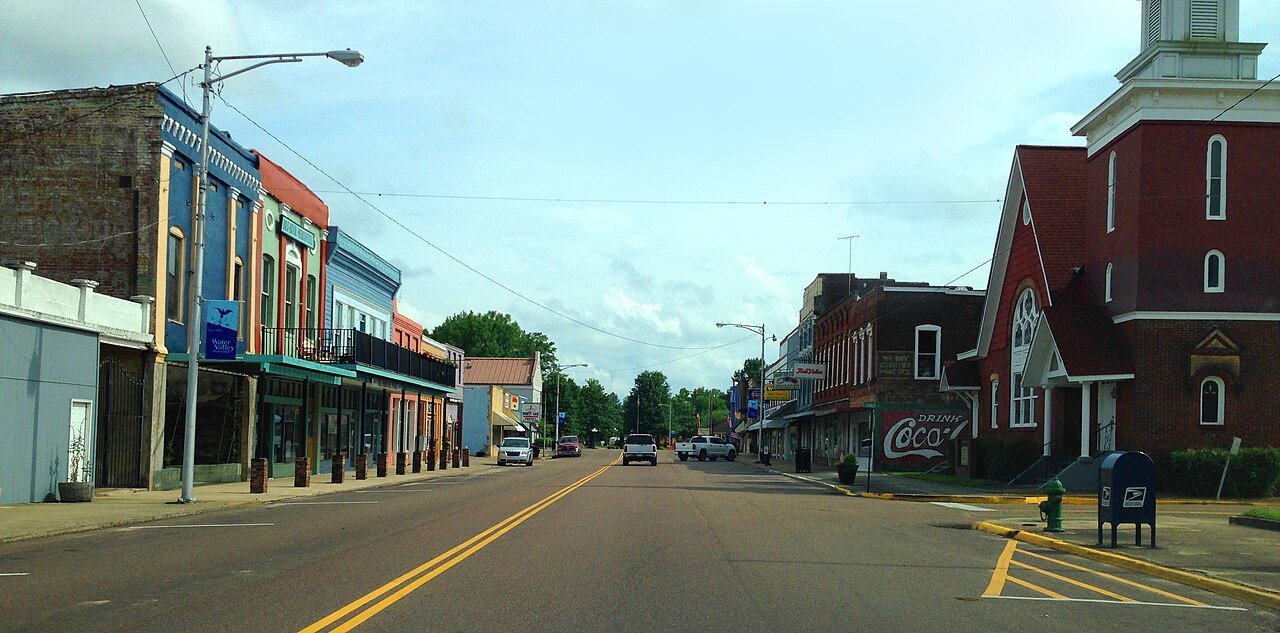
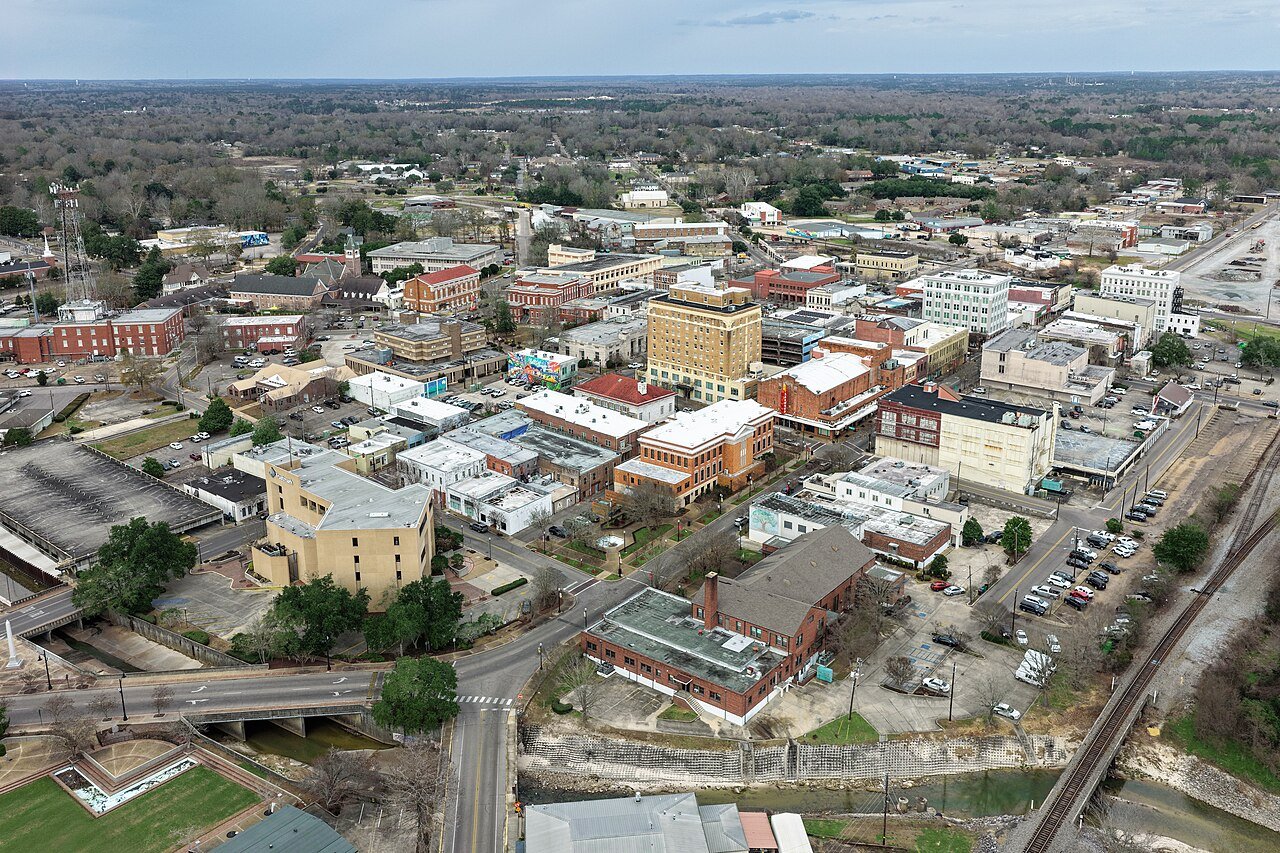
25 Pontotoc Pontotoc5,806 people 31.1 2.6 per 1,000 20.6 per 1,000
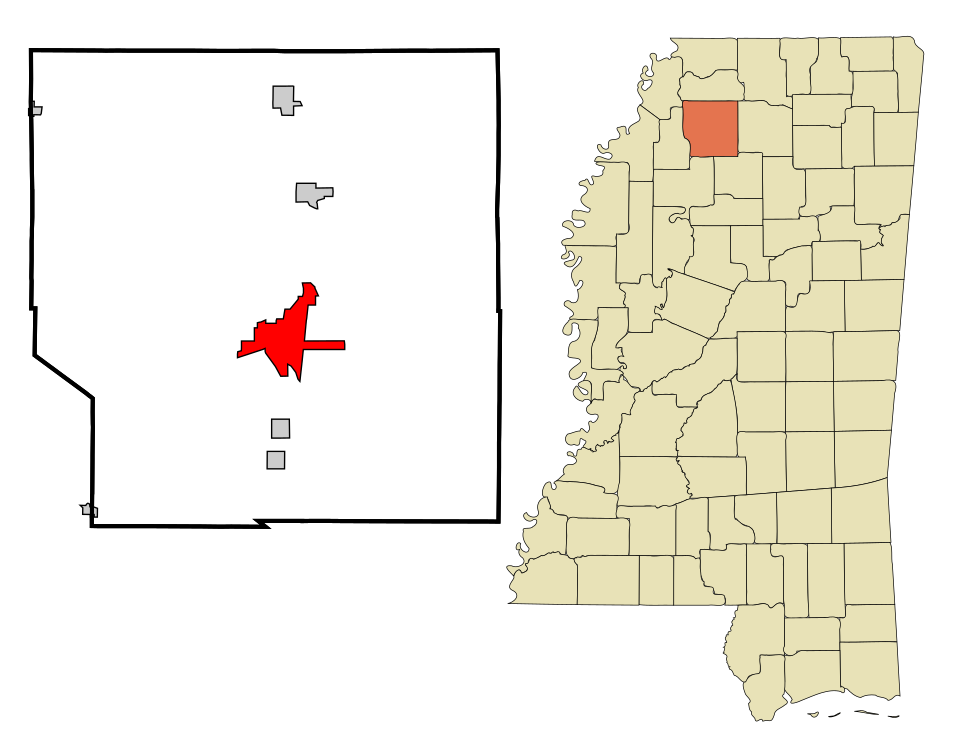
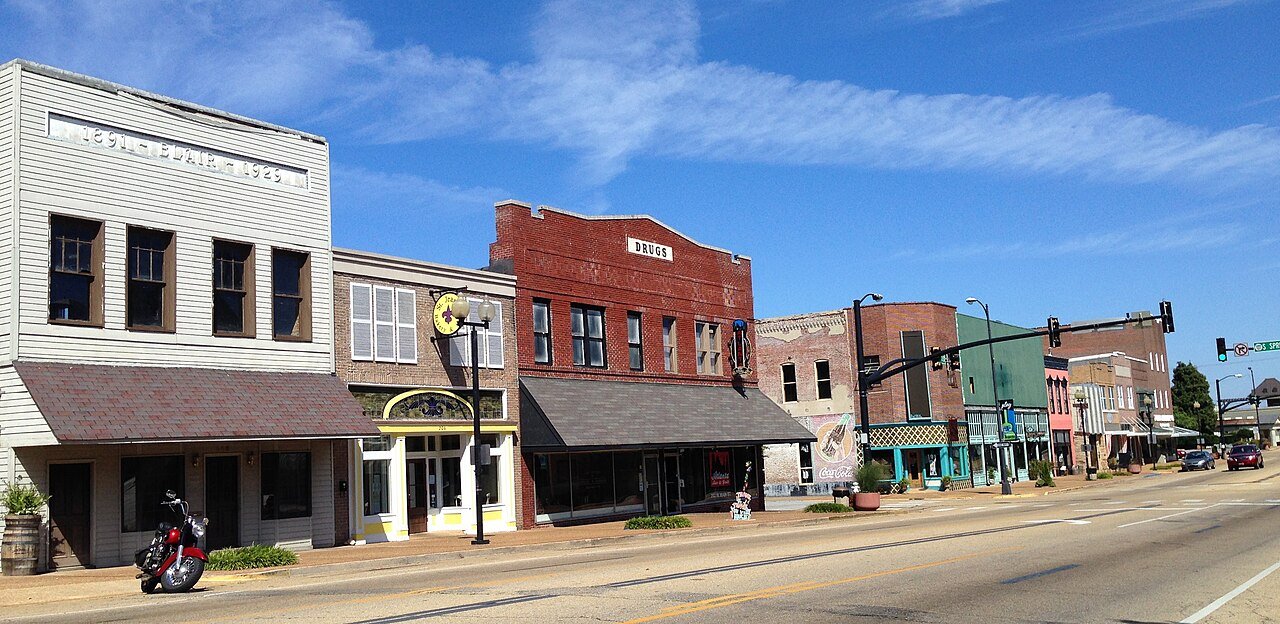
26 Map of Southaven Southaven56,226 people 33.5 2.6 per 1,000 23.0 per 1,000
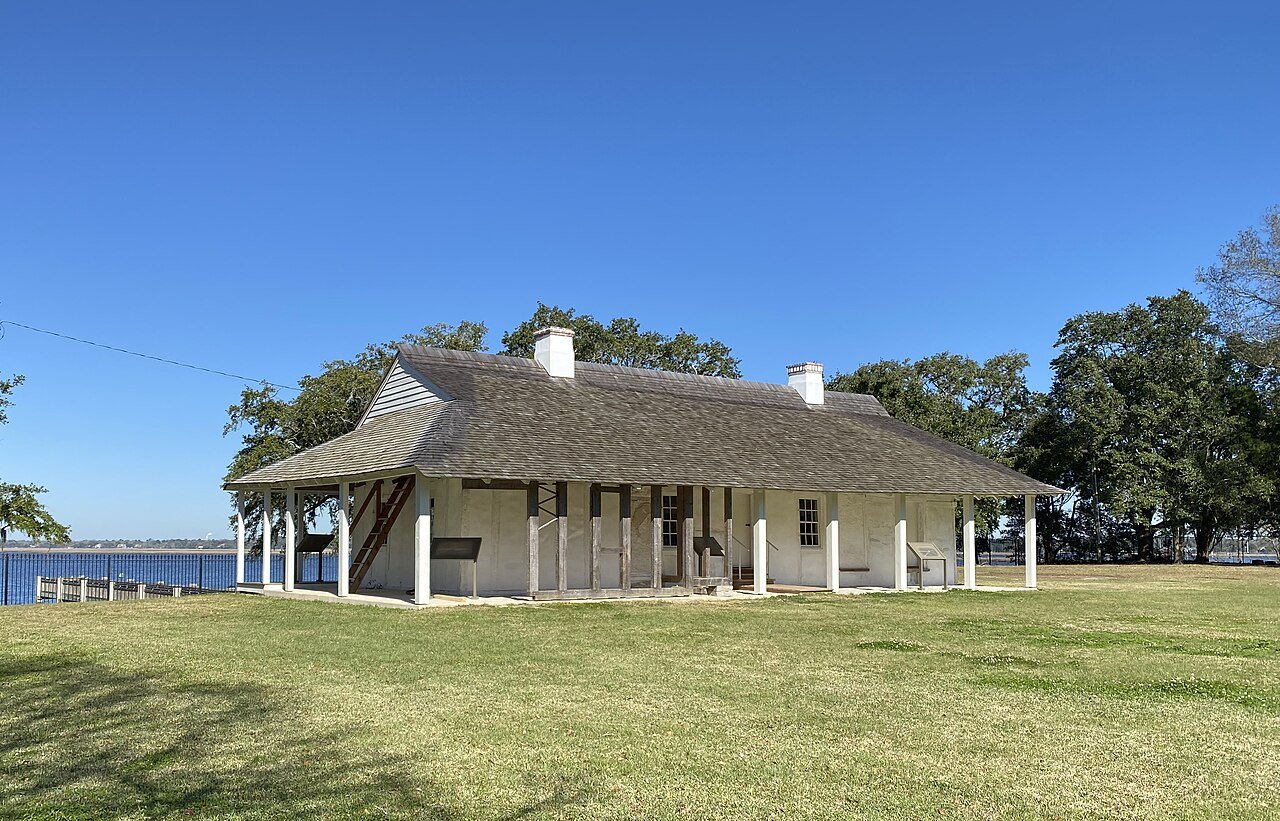
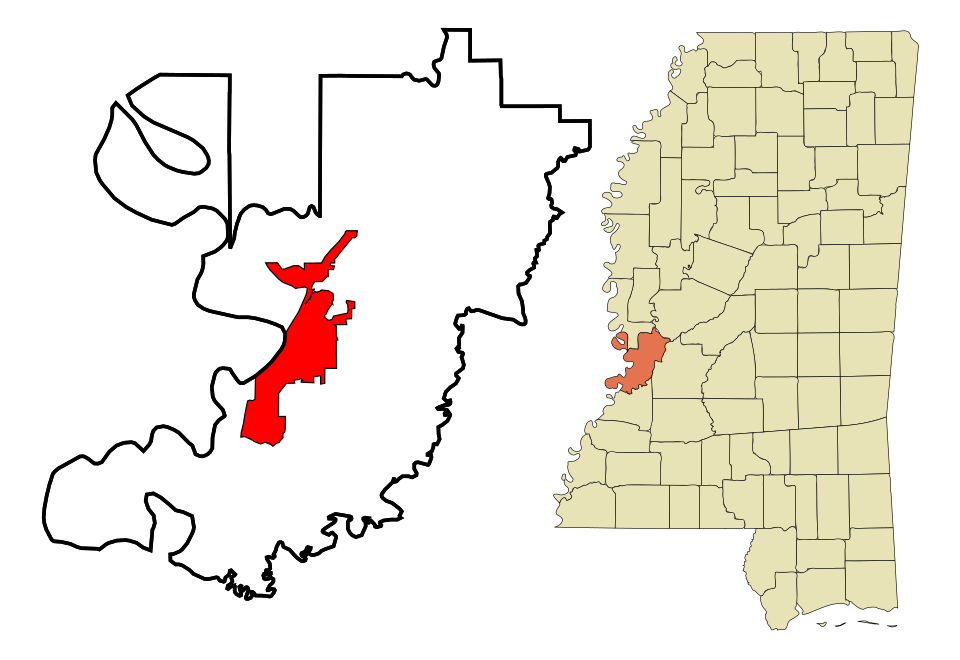
27 Map of Forest Forest5,357 people 33.7 5.4 per 1,000 12.3 per 1,000

28 Picayune11,900 people 36.5 2.9 per 1,000 24.7 per 1,000
29 Wiggins Wiggins4,293 people 37.7 2.6 per 1,000 27.1 per 1,000
30 West Point West Point9,900 people 41.5 5.8 per 1,000 18.1 per 1,000
31 Amory Amory6,500 people 43.1 5.1 per 1,000 22.7 per 1,000
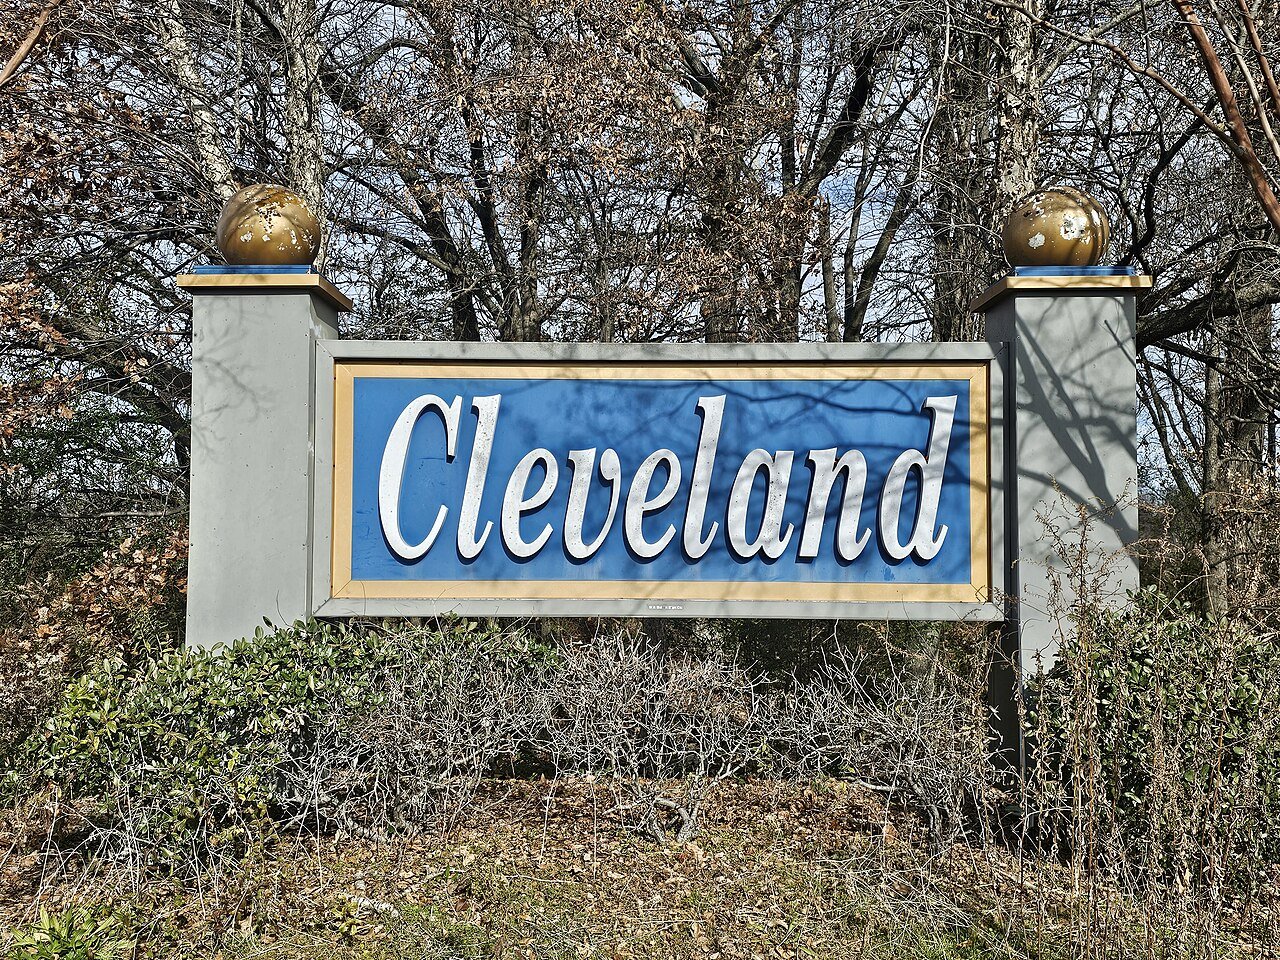
32 Cleveland Cleveland10,623 people 45.1 4.4 per 1,000 27.4 per 1,000
33 Map of Booneville Booneville9,246 people 46.1 3.1 per 1,000 33.5 per 1,000
34 Map of Corinth Corinth14,323 people 46.3 3.1 per 1,000 33.9 per 1,000
35 Water Valley Water Valley3,376 people 47.0 4.4 per 1,000 29.2 per 1,000
36 Hattiesburg Hattiesburg48,619 people 47.4 2.4 per 1,000 37.6 per 1,000
37 Map of Batesville Batesville7,387 people 50.4 3.2 per 1,000 37.7 per 1,000
38 Tupelo Tupelo37,791 people 52.4 3.8 per 1,000 37.2 per 1,000
39 Pascagoula Pascagoula21,710 people 57.2 3.2 per 1,000 44.3 per 1,000
40 Map of Vicksburg Vicksburg20,589 people 62.8 6.4 per 1,000 37.2 per 1,000
41 Laurel Laurel17,679 people 76.1 9.4 per 1,000 38.7 per 1,000

How this ranking works

For each town we add up the violent and property crimes its police reported to the FBI over 2023–2025 and divide by the population they served, giving a rate per 1,000 residents. Violent crimes (homicide, rape, robbery and aggravated assault) count four times as much as property crimes (burglary, theft, vehicle theft and arson), because they weigh more on how safe a place feels. The lowest weighted rate ranks #1.

These are crimes reported to police, not convictions, and towns with a campus, highway, beach or shopping center also count incidents involving visitors. A town is ranked only if its police department reported a full year in every one of these years; towns patrolled by a county sheriff or state police don't have their own figures. There is no “most dangerous” list, on purpose.

Only towns with at least 2,500 residents are ranked; Census estimates for smaller places are too uncertain. Population and income: U.S. Census Bureau American Community Survey 5-year estimates. Crime: FBI Uniform Crime Reporting Program, offenses known to law enforcement by city. Town photos: Wikimedia Commons, credited on each town’s page.

Same ranking in other states