Safest towns in Delaware
Ranked by crime reported to police per 1,000 residents, averaged over 2023–2025, with violent crimes counted four times as heavily as property crimes. Lower is safer. 21 towns with 2,500+ residents whose police reported every year.
 2
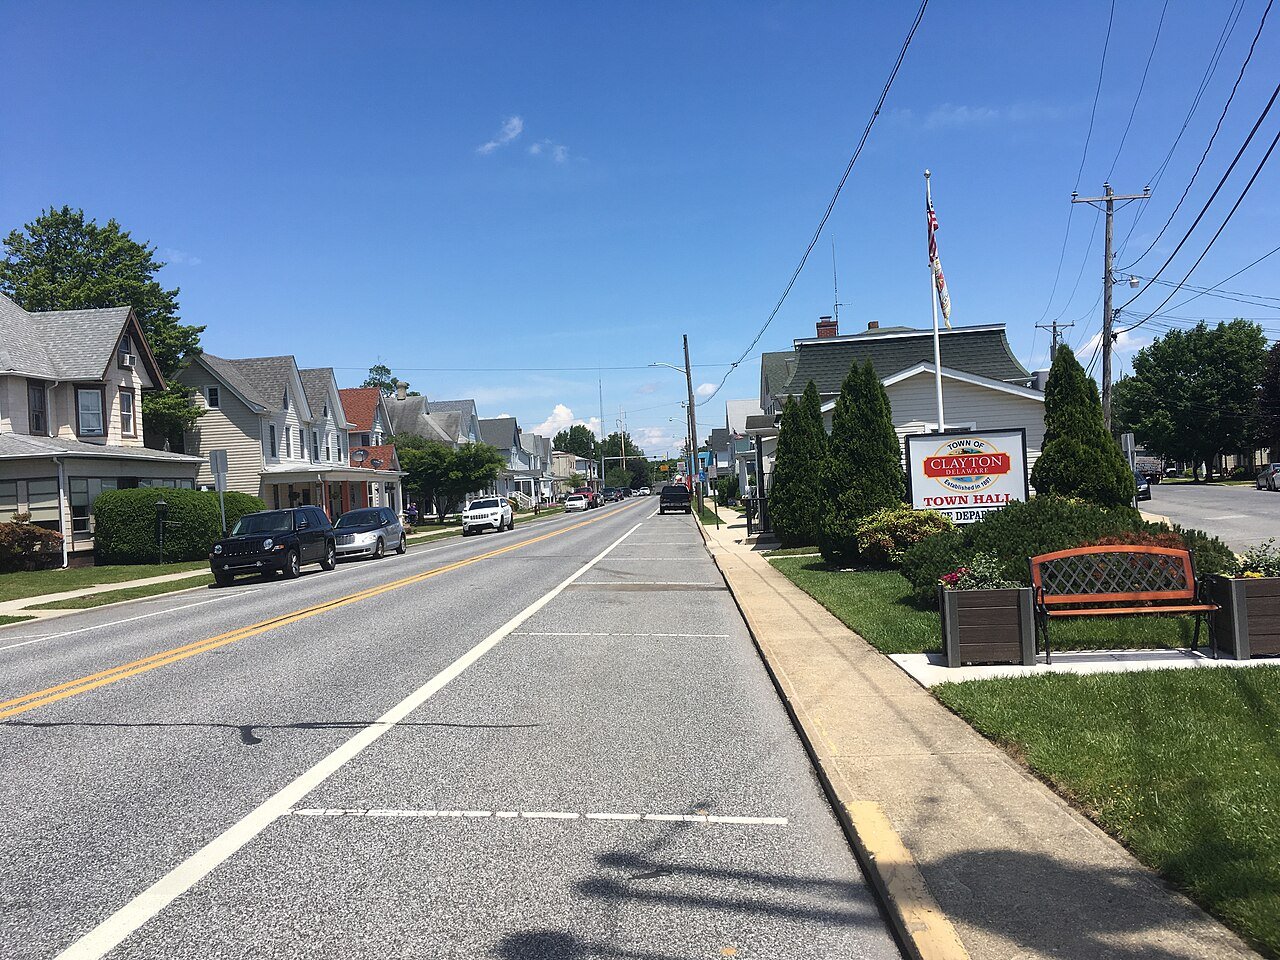
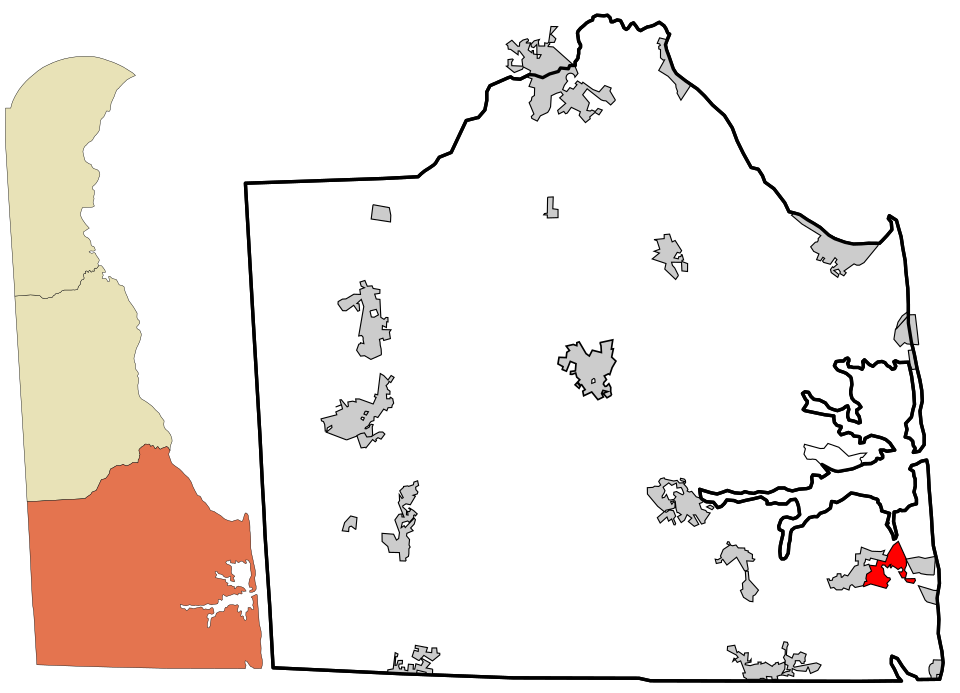
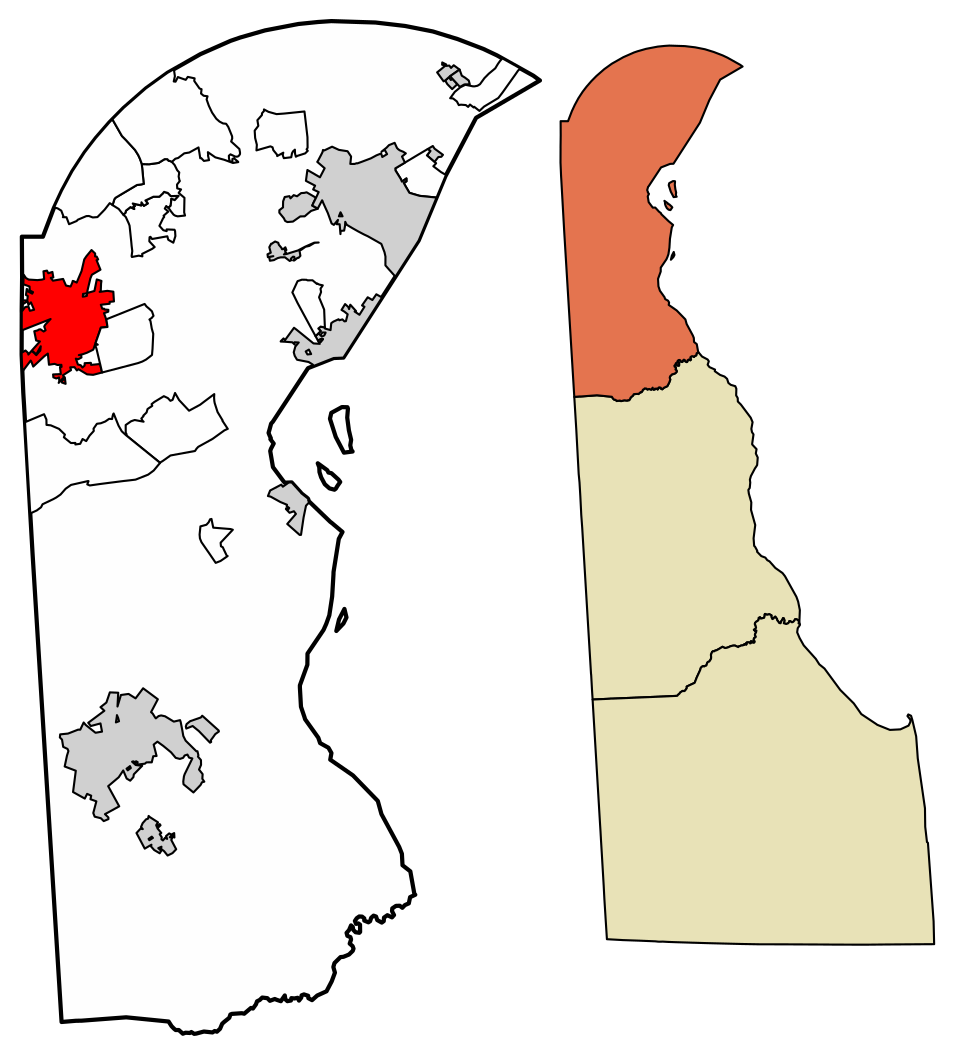
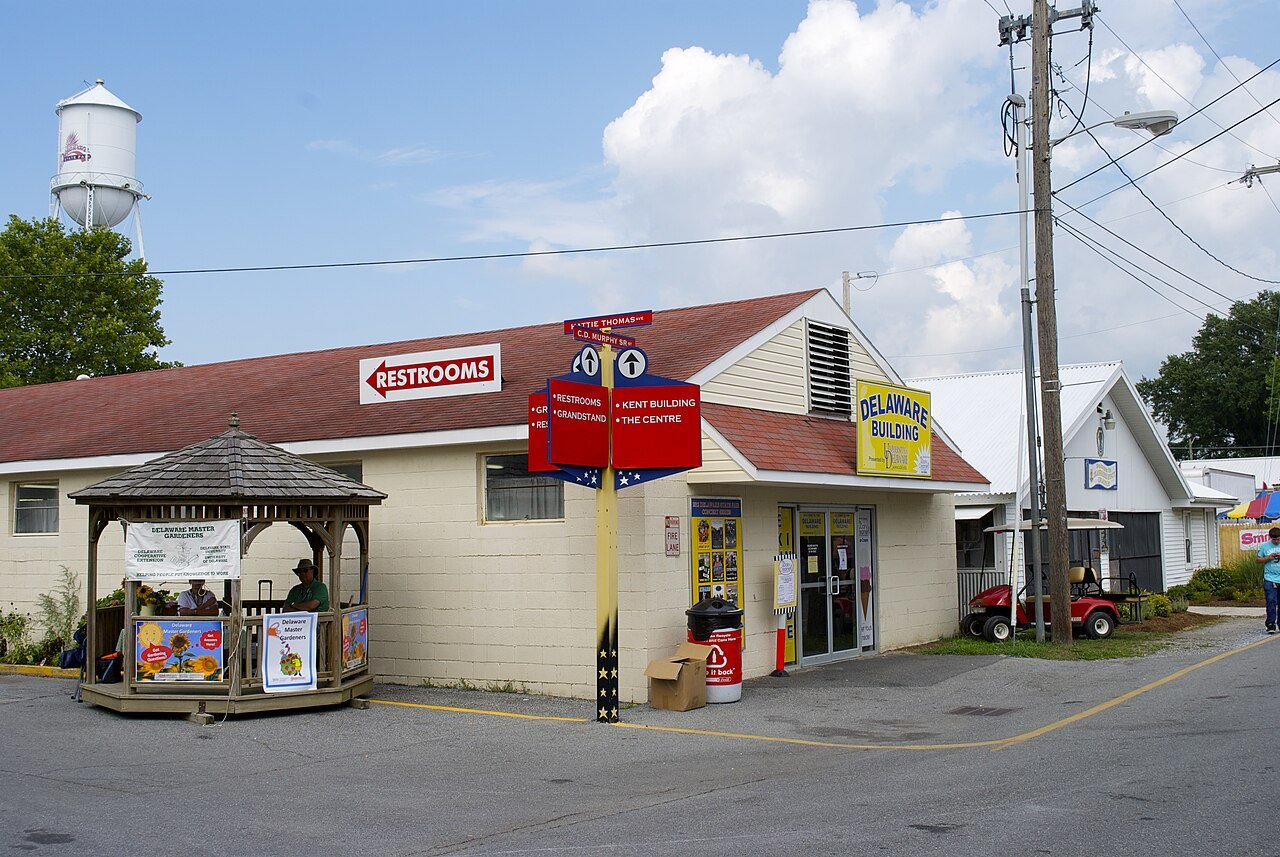
Clayton
8.3
Violent 1.1 per 1,000
2
Clayton
8.3
Violent 1.1 per 1,000
 3
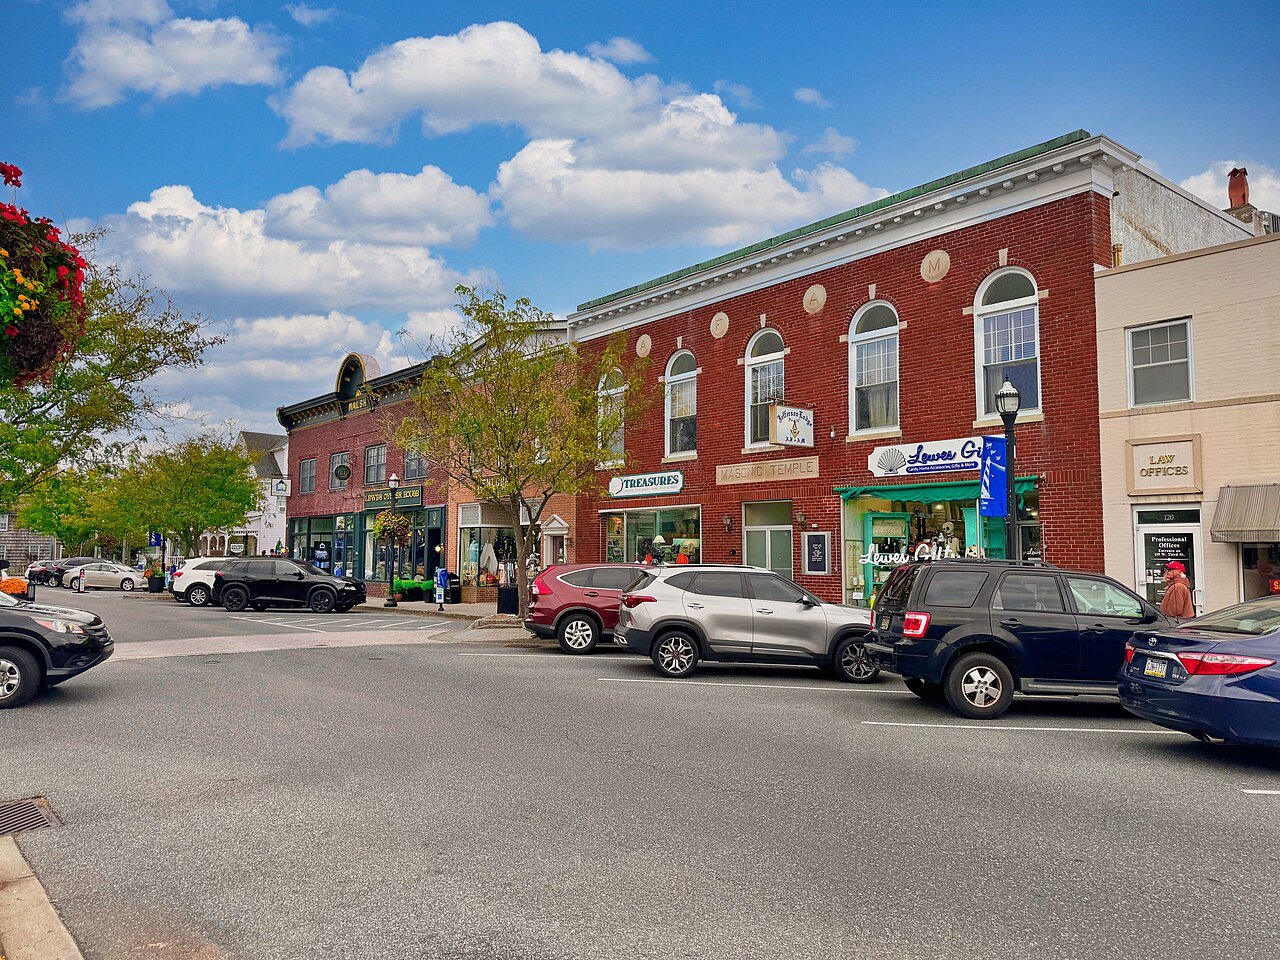
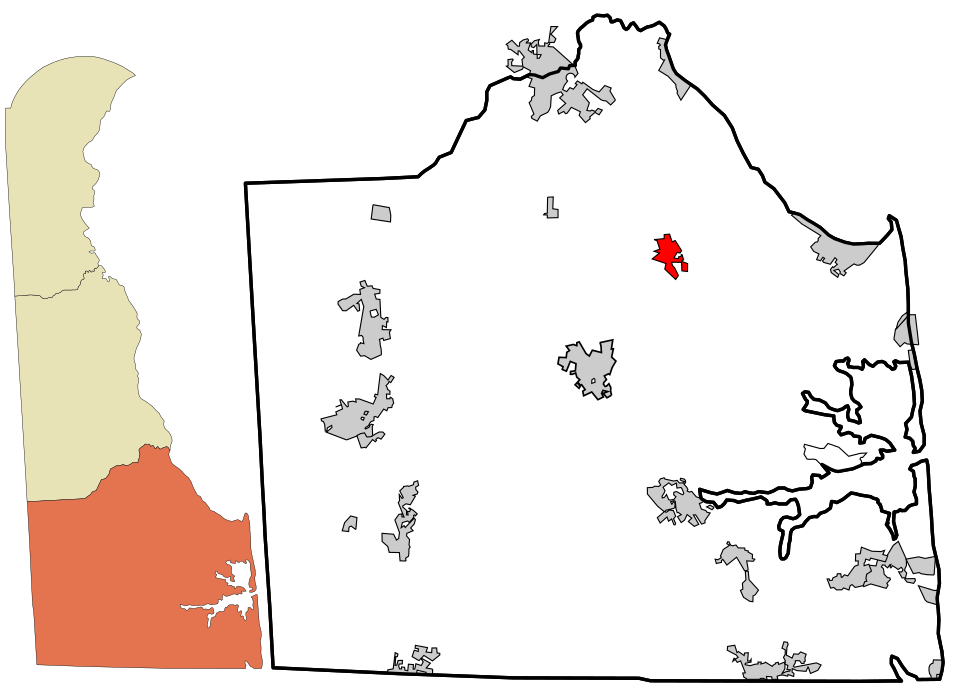
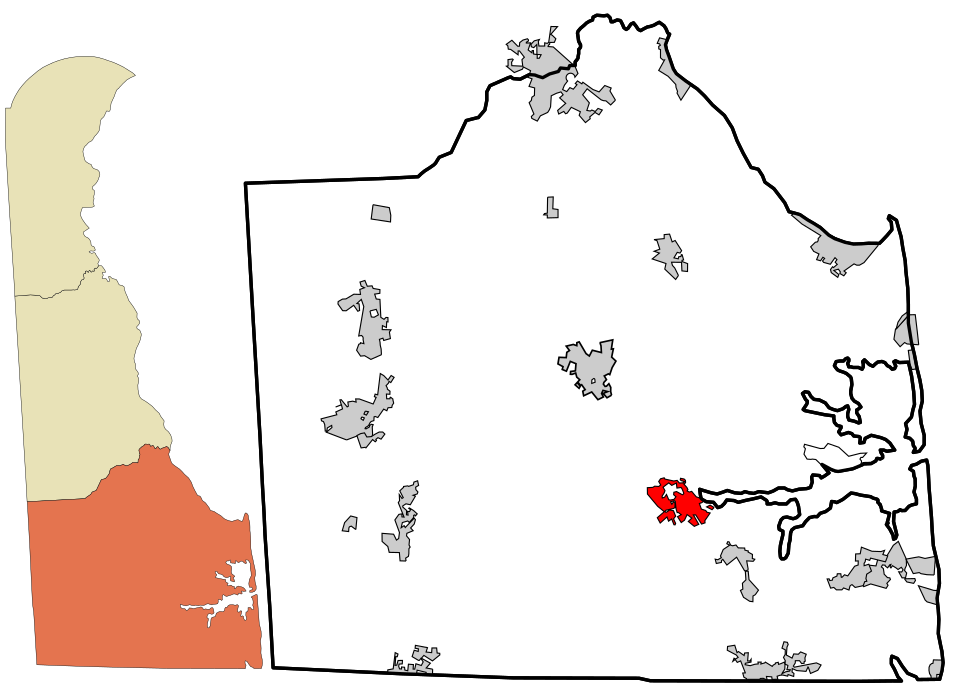
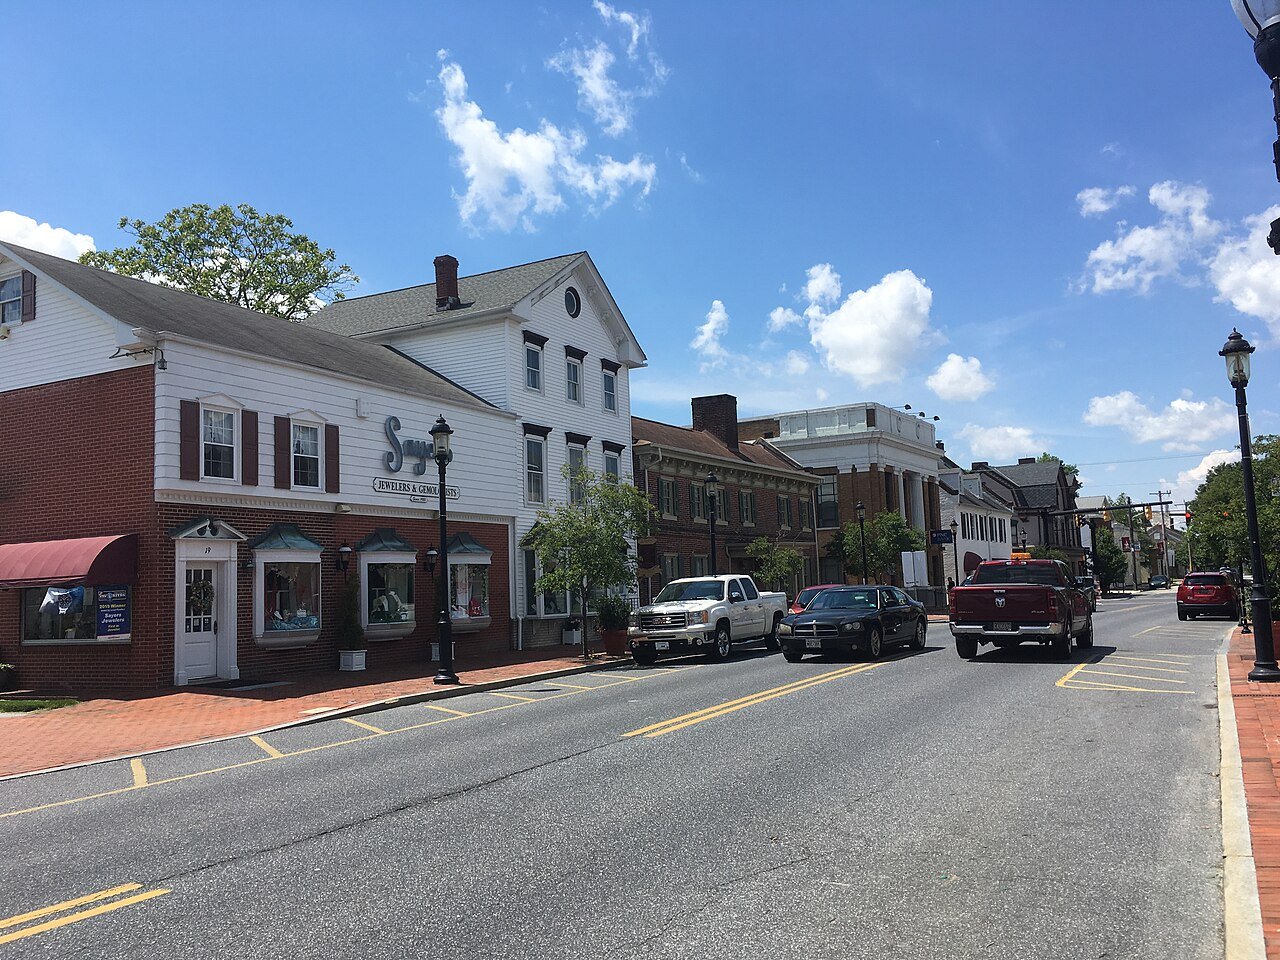
Ocean View
9.2
Violent 1.0 per 1,000
3
Ocean View
9.2
Violent 1.0 per 1,000


How this ranking works
For each town we add up the violent and property crimes its police reported to the FBI over 2023–2025 and divide by the population they served, giving a rate per 1,000 residents. Violent crimes (homicide, rape, robbery and aggravated assault) count four times as much as property crimes (burglary, theft, vehicle theft and arson), because they weigh more on how safe a place feels. The lowest weighted rate ranks #1.
These are crimes reported to police, not convictions, and towns with a campus, highway, beach or shopping center also count incidents involving visitors. A town is ranked only if its police department reported a full year in every one of these years; towns patrolled by a county sheriff or state police don't have their own figures. There is no “most dangerous” list, on purpose.
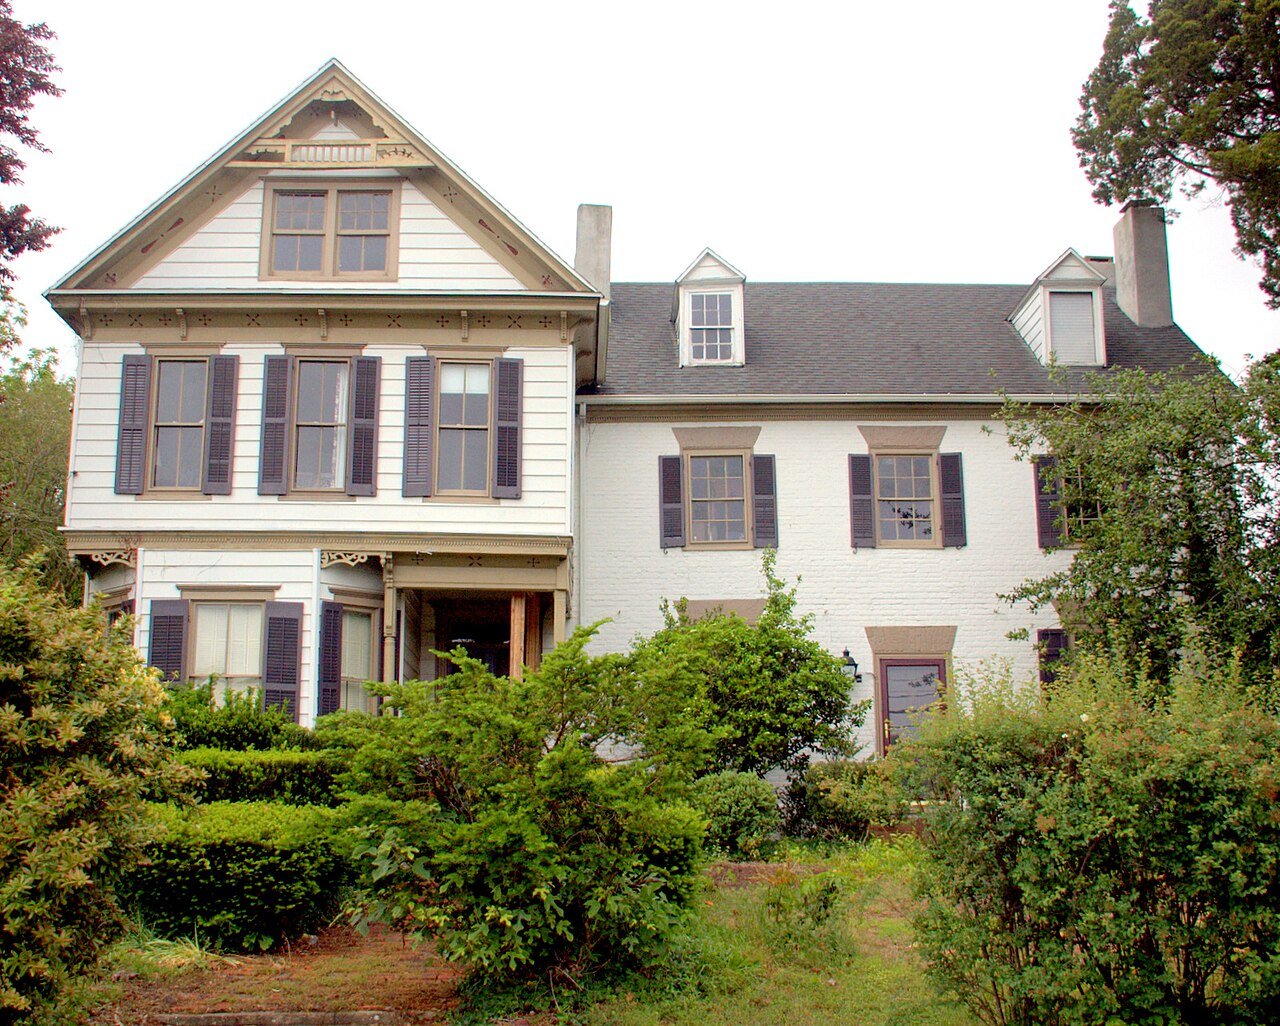
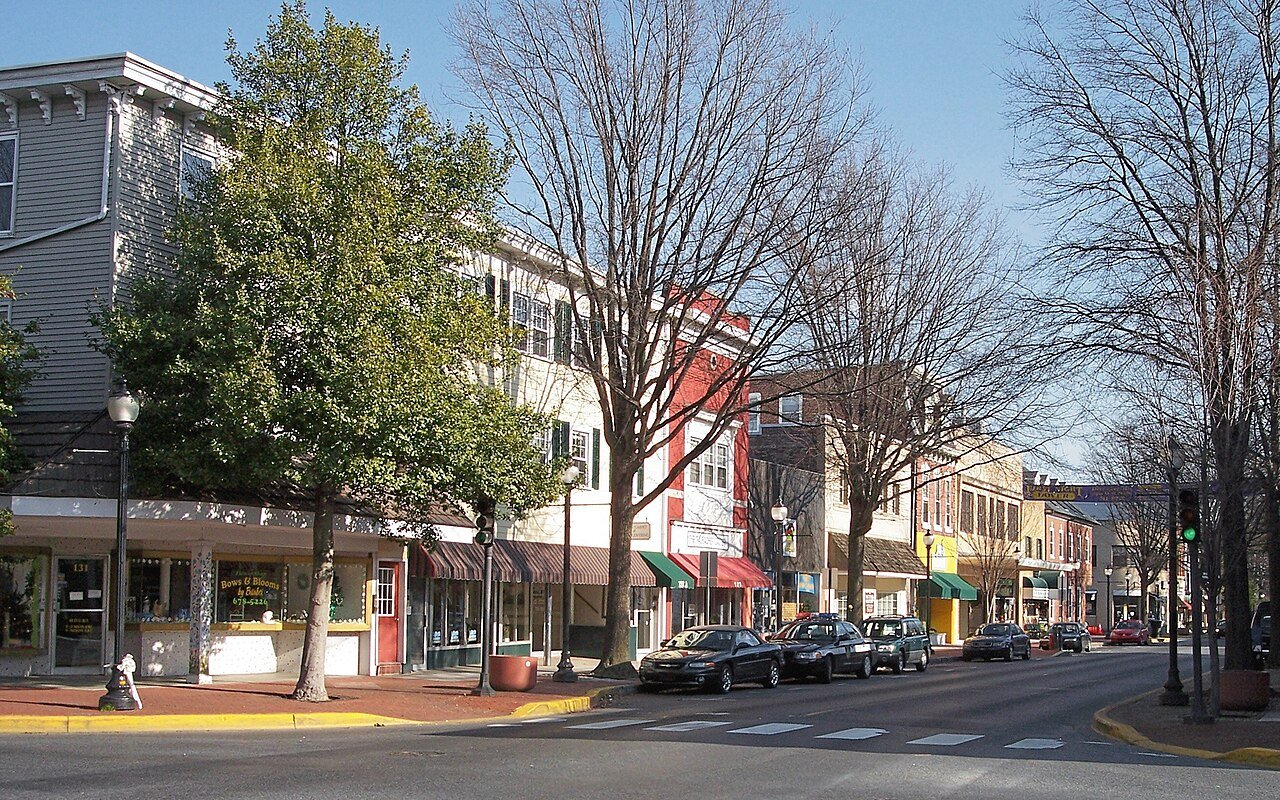
Only towns with at least 2,500 residents are ranked; Census estimates for smaller places are too uncertain. Population and income: U.S. Census Bureau American Community Survey 5-year estimates. Crime: FBI Uniform Crime Reporting Program, offenses known to law enforcement by city. Town photos: Wikimedia Commons, credited on each town’s page.