LALouisiana rankings

Safest towns in Louisiana

Ranked by crime reported to police per 1,000 residents, averaged over 2023–2025, with violent crimes counted four times as heavily as property crimes. Lower is safer. 45 towns with 2,500+ residents whose police reported every year.
U.S. Census ACS 2020–2024 5-year

#TownWeighted crime rateViolentProperty
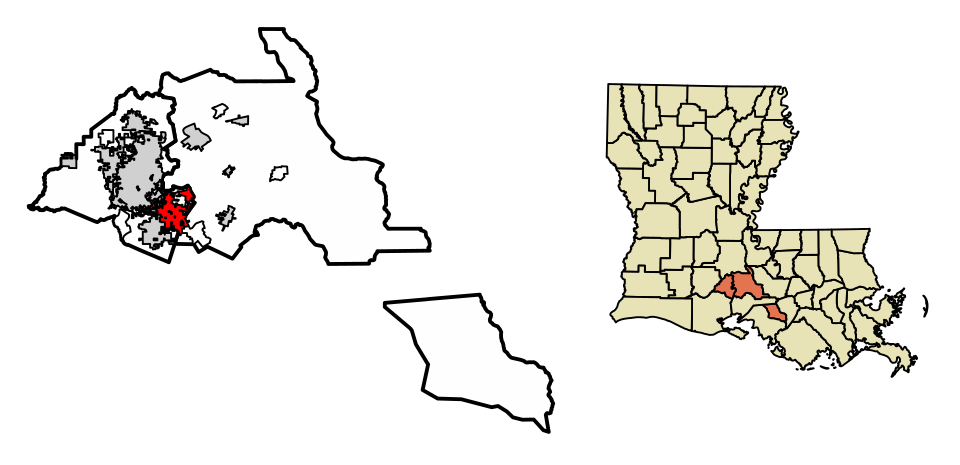
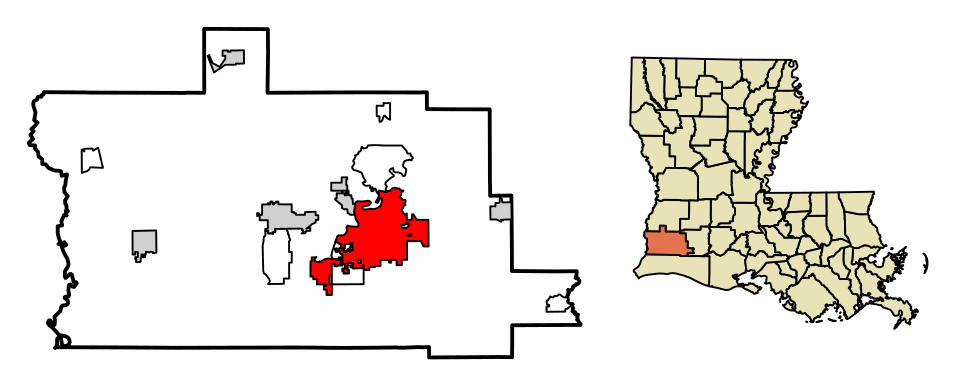
1 Map of Lake Arthur Lake Arthur2,585 people 6.4 1.3 per 1,000 1.2 per 1,000
2 Map of Addis Addis7,252 people 9.0 0.8 per 1,000 5.9 per 1,000
3 Map of Blanchard Blanchard3,437 people 11.3 1.8 per 1,000 4.2 per 1,000
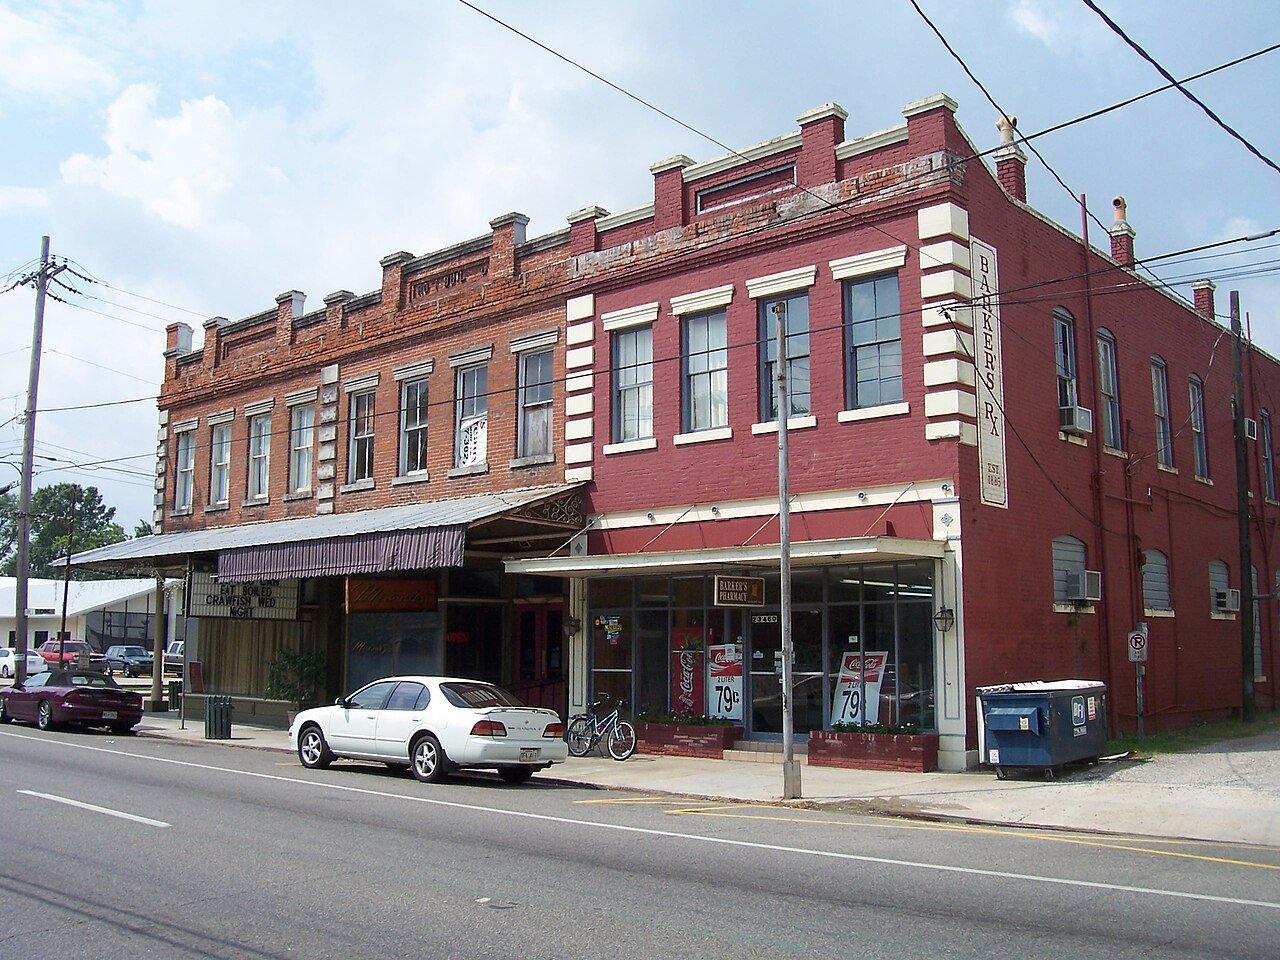
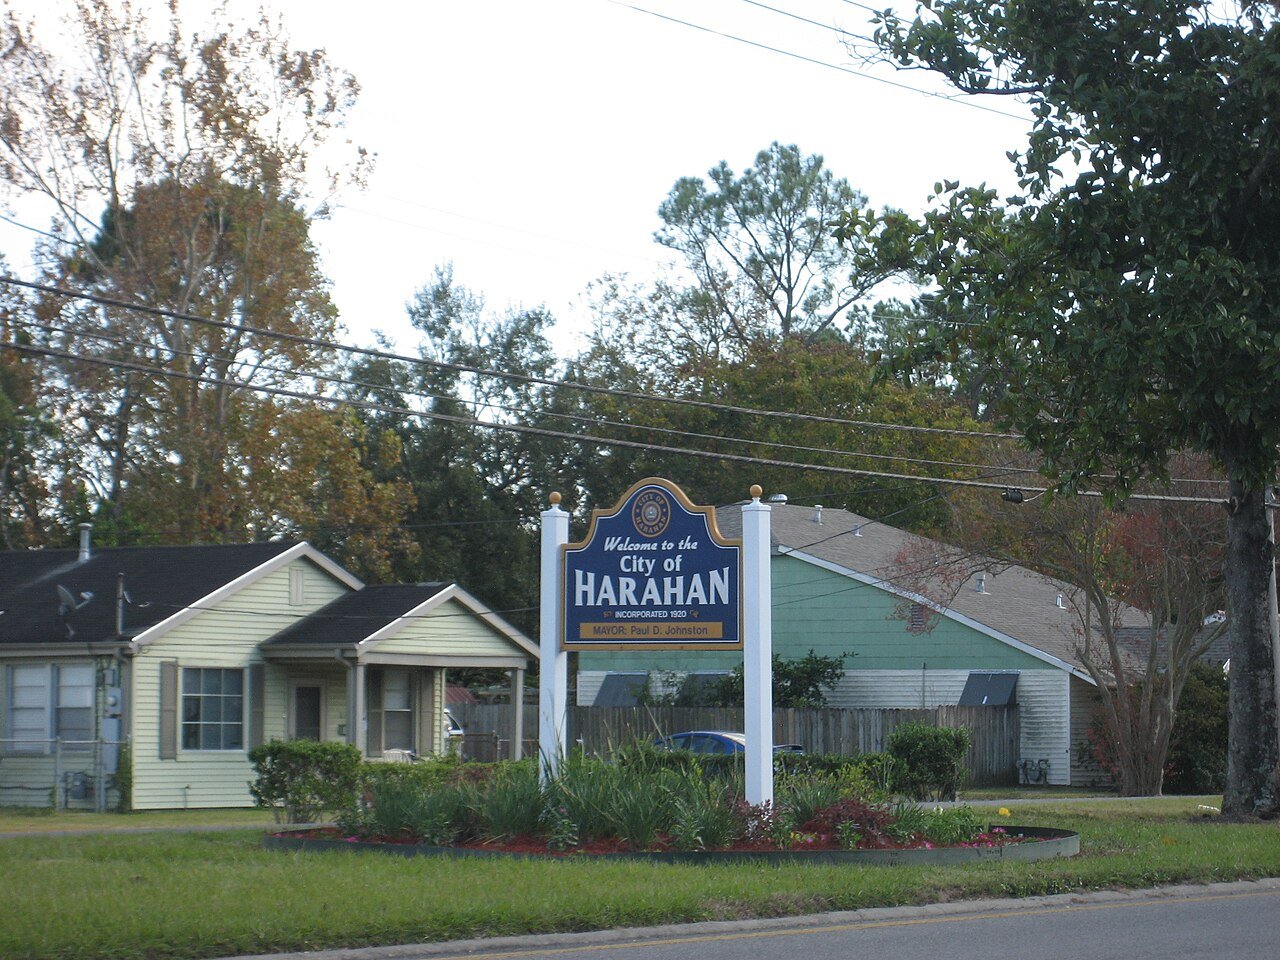
4 Harahan Harahan8,904 people 12.9 1.4 per 1,000 7.5 per 1,000
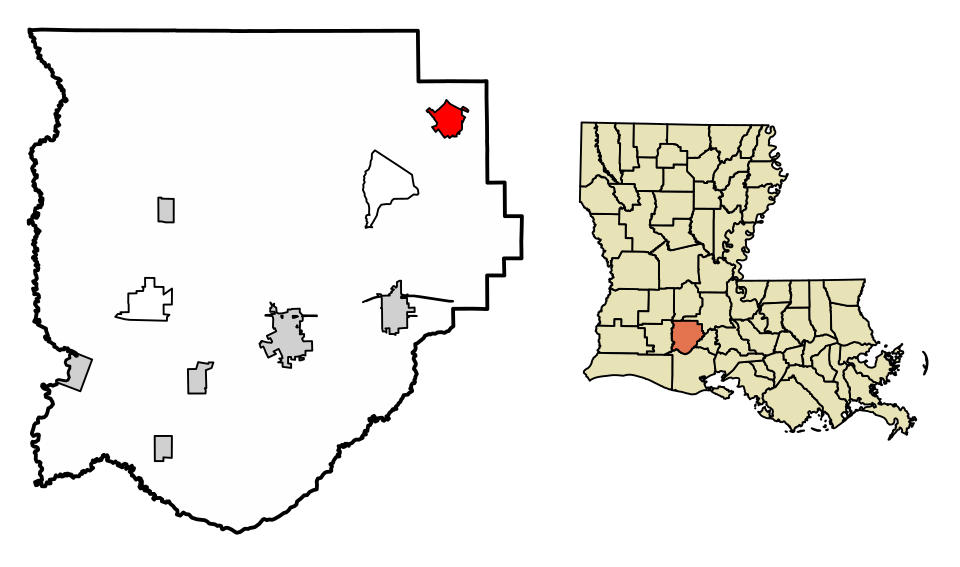
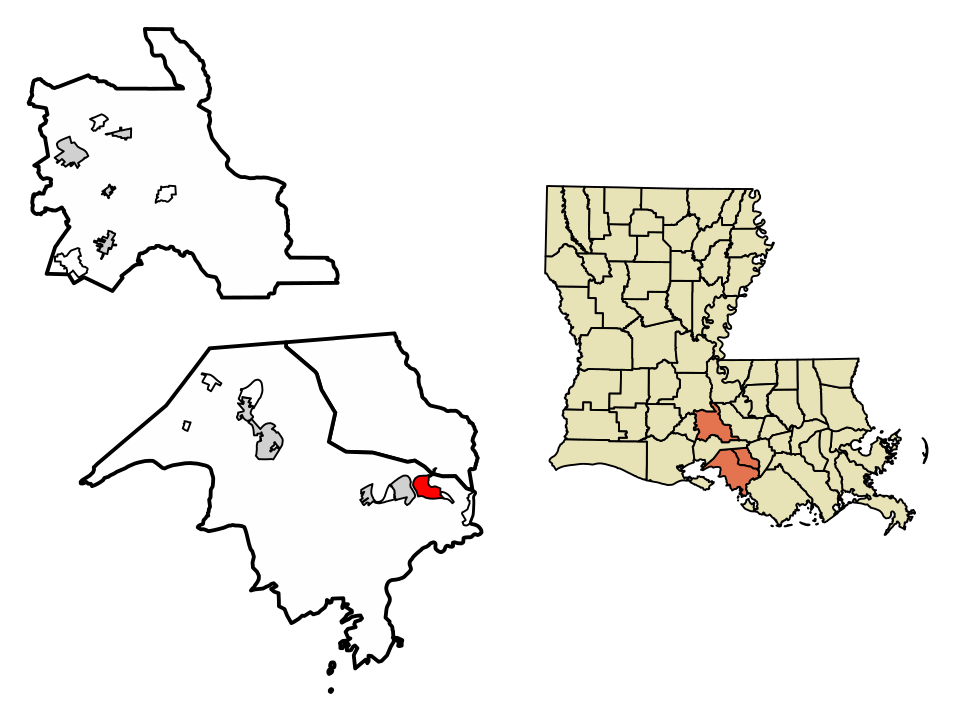
5 Map of Patterson Patterson5,744 people 14.2 2.7 per 1,000 3.5 per 1,000
6 Mandeville Mandeville12,946 people 18.7 1.3 per 1,000 13.3 per 1,000
7 Covington Covington11,658 people 19.8 2.5 per 1,000 9.8 per 1,000
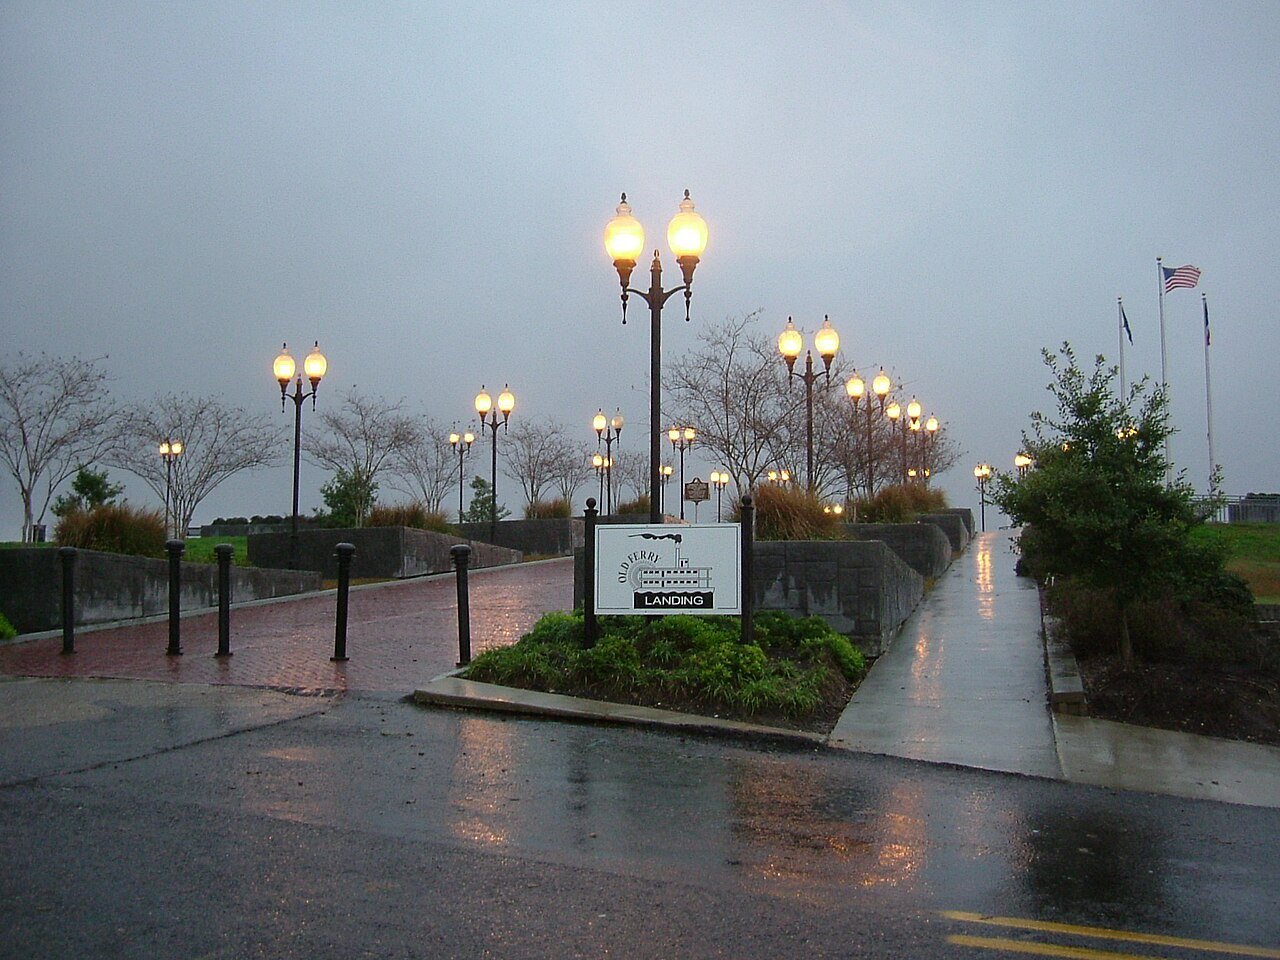
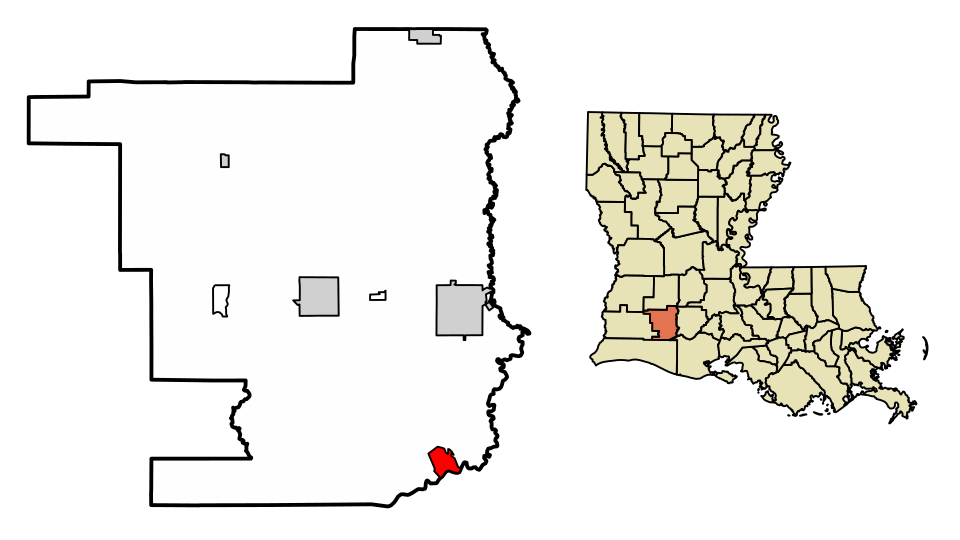
8 Map of Gramercy Gramercy2,814 people 22.0 2.0 per 1,000 14.1 per 1,000
9 Haynesville2,515 people 23.2 3.2 per 1,000 10.5 per 1,000
10 Map of DeRidder DeRidder9,763 people 26.5 3.1 per 1,000 13.9 per 1,000
11 Tallulah Tallulah5,969 people 27.0 5.9 per 1,000 3.5 per 1,000
12 Map of Broussard Broussard14,322 people 27.3 1.9 per 1,000 19.7 per 1,000
13 Map of Church Point Church Point4,096 people 28.3 5.3 per 1,000 7.3 per 1,000
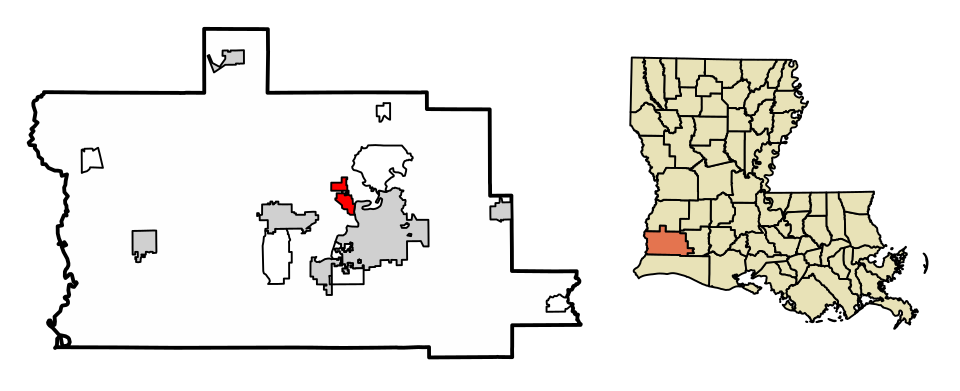
14 Map of Westlake Westlake4,743 people 29.6 2.6 per 1,000 19.2 per 1,000
15 Baker12,253 people 31.3 4.0 per 1,000 15.4 per 1,000
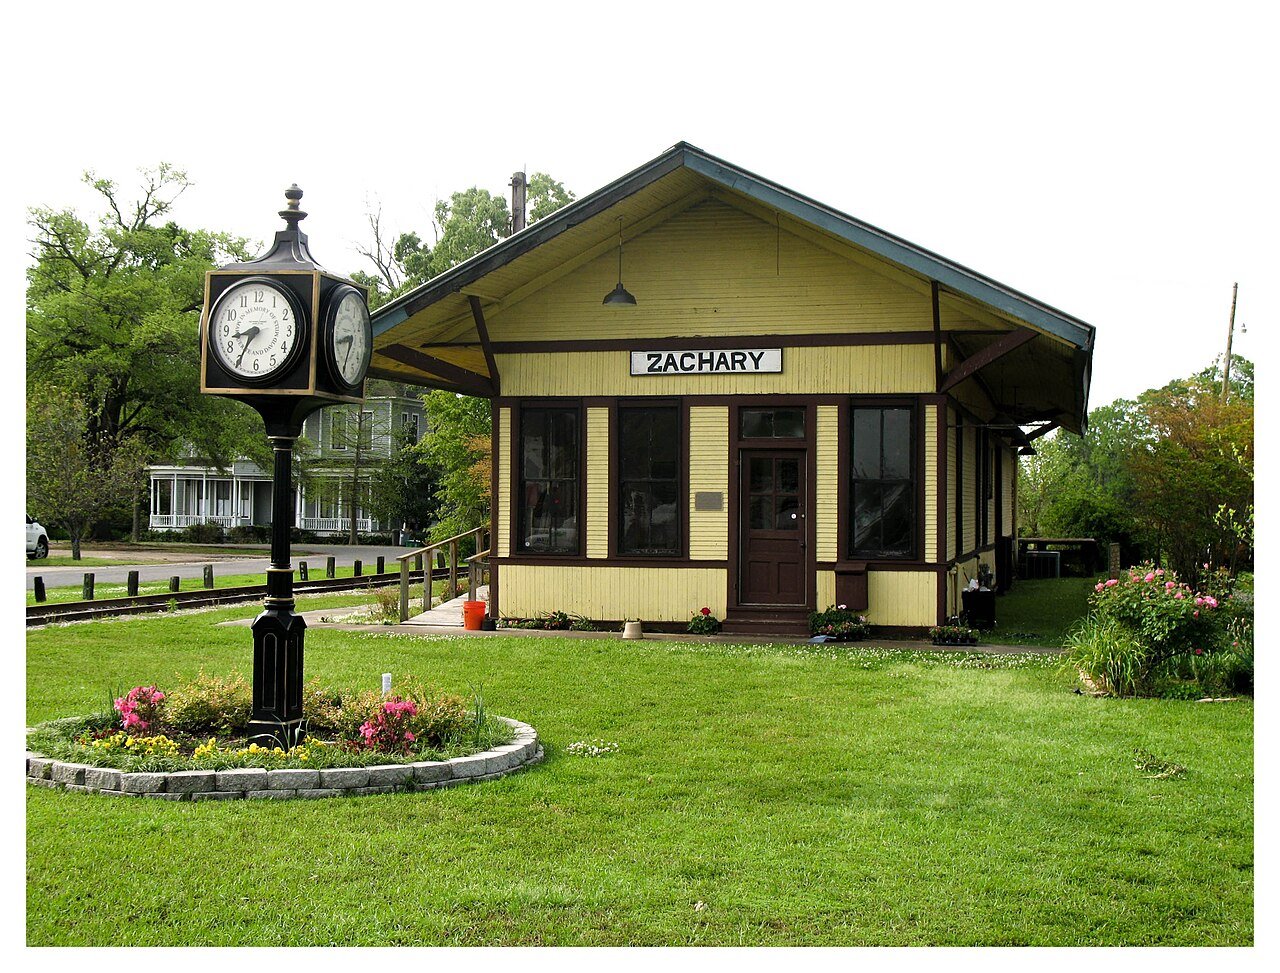
16 Zachary Zachary19,952 people 33.9 3.3 per 1,000 20.7 per 1,000
17 Slidell Slidell28,561 people 35.2 2.8 per 1,000 24.0 per 1,000

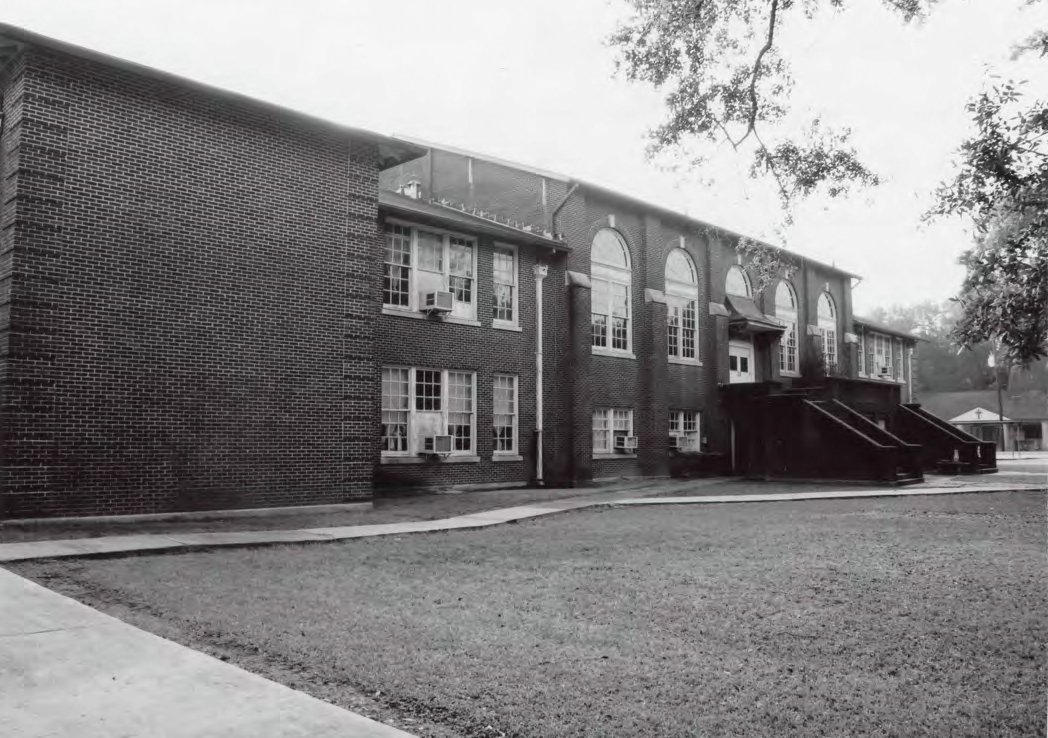
18 Westwego Westwego8,335 people 36.1 4.6 per 1,000 17.7 per 1,000

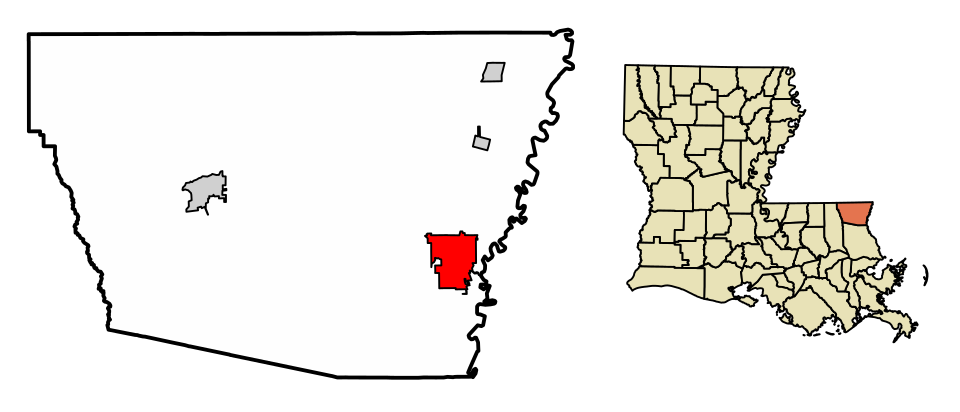
19 Map of Thibodaux Thibodaux15,732 people 37.9 3.0 per 1,000 26.1 per 1,000
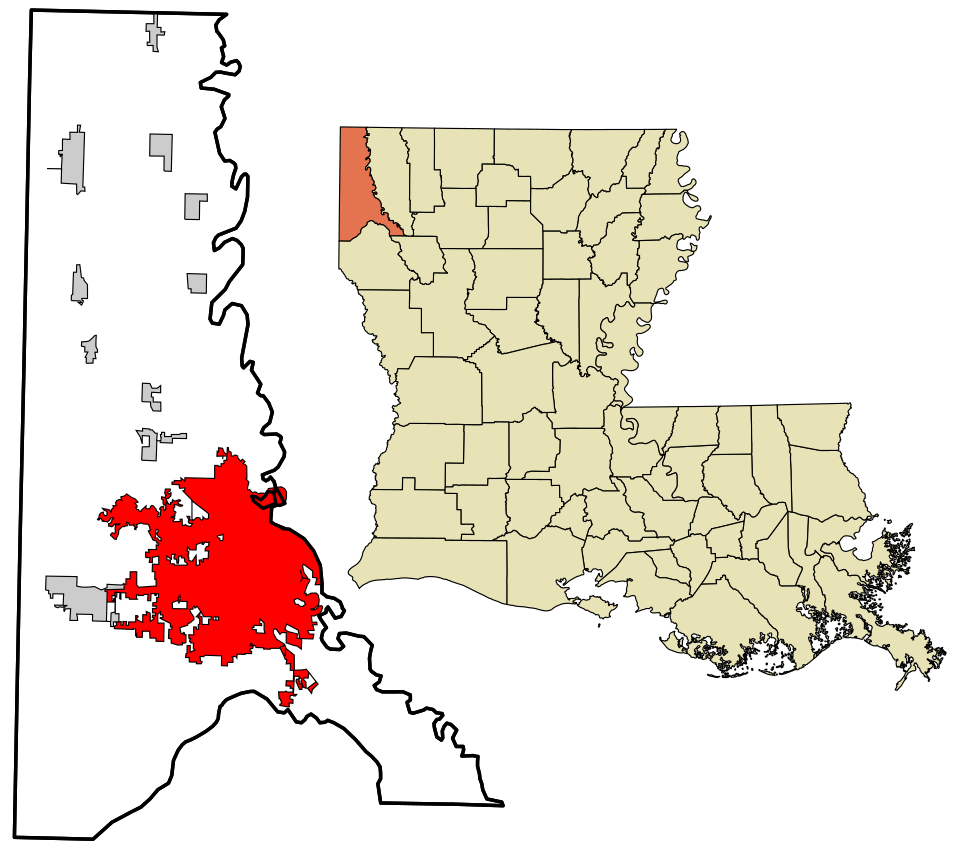
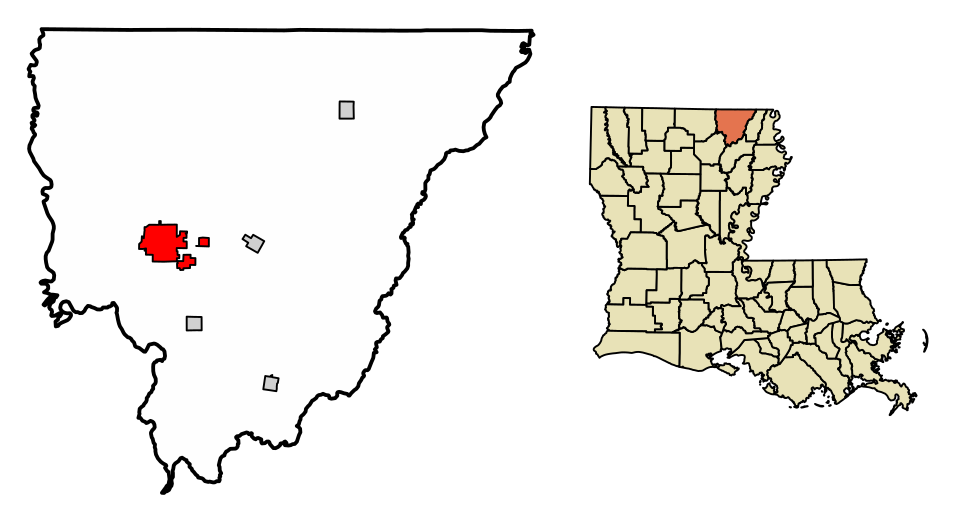
20 Kenner Kenner64,904 people 39.6 3.2 per 1,000 26.9 per 1,000
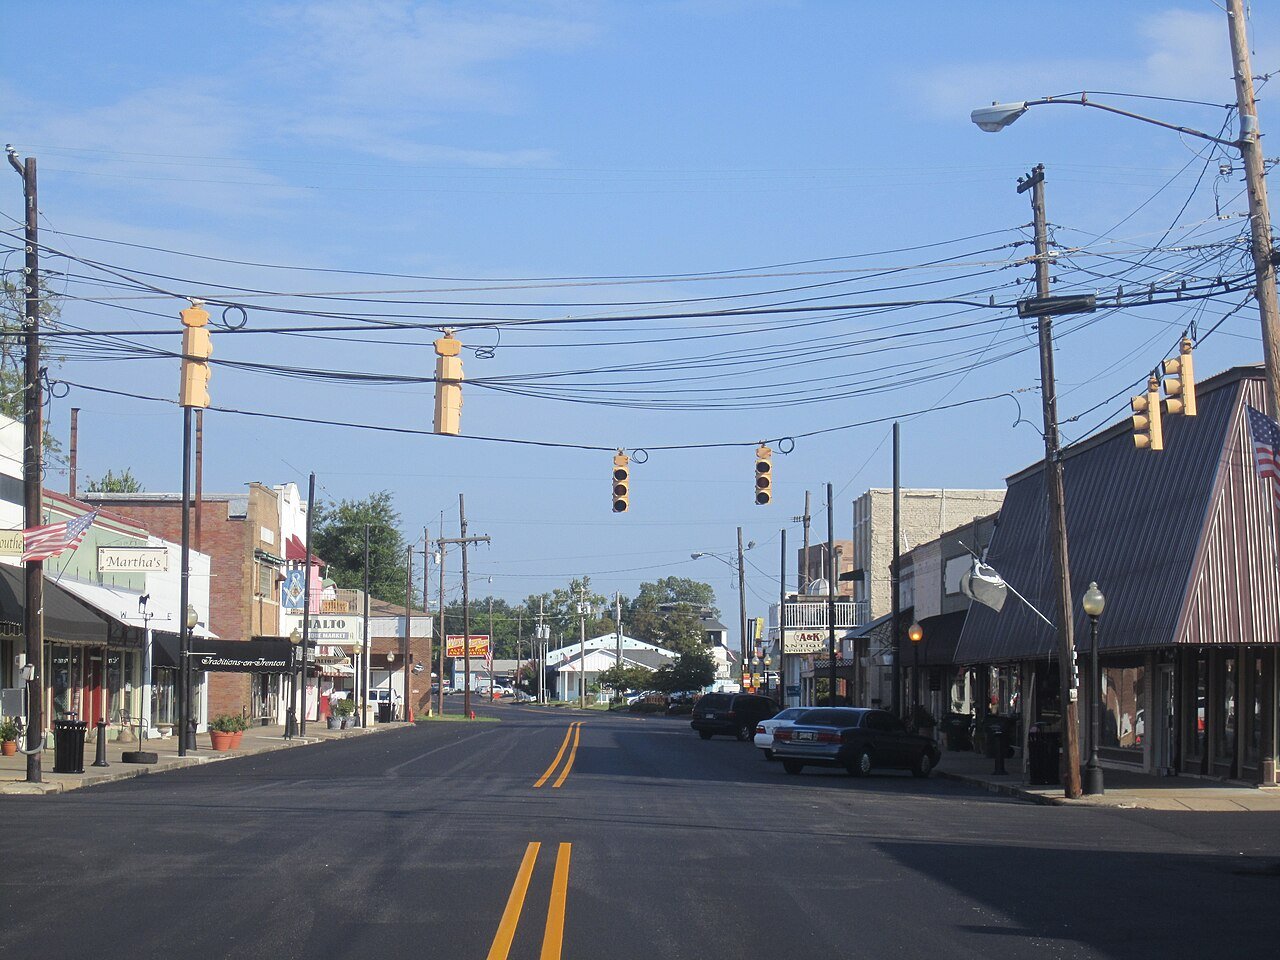
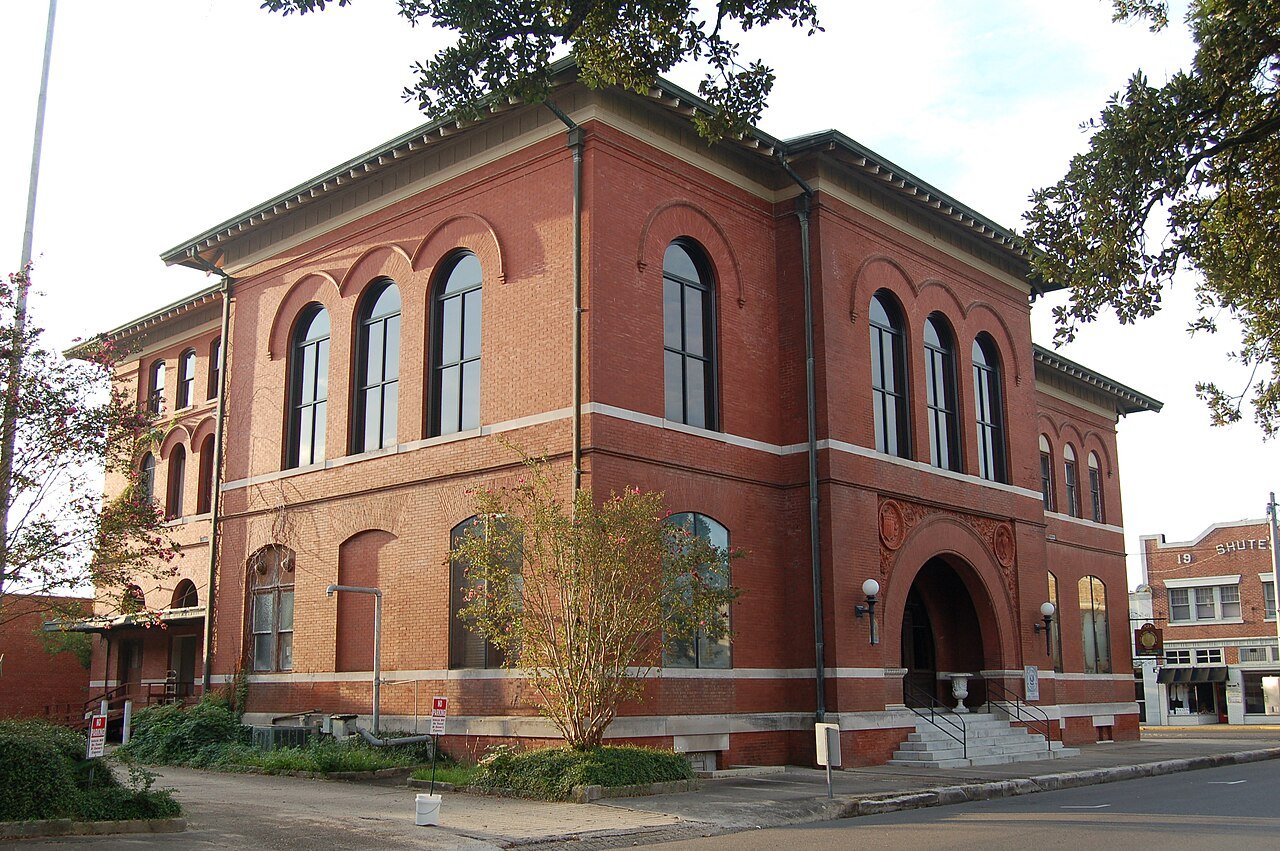
21 Ponchatoula Ponchatoula7,808 people 40.6 4.2 per 1,000 23.9 per 1,000
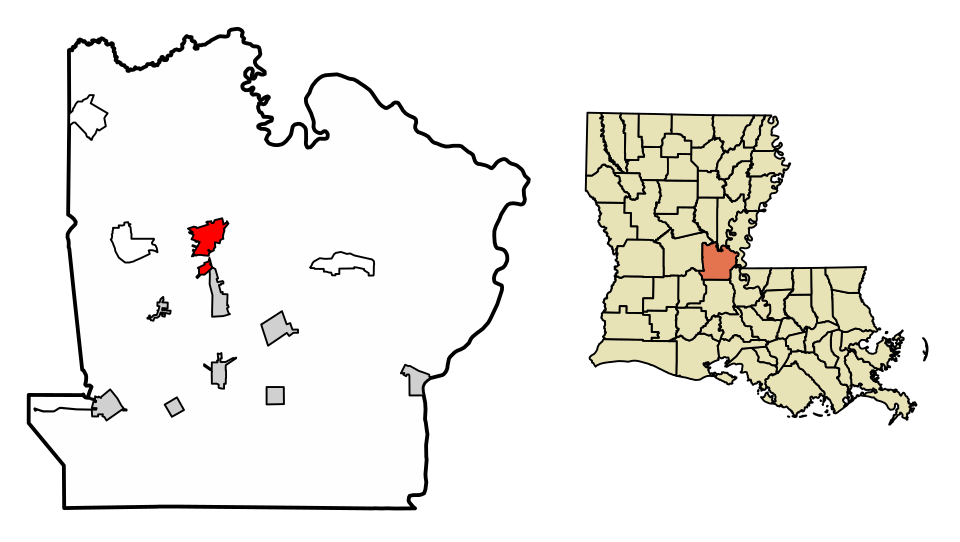

22 Vidalia Vidalia3,928 people 41.7 3.3 per 1,000 28.5 per 1,000
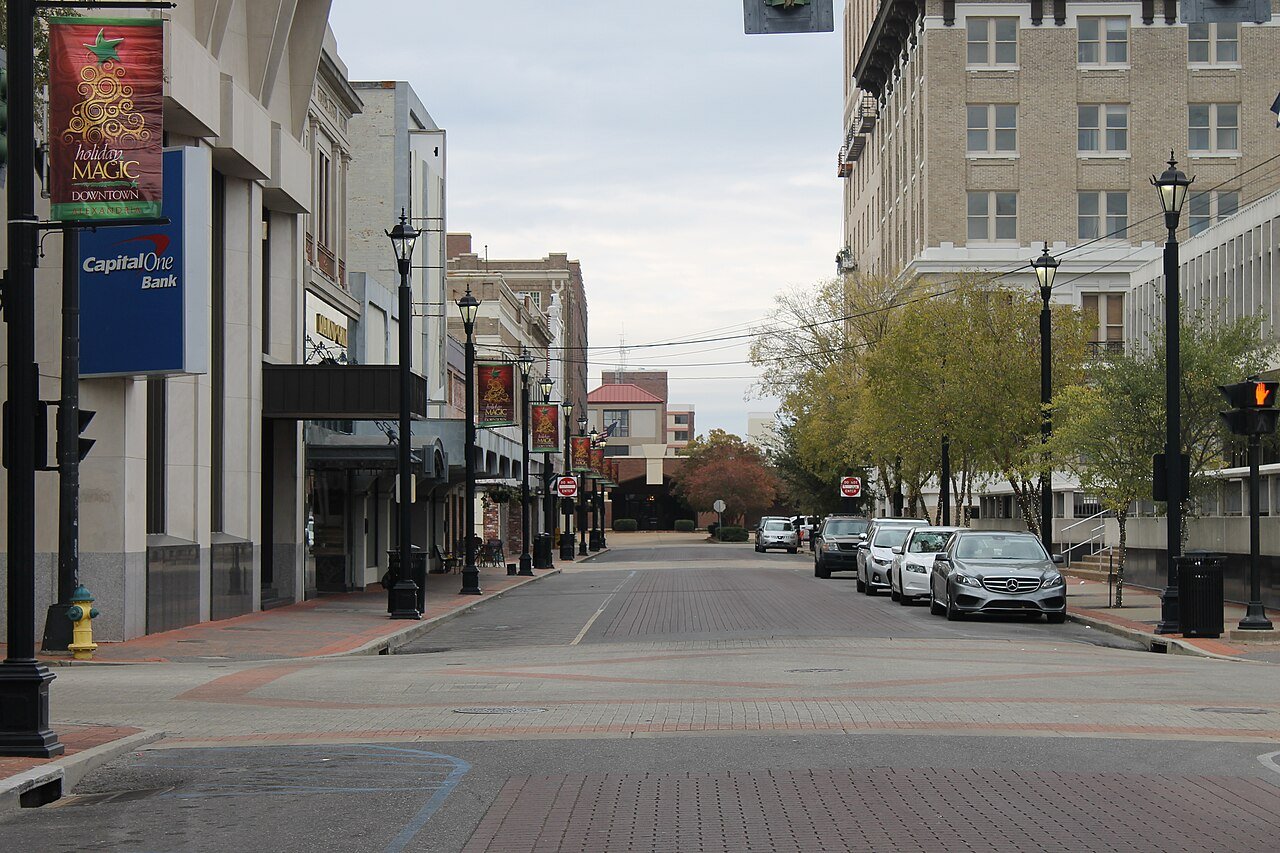
23 Map of Sulphur Sulphur20,775 people 42.5 3.2 per 1,000 29.7 per 1,000
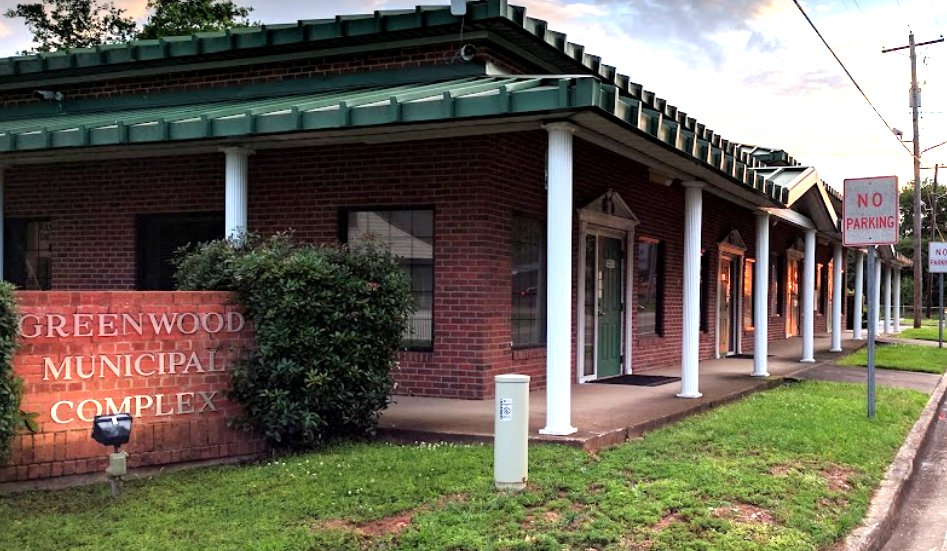
24 Greenwood Greenwood3,110 people 50.4 5.0 per 1,000 30.4 per 1,000
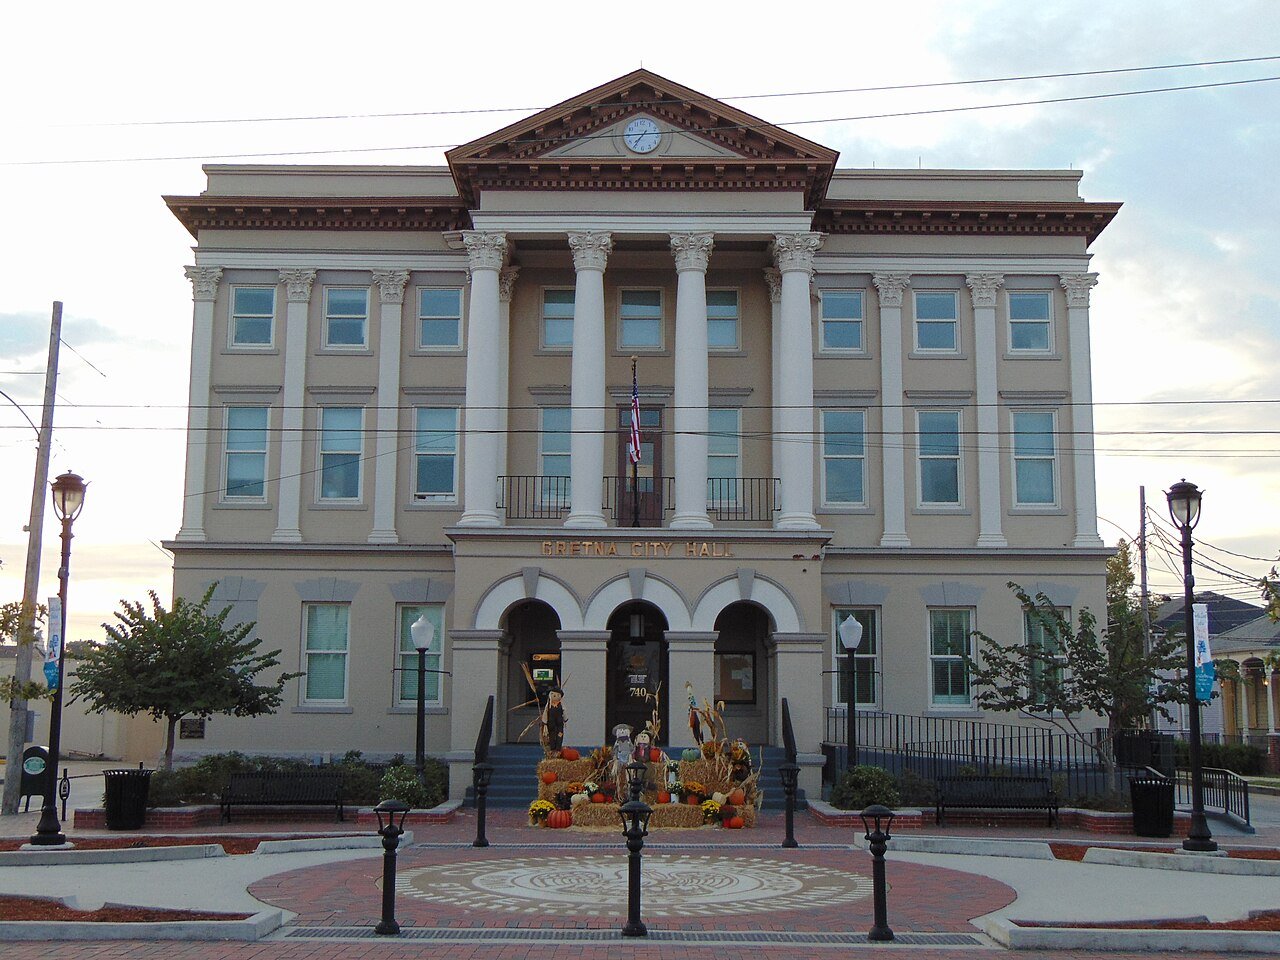
25 Gretna Gretna17,389 people 50.8 4.0 per 1,000 34.7 per 1,000
26 Map of Lake Charles Lake Charles81,143 people 51.5 6.4 per 1,000 26.0 per 1,000
27 Map of Morgan City Morgan City11,064 people 52.4 6.1 per 1,000 28.0 per 1,000
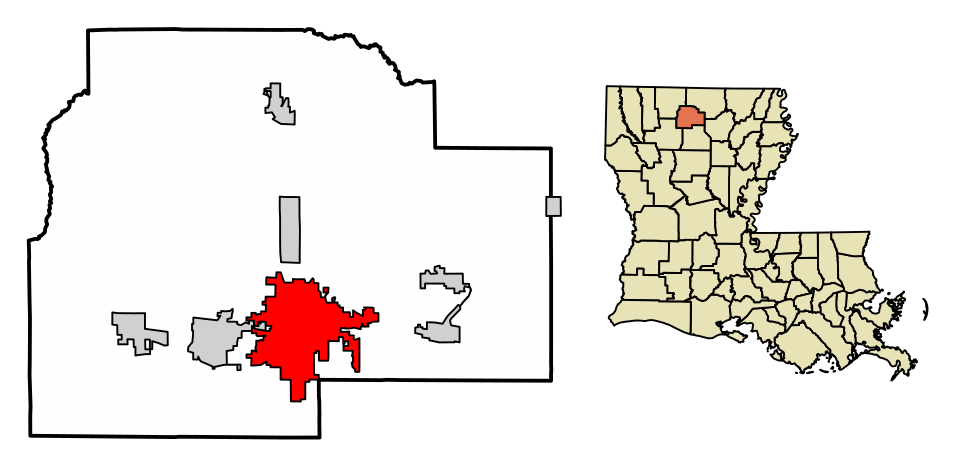
28 Map of Ruston Ruston22,284 people 52.8 4.5 per 1,000 34.8 per 1,000
29 Gonzales Gonzales13,108 people 61.0 5.2 per 1,000 40.4 per 1,000
30 Farmerville3,407 people 65.3 9.0 per 1,000 29.3 per 1,000
31 Vinton Vinton3,176 people 68.1 8.3 per 1,000 34.9 per 1,000
32 Plaquemine Plaquemine6,075 people 70.7 10.2 per 1,000 30.0 per 1,000
33 Map of Bossier City Bossier City62,901 people 72.0 8.4 per 1,000 38.4 per 1,000
34 Port Allen Port Allen4,942 people 74.1 12.6 per 1,000 23.8 per 1,000
35 Jennings Jennings9,553 people 76.7 9.9 per 1,000 37.1 per 1,000
36 Iowa Iowa3,200 people 77.3 15.0 per 1,000 17.4 per 1,000
37 Lafayette Lafayette121,715 people 81.5 10.1 per 1,000 41.3 per 1,000
38 Map of Bogalusa Bogalusa10,468 people 81.8 10.9 per 1,000 38.2 per 1,000
39 Map of Shreveport Shreveport180,982 people 81.9 10.4 per 1,000 40.2 per 1,000
40 Map of Bastrop Bastrop9,232 people 96.1 11.9 per 1,000 48.7 per 1,000
41 West Monroe West Monroe12,729 people 104.8 11.9 per 1,000 57.1 per 1,000
42 Opelousas Opelousas15,495 people 110.7 14.8 per 1,000 51.3 per 1,000
43 Map of Marksville Marksville4,905 people 114.5 17.8 per 1,000 43.2 per 1,000
44 Monroe Monroe47,004 people 131.6 18.8 per 1,000 56.5 per 1,000
45 Alexandria Alexandria44,060 people 157.6 23.8 per 1,000 62.6 per 1,000

How this ranking works

For each town we add up the violent and property crimes its police reported to the FBI over 2023–2025 and divide by the population they served, giving a rate per 1,000 residents. Violent crimes (homicide, rape, robbery and aggravated assault) count four times as much as property crimes (burglary, theft, vehicle theft and arson), because they weigh more on how safe a place feels. The lowest weighted rate ranks #1.

These are crimes reported to police, not convictions, and towns with a campus, highway, beach or shopping center also count incidents involving visitors. A town is ranked only if its police department reported a full year in every one of these years; towns patrolled by a county sheriff or state police don't have their own figures. There is no “most dangerous” list, on purpose.

Only towns with at least 2,500 residents are ranked; Census estimates for smaller places are too uncertain. Population and income: U.S. Census Bureau American Community Survey 5-year estimates. Crime: FBI Uniform Crime Reporting Program, offenses known to law enforcement by city. Town photos: Wikimedia Commons, credited on each town’s page.

Same ranking in other states