NVNevada rankings

Wettest towns in Nevada

Ranked by rain and melted snow in a normal year, 1991–2020, from NOAA’s gridded climate normals for each town. Neighboring towns on the same 5 km grid square have the same numbers, so each square is listed once, under its largest town. 42 towns with 2,500+ residents.
NOAA U.S. Climate Normals, 1991–2020

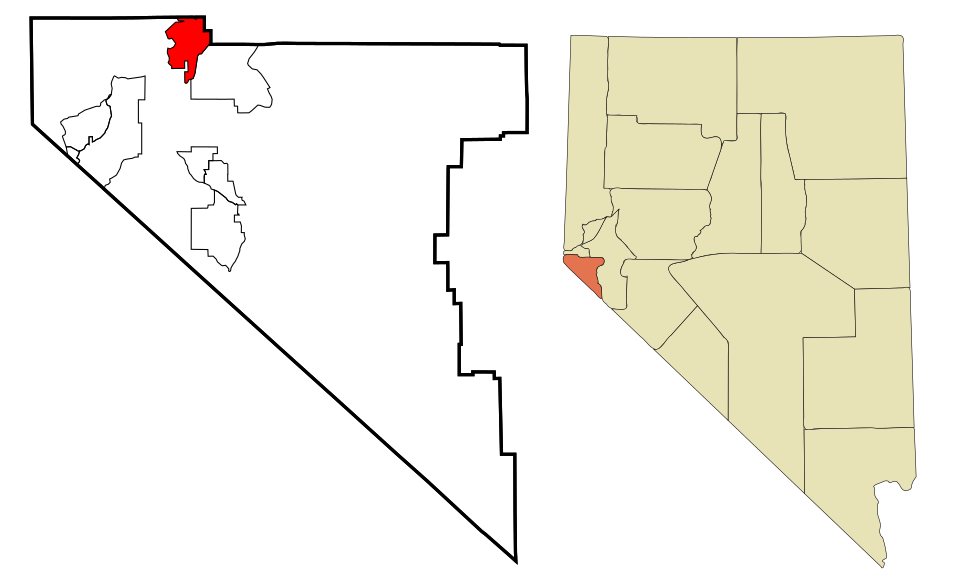
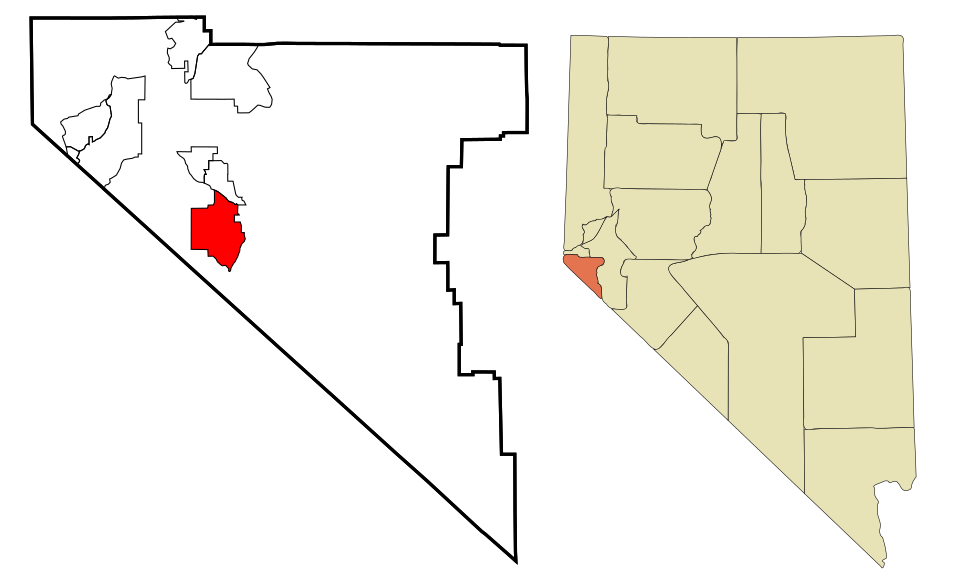
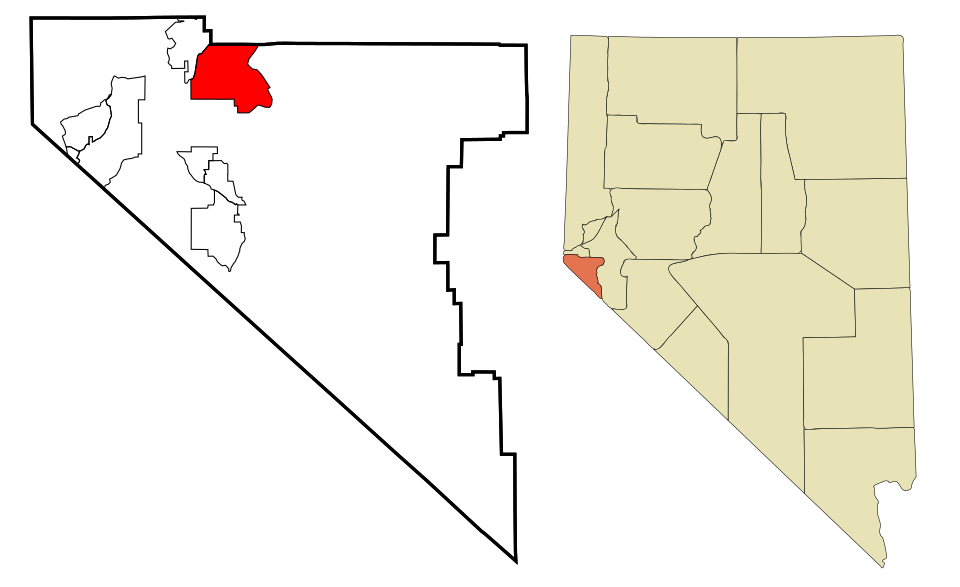
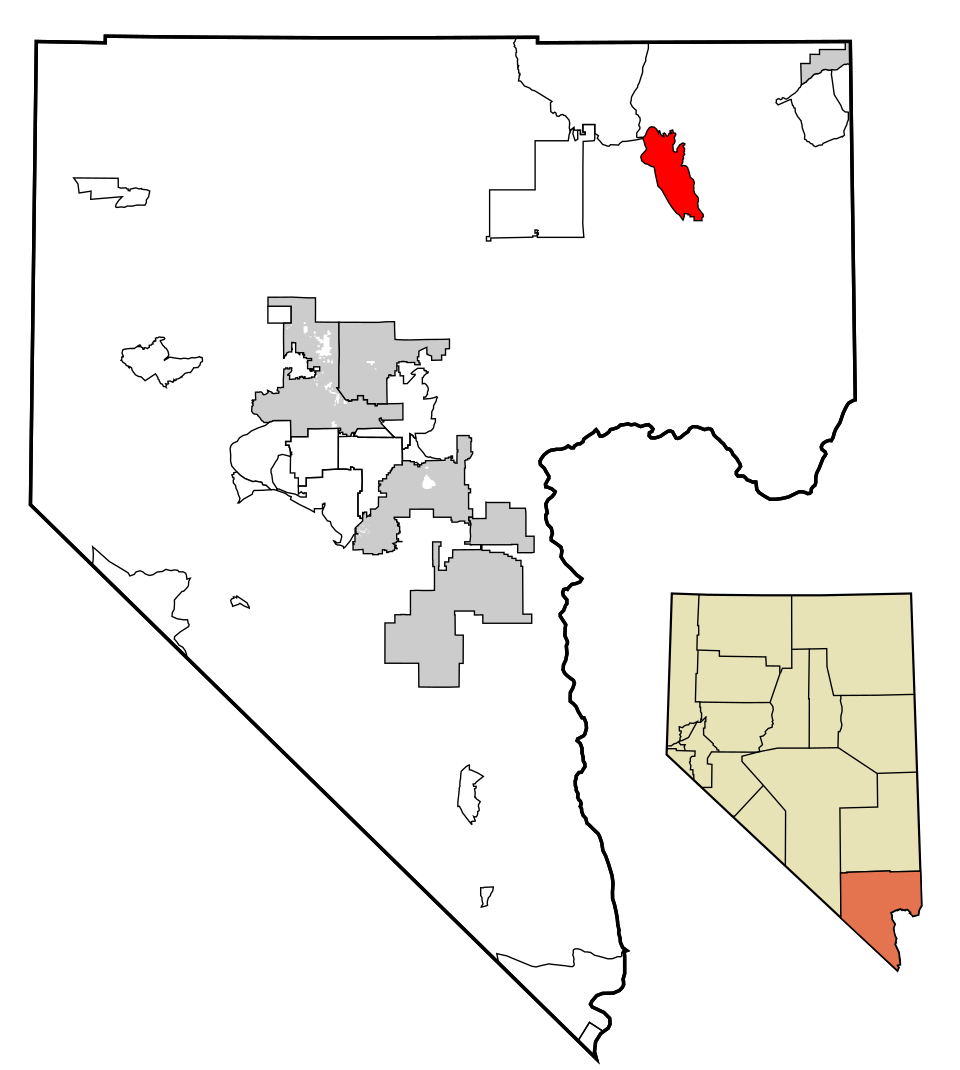
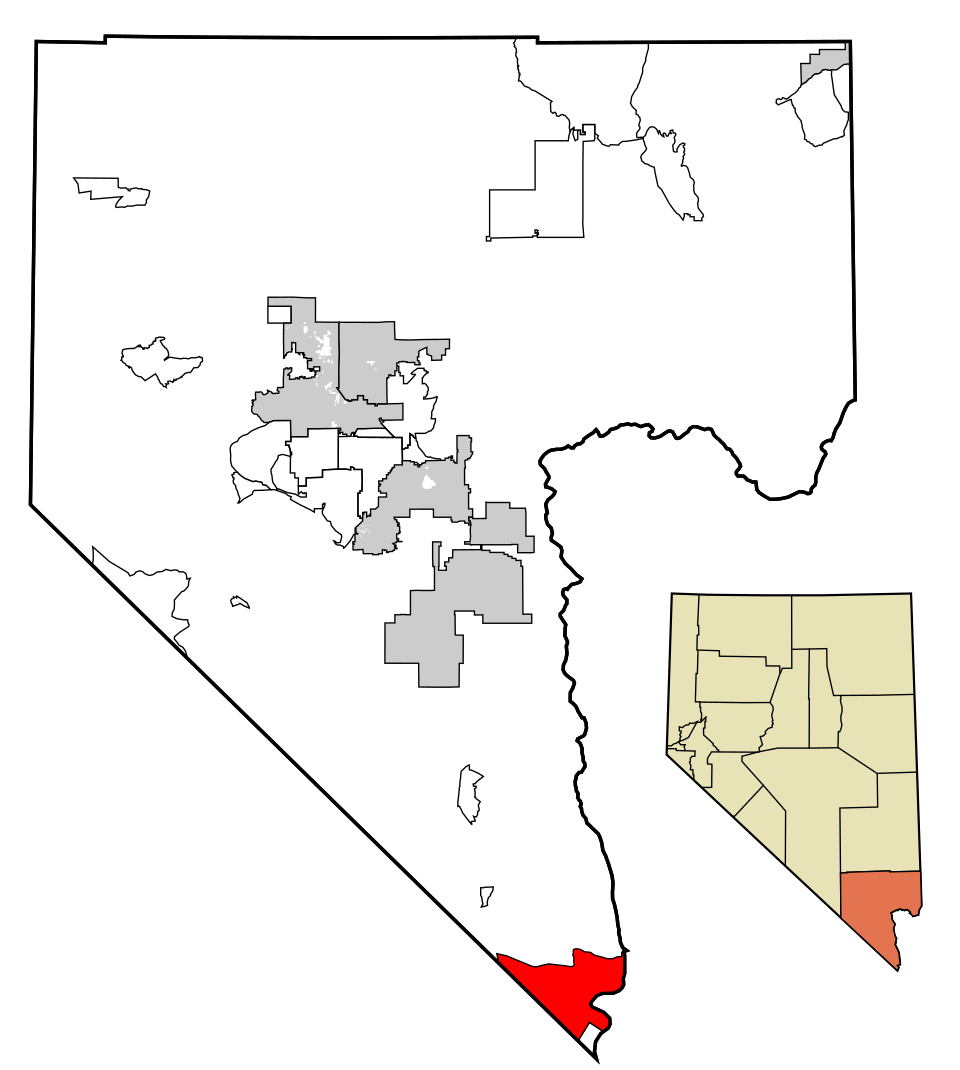
Map of Laughlin
Nevada · Wettest

Where Laughlin lands: #28 of 42

5.0 in · Visit Laughlin →

#TownRain + melted snowWettest monthSnow a year
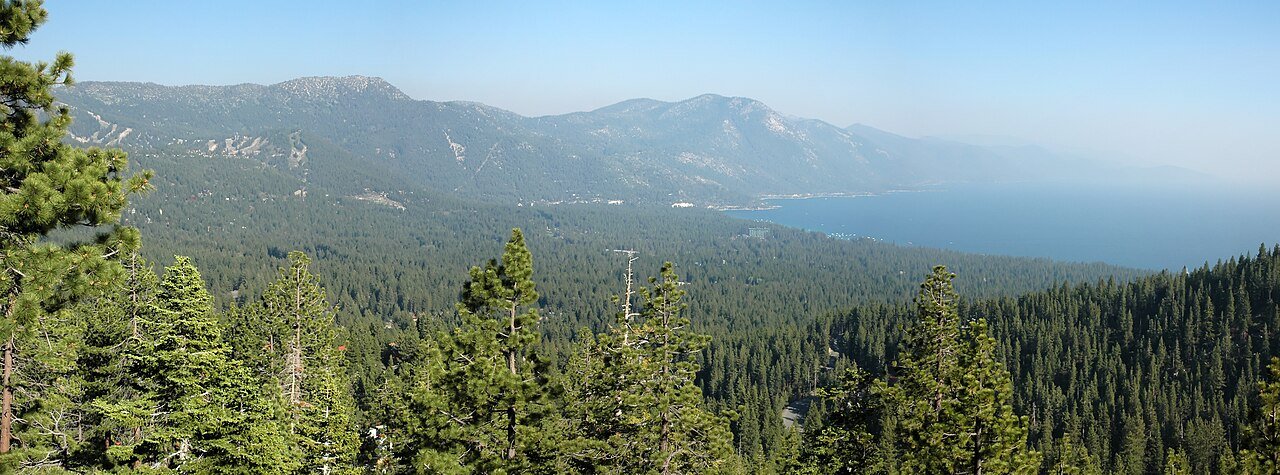
1 Incline Village Incline Village9,272 people 38 in December 179 in
2 Map of Indian Hills Indian Hills5,527 people 14 in January 14 in
3 Spring Creek Spring Creek14,739 people 14 in May 41 in
4 Cold Springs Cold Springs11,321 people 13 in December 17 in
5 Carson Carson58,384 people 11 in January 14 in
6 Lemmon Valley4,412 people 11 in January 17 in
7 Reno Reno273,212 people 11 in December 33 in
8 Washoe Valley Washoe Valley3,315 people 11 in December 14 in
9 Gardnerville Gardnerville5,486 people 11 in January 22 in
10 Map of Gardnerville Ranchos Gardnerville Ranchos12,114 people 11 in January 22 in
11 Ely Ely3,929 people 11 in May 54 in
12 Minden Minden3,707 people 10 in January 22 in
13 Map of Johnson Lane Johnson Lane6,467 people 10 in January 14 in
14 Elko Elko20,696 people 9.9 in May 41 in
15 Spanish Springs Spanish Springs17,980 people 9.9 in January 7 in
16 Sun Valley Sun Valley22,228 people 9.2 in January 33 in
17 Battle Mountain Battle Mountain3,518 people 8.4 in May 21 in
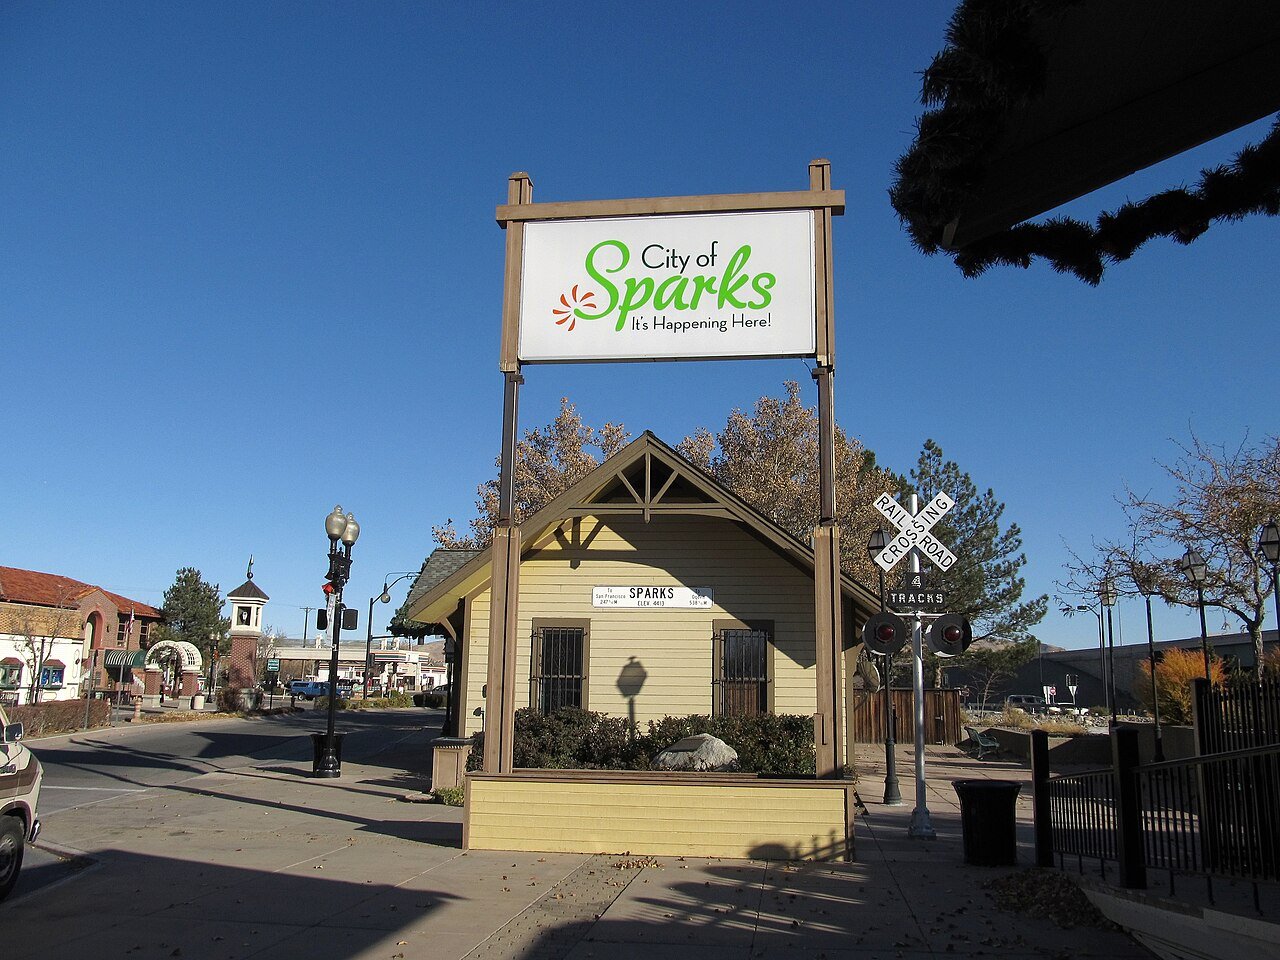
18 Sparks Sparks110,024 people 8.2 in January 7 in
19 Winnemucca Winnemucca8,361 people 7.9 in May 22 in
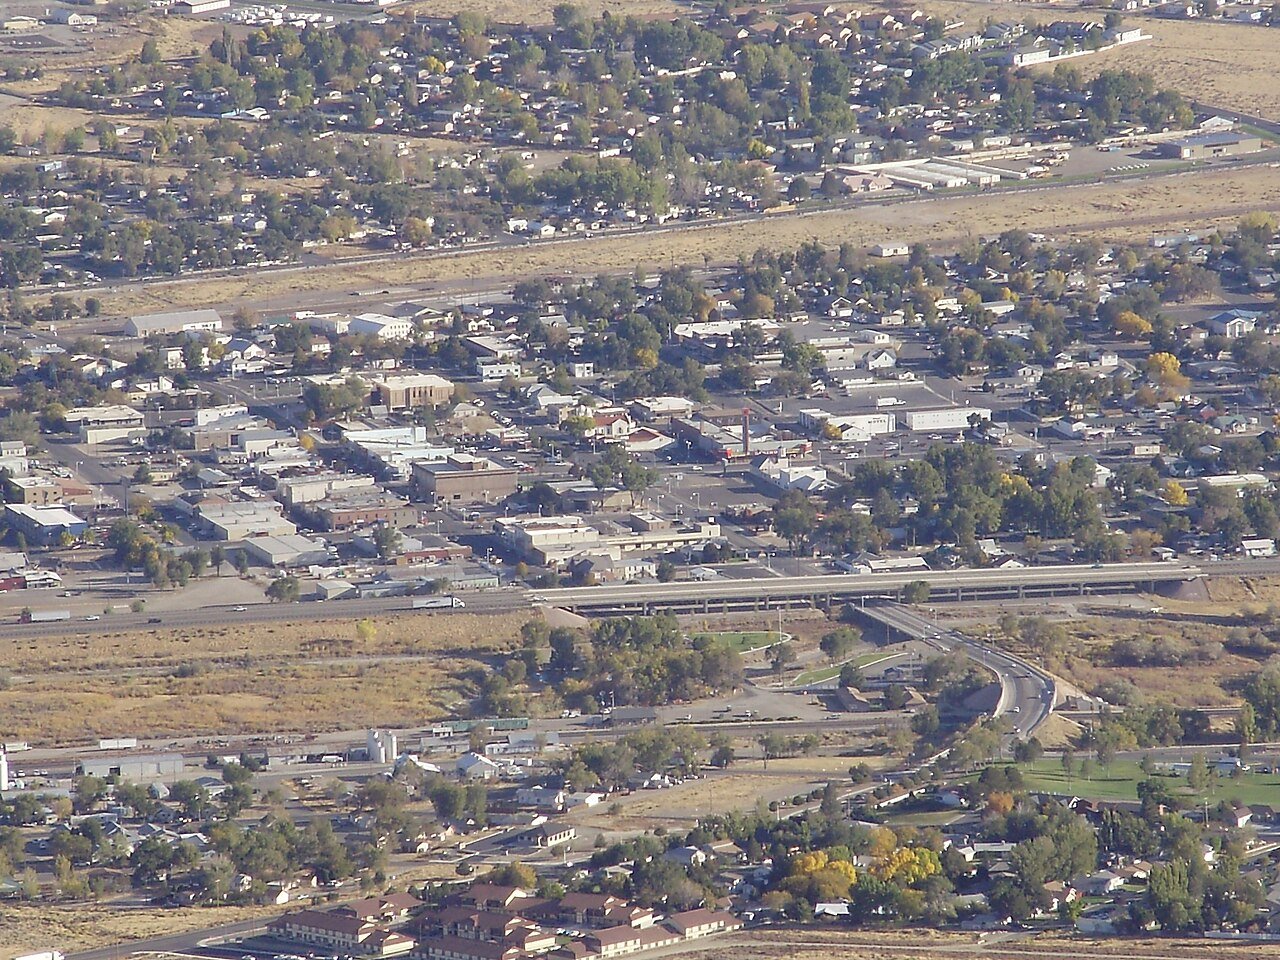
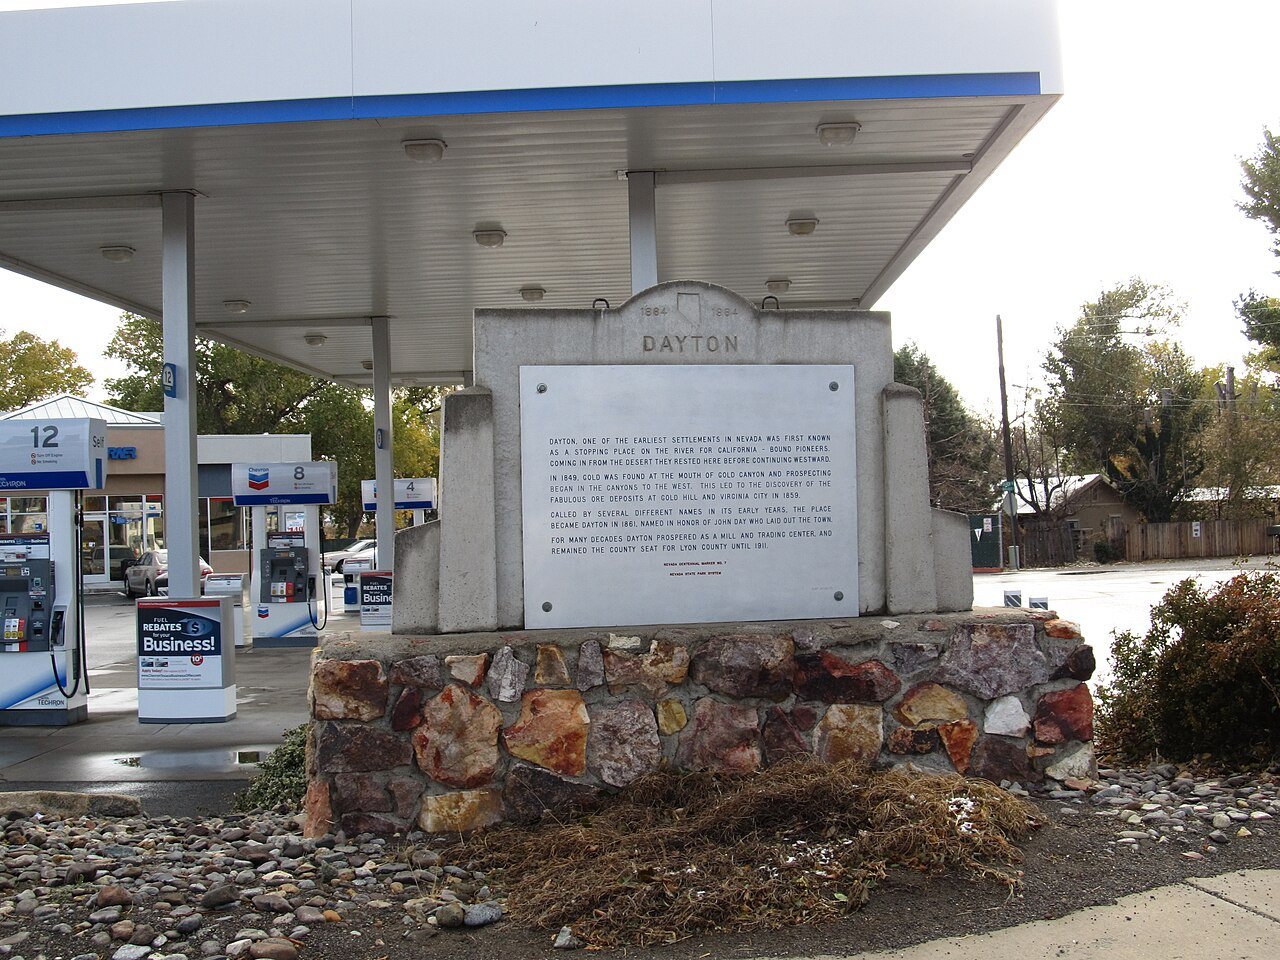
20 Dayton Dayton15,781 people 7.0 in January 21 in
21 Pahrump Pahrump47,347 people 6.8 in February —
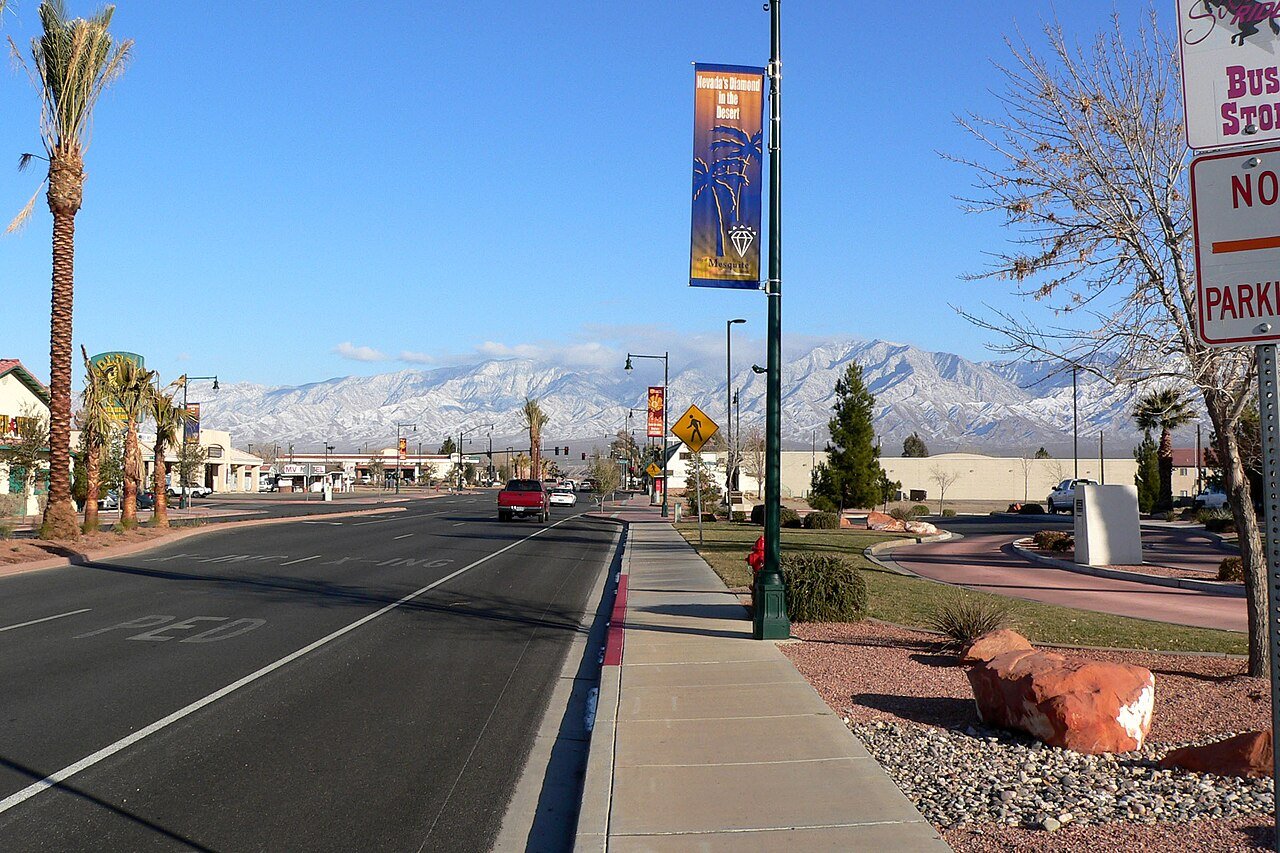
22 Mesquite Mesquite22,059 people 6.6 in February —
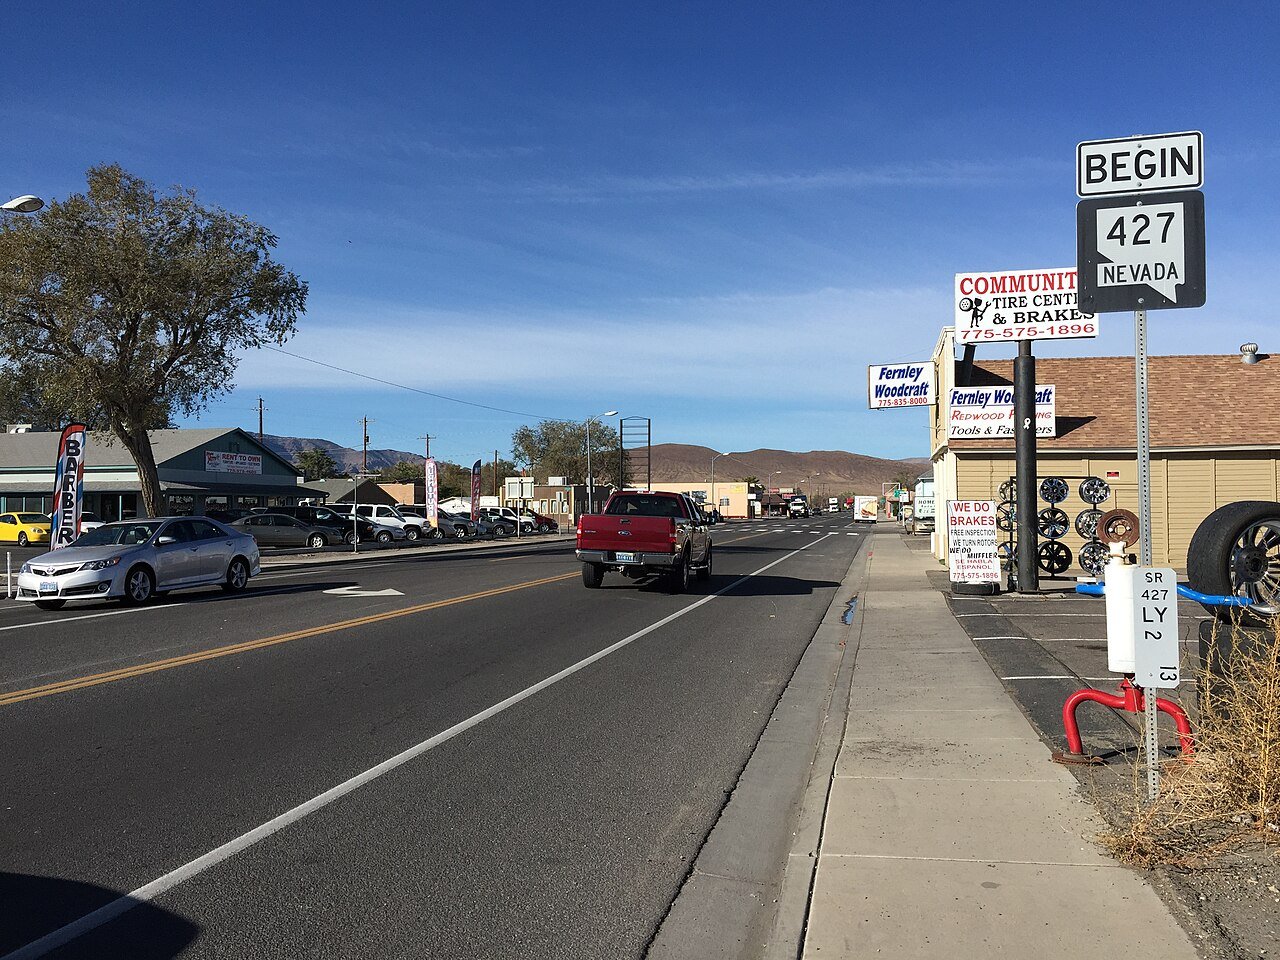
23 Fernley Fernley24,225 people 5.9 in January 5 in
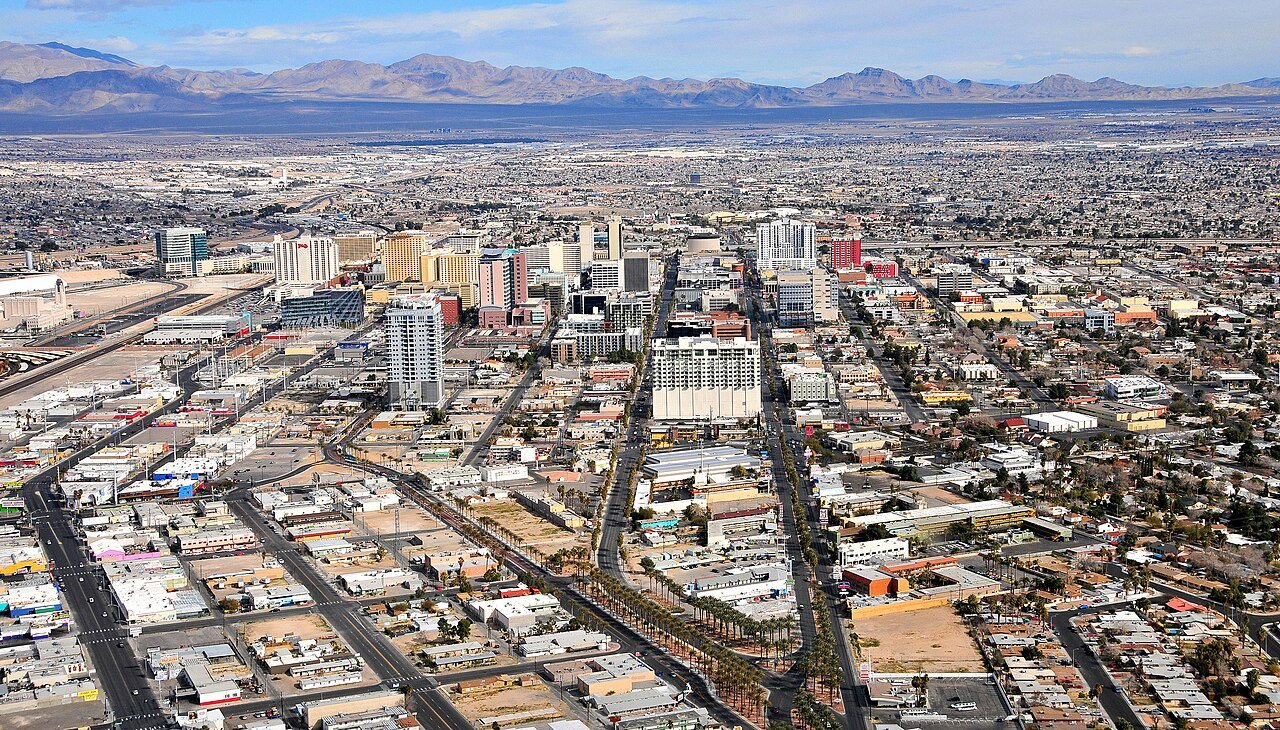
24 Las Vegas Las Vegas660,400 people 5.7 in February 0 in
25 Map of Moapa Valley Moapa Valley6,684 people 5.7 in February 0 in
26 Yerington Yerington3,150 people 5.7 in January 3 in
27 North Las Vegas North Las Vegas278,595 people 5.3 in February 0 in
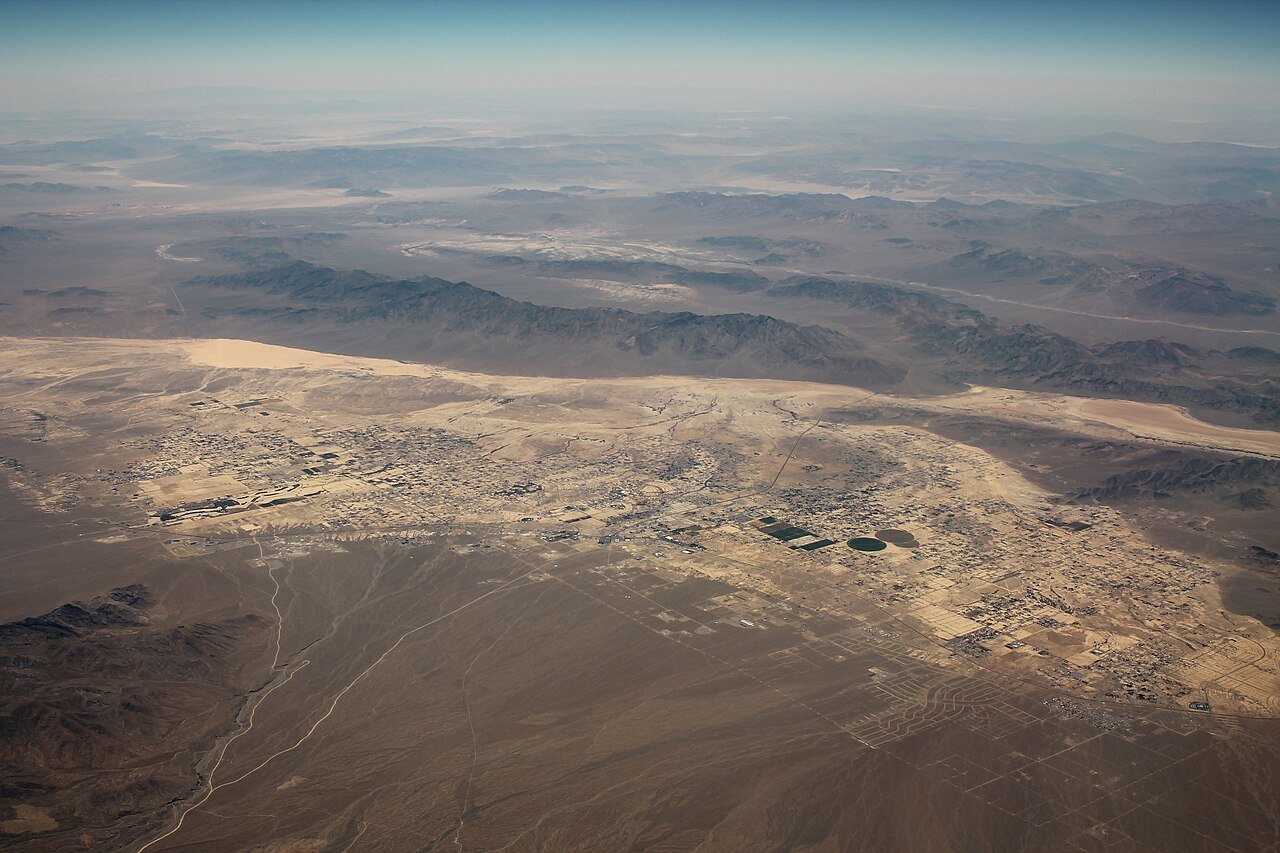
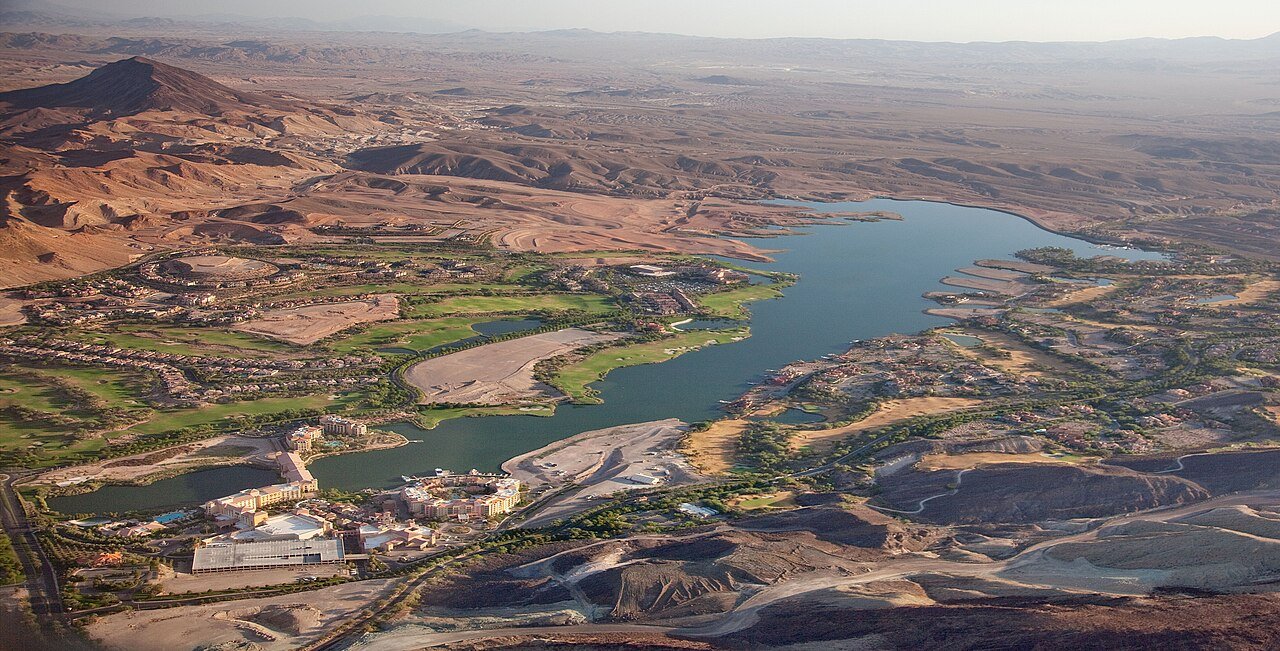
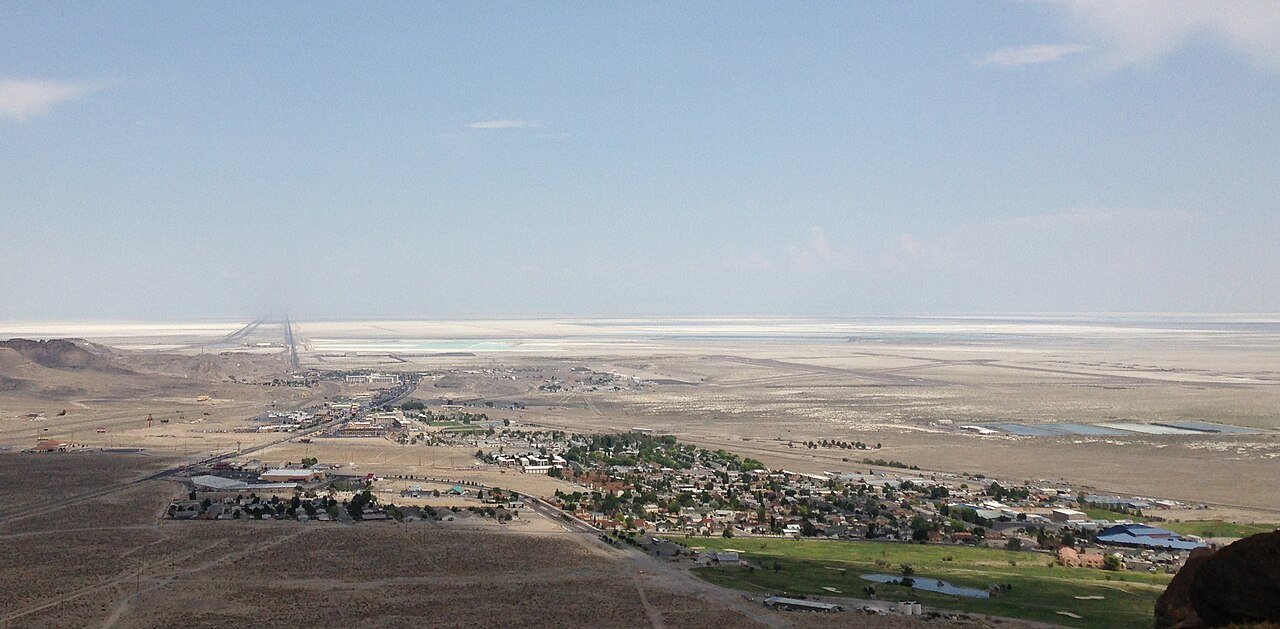
28 Map of Laughlin Laughlin8,789 people 5.0 in February 0 in
29 Enterprise Enterprise240,464 people 4.9 in February 0.2 in
30 Map of Summerlin South Summerlin South31,354 people 4.9 in February 0.2 in
31 Spring Valley Spring Valley219,187 people 4.6 in February 0.2 in
32 Henderson Henderson332,141 people 4.5 in February 0.2 in
33 Silver Springs Silver Springs5,060 people 4.5 in January 5 in
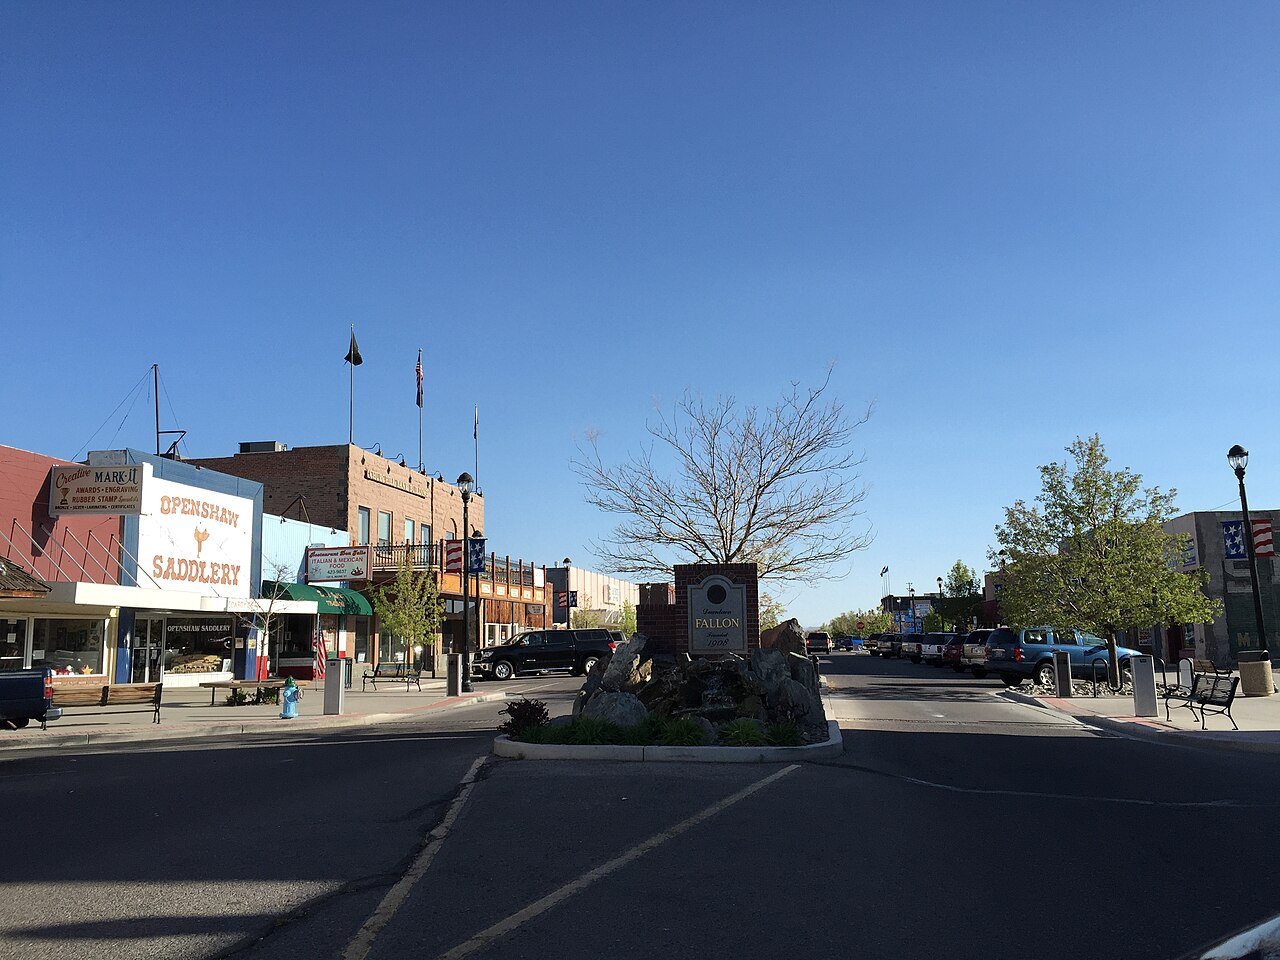
34 Fallon Fallon9,463 people 4.4 in May 5 in
35 Sunrise Manor Sunrise Manor200,218 people 4.3 in February 0 in
36 Paradise Paradise185,913 people 4.3 in February 0.2 in
37 Whitney Whitney47,221 people 4.3 in February 0.2 in
38 Winchester Winchester37,081 people 4.3 in February 0.2 in
39 Boulder City Boulder City14,919 people 4.3 in February 0 in
40 Nellis AFB5,087 people 4.3 in February 0 in
41 West Wendover West Wendover4,514 people 4.1 in May —
42 Hawthorne Hawthorne2,809 people 4.1 in May 1 in

How this ranking works

We rank every town by rain and melted snow in a normal year, 1991–2020, from NOAA’s gridded climate normals for each town. The town with the highest figure ranks #1. Normals are 30-year averages, not a forecast, and each town’s Climate page shows its whole year month by month.

Temperatures and rainfall come from NOAA’s gridded normals, about 5 km (3 miles) square, read at each town’s center, so hills and coastlines are built in. Towns whose centers fall in the same square have the same numbers, so only the largest of them is listed.

Only towns with at least 2,500 residents are ranked; Census estimates for smaller places are too uncertain. Population and income: U.S. Census Bureau American Community Survey 5-year estimates. Climate: NOAA NCEI U.S. Climate Normals, 1991–2020. Town photos: Wikimedia Commons, credited on each town’s page.

Same ranking in other states