NVNevada rankings

Towns with the highest high school graduation rates in Nevada

Ranked by the four-year high school graduation rate of each town's public school district, class of 2020. Towns that share a regional district share its rate and its rank (T = tied). The Nevada rate is 83.4%. 41 towns with 2,500+ residents.
U.S. Census ACS 2020–2024 5-yearClass of 2020

#TownGraduation rateClass sizePopulation
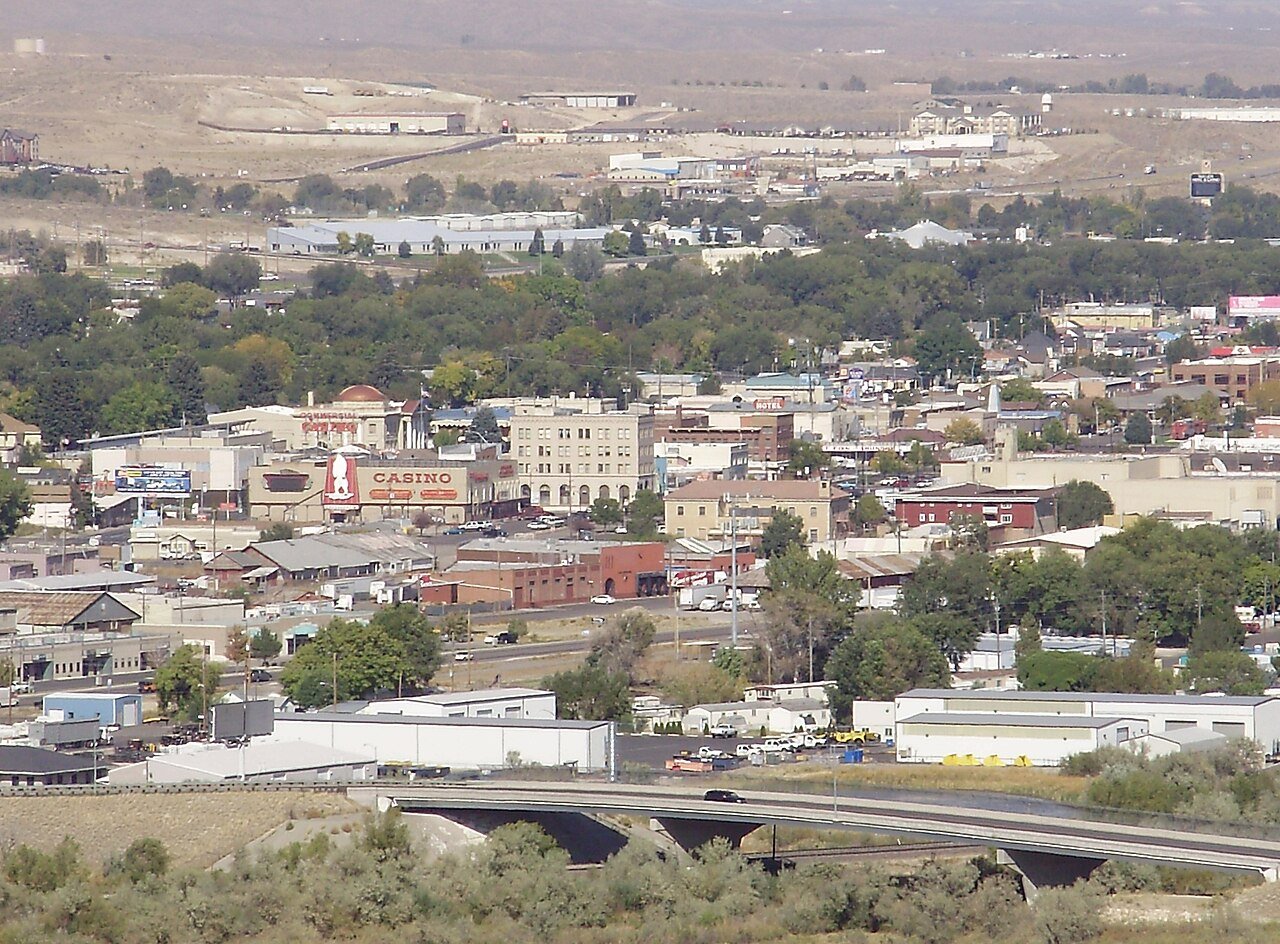
1 Winnemucca WinnemuccaHumboldt County School District 91% 265 8,361
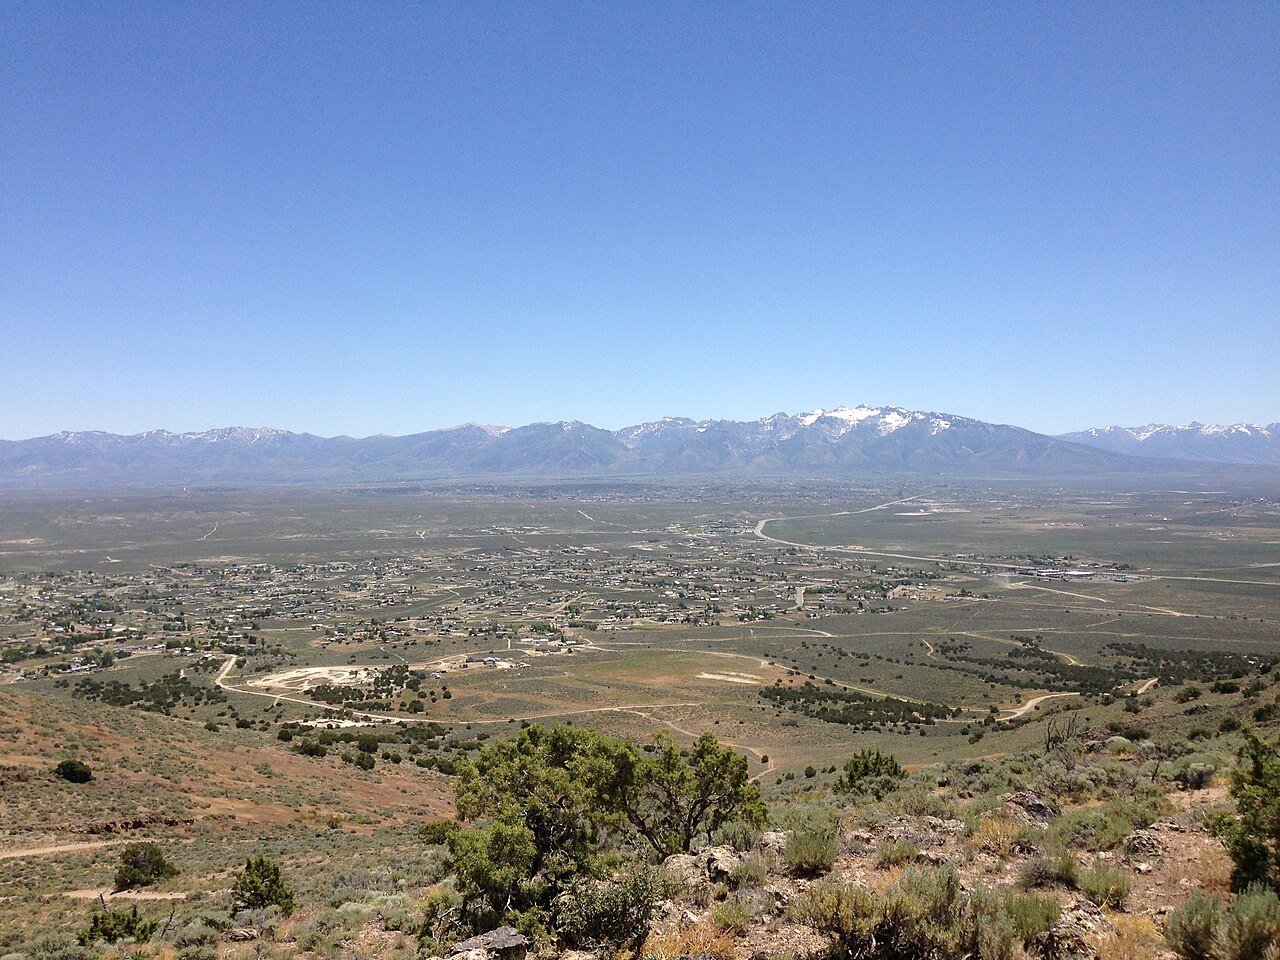
T2 Map of Gardnerville Ranchos Gardnerville RanchosDouglas County School District 89% 469 12,114
T2 Map of Johnson Lane Johnson LaneDouglas County School District 89% 469 6,467
T2 Map of Indian Hills Indian HillsDouglas County School District 89% 469 5,527
T2 Gardnerville GardnervilleDouglas County School District 89% 469 5,486
T2 Minden MindenDouglas County School District 89% 469 3,707
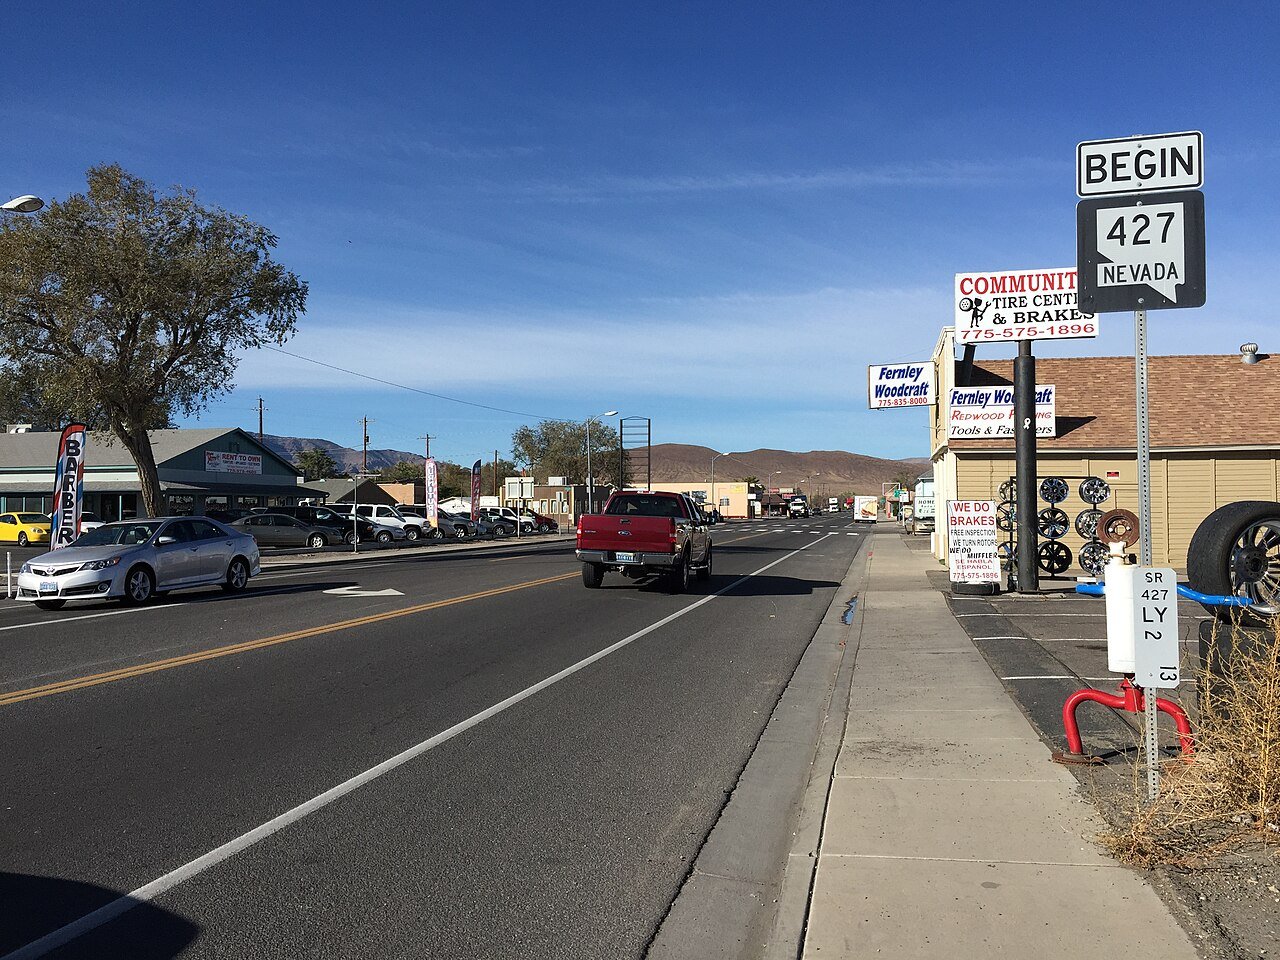
T7 Fernley FernleyLyon County School District 87% 641 24,225
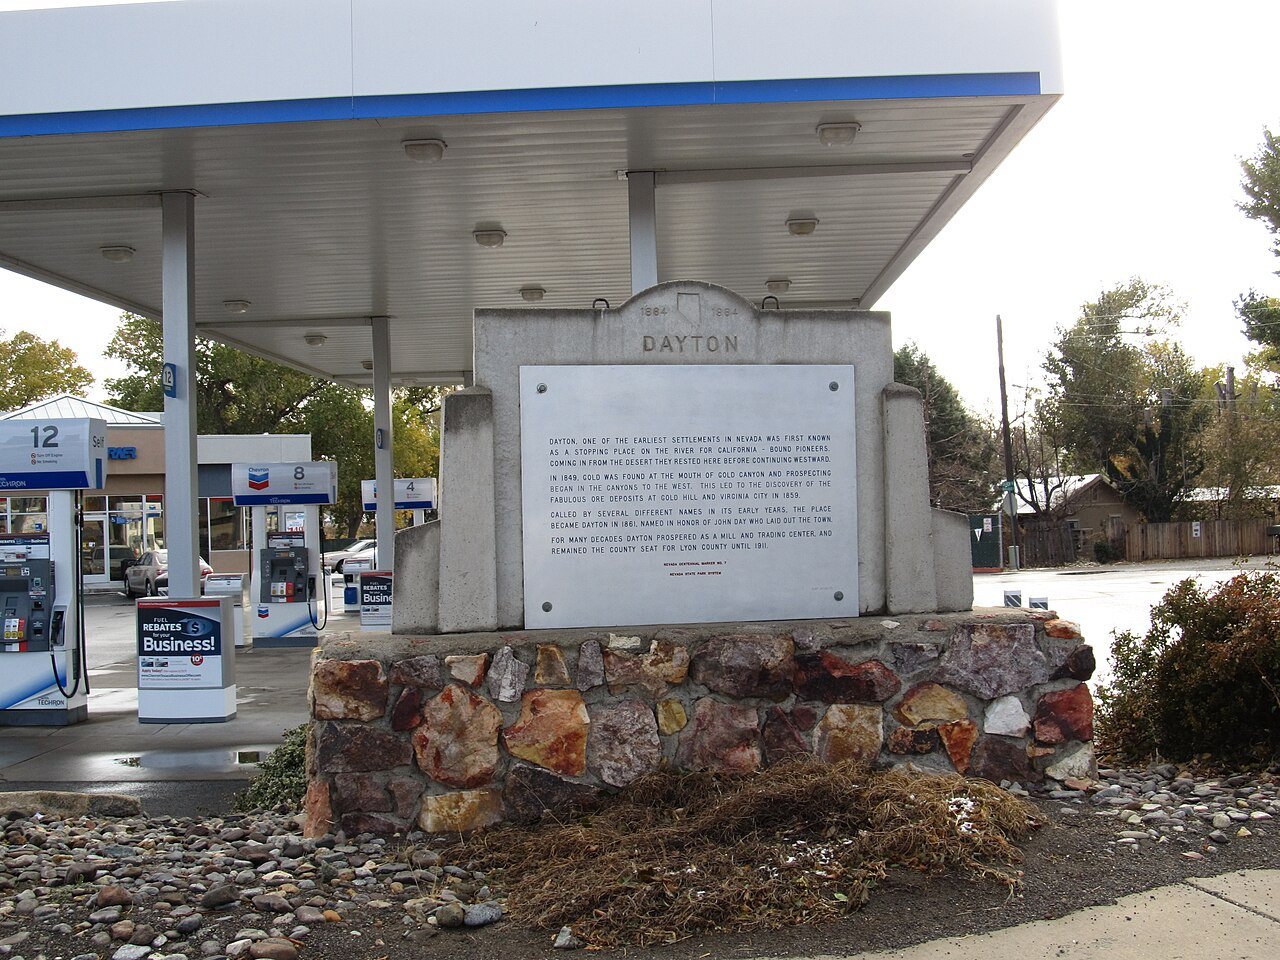
T7 Dayton DaytonLyon County School District 87% 641 15,781
T7 Silver Springs Silver SpringsLyon County School District 87% 641 5,060
T7 Yerington YeringtonLyon County School District 87% 641 3,150
T11 Reno RenoWashoe County School District 85% 4,854 273,212
T11 Sparks SparksWashoe County School District 85% 4,854 110,024
T11 Sun Valley Sun ValleyWashoe County School District 85% 4,854 22,228
T11 Spanish Springs Spanish SpringsWashoe County School District 85% 4,854 17,980
T11 Cold Springs Cold SpringsWashoe County School District 85% 4,854 11,321
T11 Incline Village Incline VillageWashoe County School District 85% 4,854 9,272
T11 Lemmon ValleyWashoe County School District 85% 4,854 4,412
T11 Washoe Valley Washoe ValleyWashoe County School District 85% 4,854 3,315
19 Carson CarsonCarson City School District 84% 639 58,384
T20 Las Vegas Las VegasClark County School District 83% 25,662 660,400
T20 Henderson HendersonClark County School District 83% 25,662 332,141
T20 North Las Vegas North Las VegasClark County School District 83% 25,662 278,595
T20 Enterprise EnterpriseClark County School District 83% 25,662 240,464
T20 Spring Valley Spring ValleyClark County School District 83% 25,662 219,187
T20 Sunrise Manor Sunrise ManorClark County School District 83% 25,662 200,218
T20 Paradise ParadiseClark County School District 83% 25,662 185,913
T20 Whitney WhitneyClark County School District 83% 25,662 47,221
T20 Winchester WinchesterClark County School District 83% 25,662 37,081
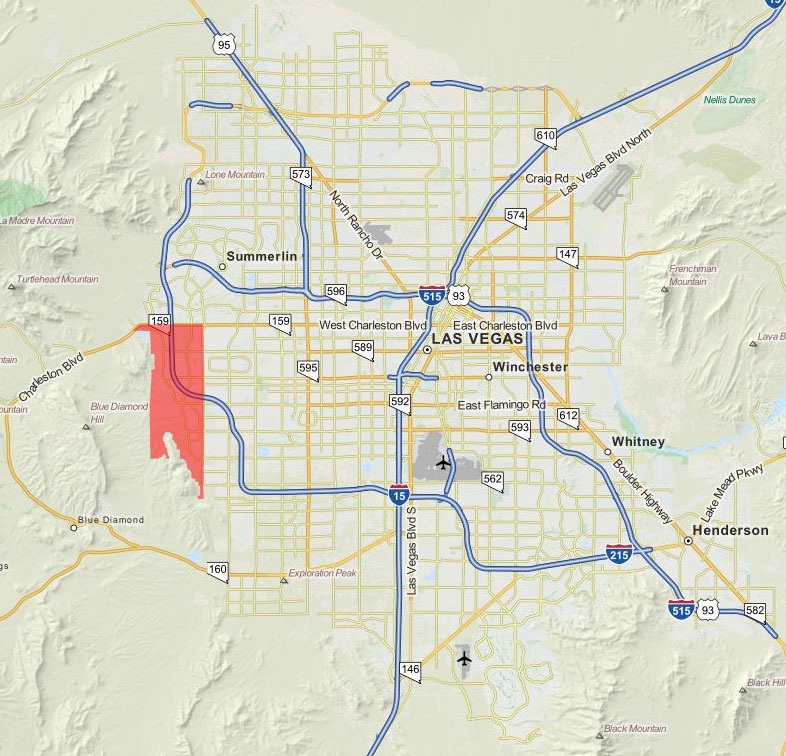
T20 Map of Summerlin South Summerlin SouthClark County School District 83% 25,662 31,354
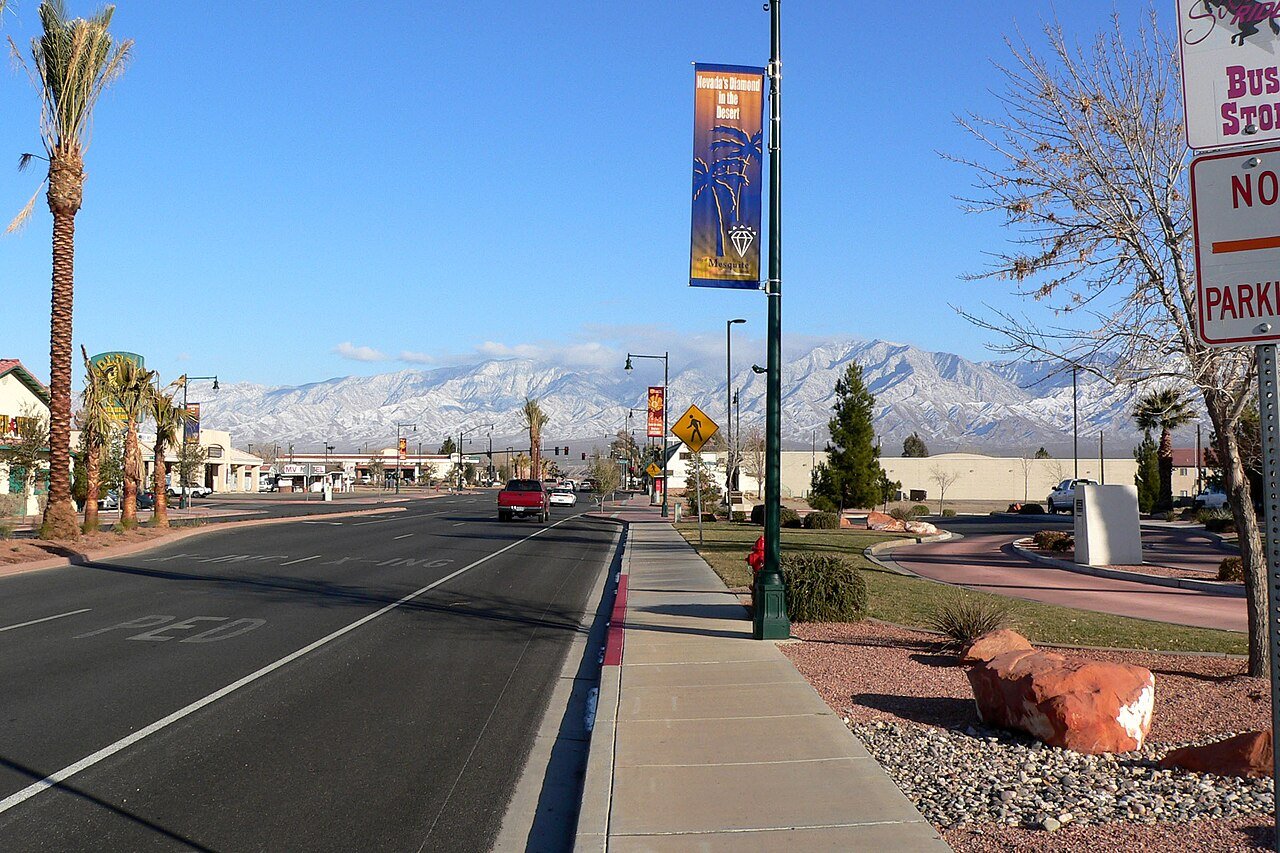
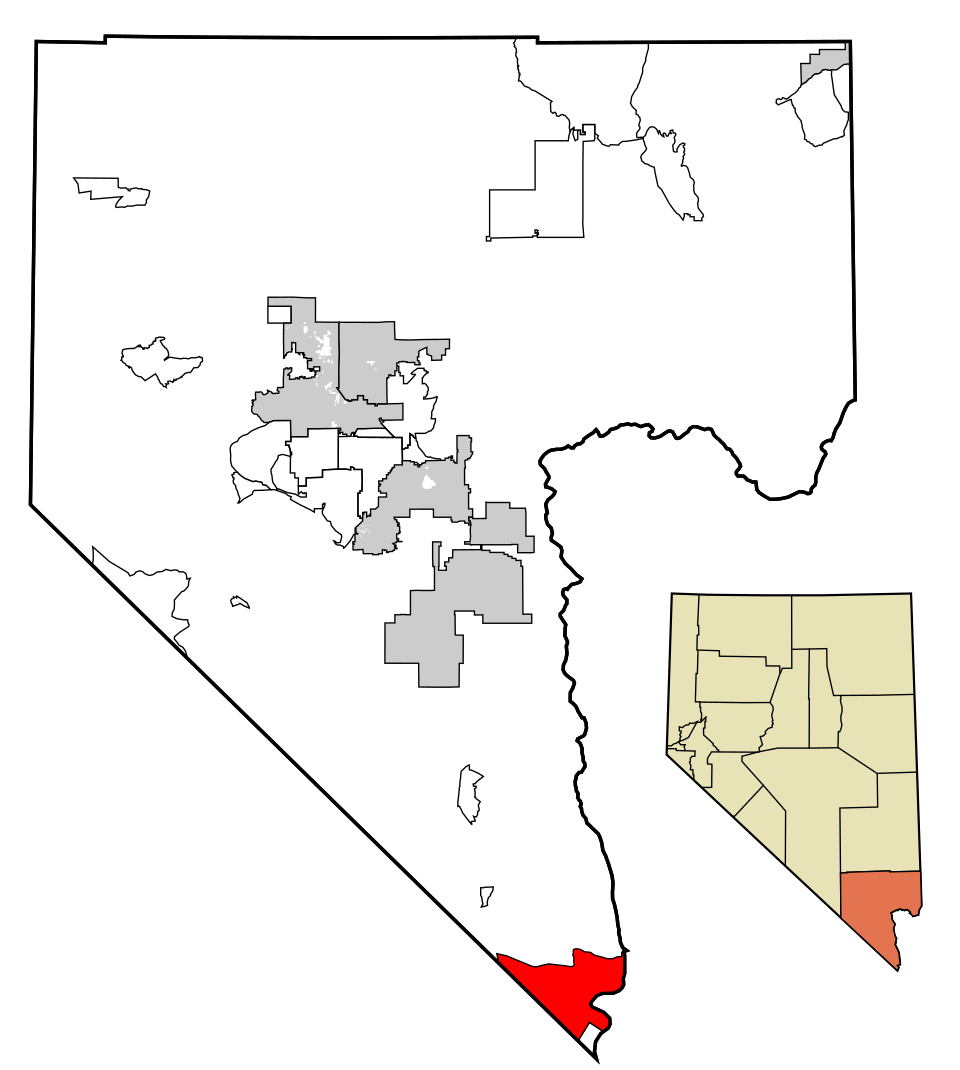
T20 Mesquite MesquiteClark County School District 83% 25,662 22,059
T20 Boulder City Boulder CityClark County School District 83% 25,662 14,919
T20 Map of Laughlin LaughlinClark County School District 83% 25,662 8,789
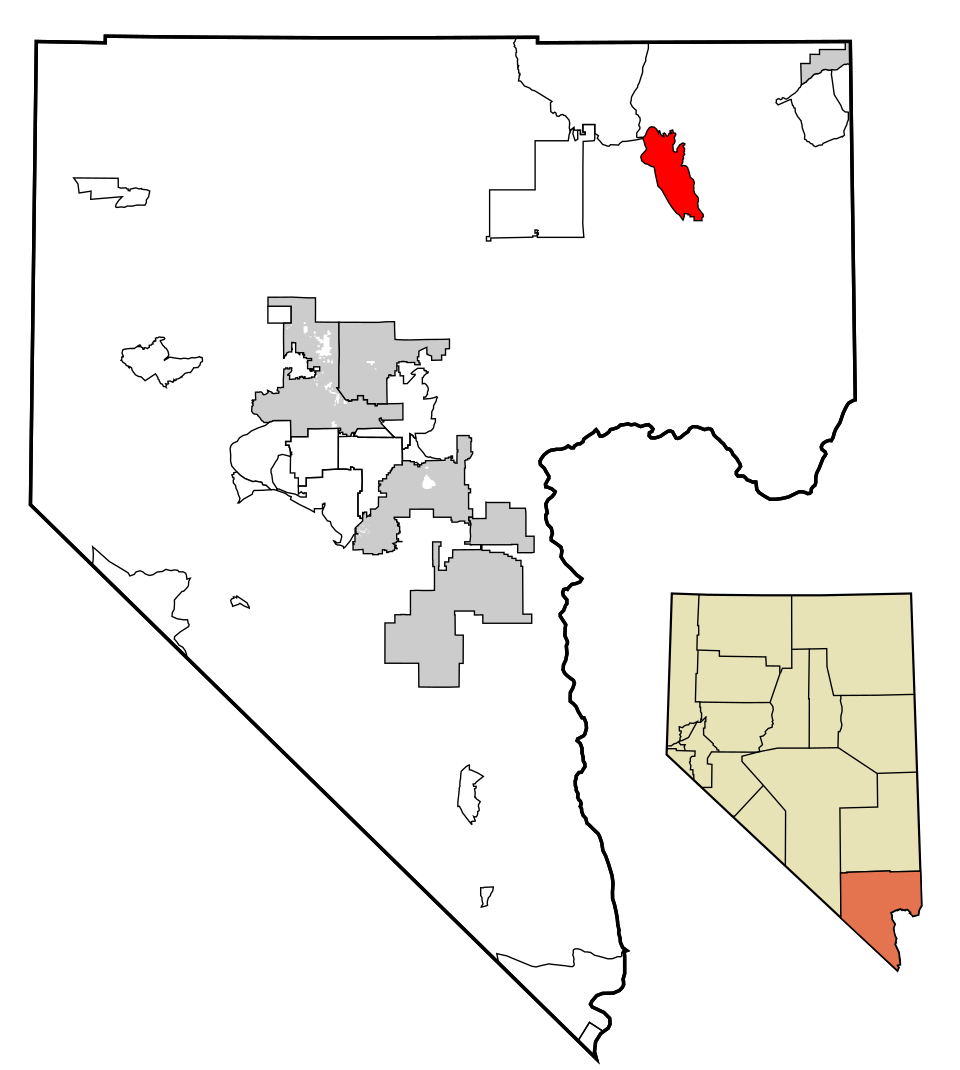
T20 Map of Moapa Valley Moapa ValleyClark County School District 83% 25,662 6,684
T20 Nellis AFBClark County School District 83% 25,662 5,087
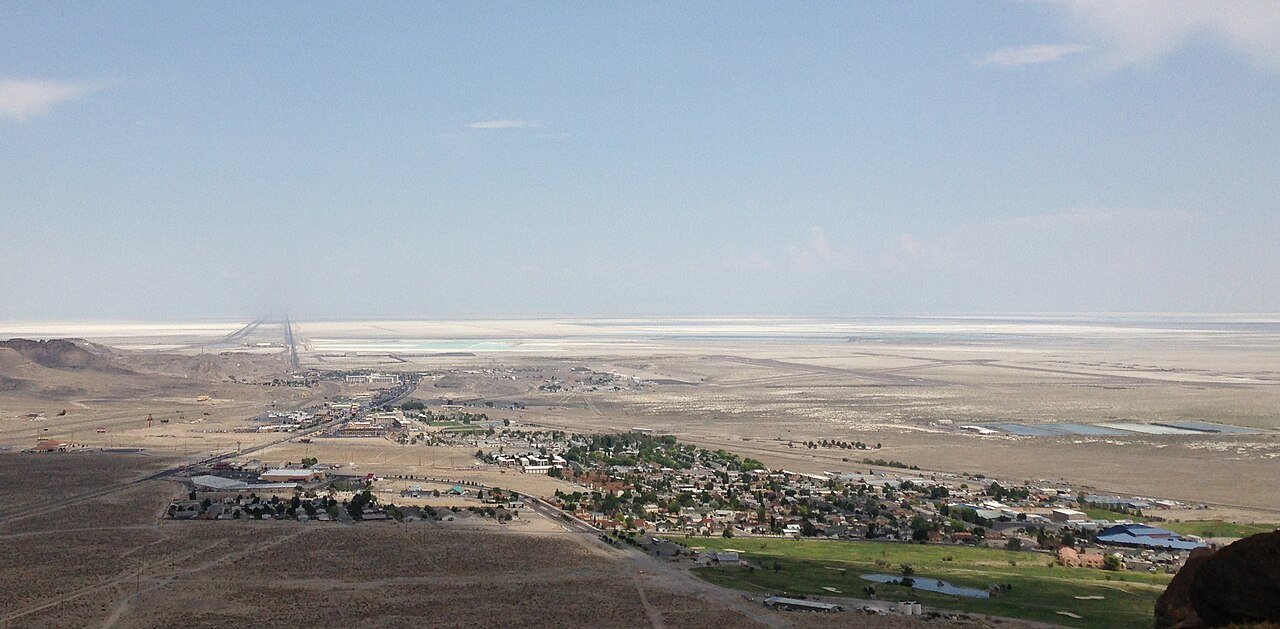
T35 Elko ElkoElko County School District 82% 685 20,696
T35 Spring Creek Spring CreekElko County School District 82% 685 14,739
T35 West Wendover West WendoverElko County School District 82% 685 4,514
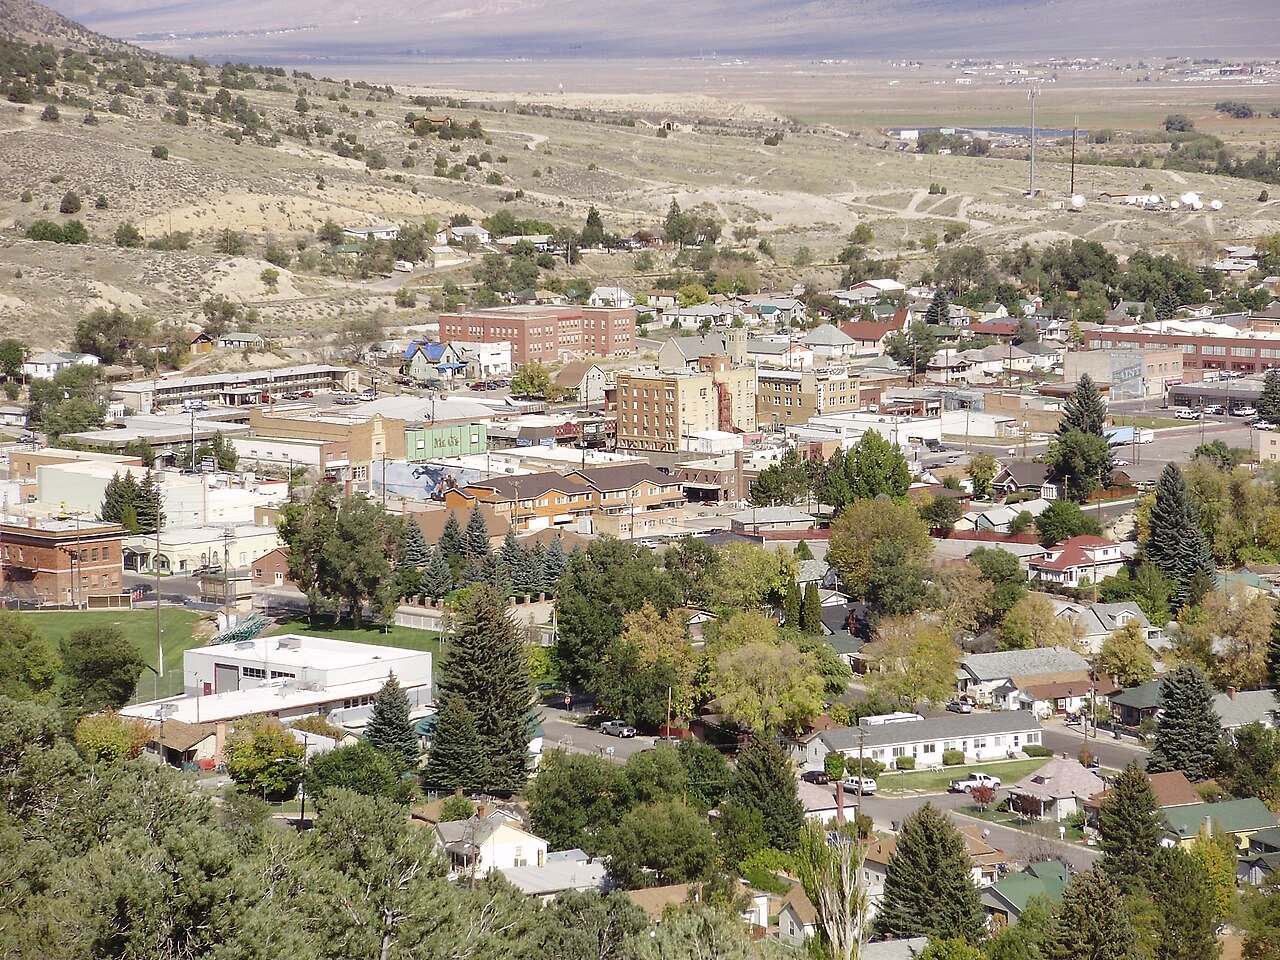
T35 Ely ElyWhite Pine County School District 82% 111 3,929
T35 Battle Mountain Battle MountainLander County School District 82% 61 3,518
T40 Pahrump PahrumpNye County School District 77% 462 47,347
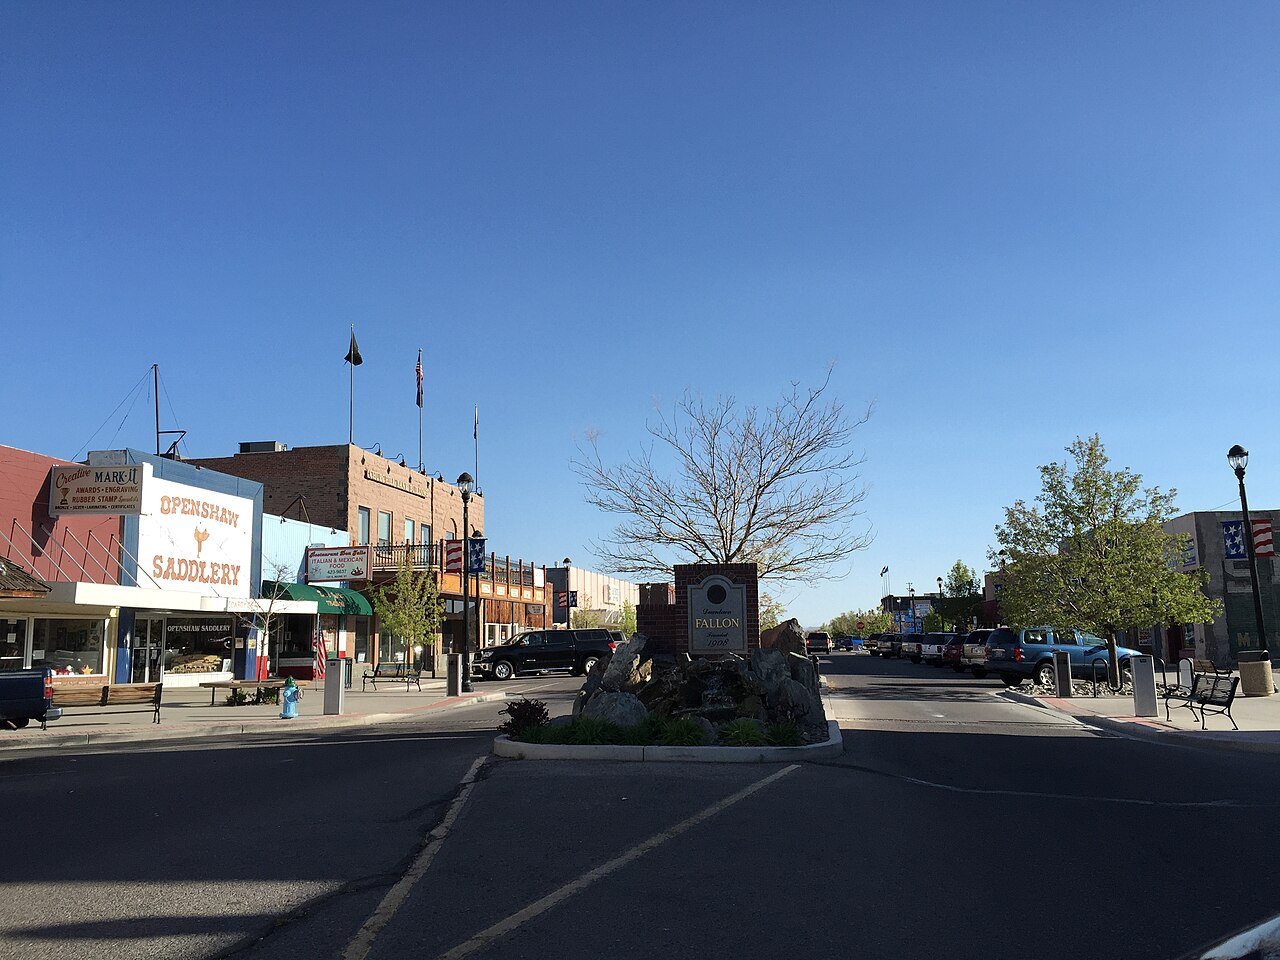
T40 Fallon FallonChurchill County School District 77% 251 9,463

How this ranking works

Each town gets the four-year graduation rate of the public school district that runs its high school for the class of 2020: the share of students who started ninth grade together and earned a regular diploma within four years, counting students who transferred in and out. Every state computes it the same federal way. Where a regional district serves several towns, they all share its rate and its rank.

We leave out a town split between high school districts, a district whose class had fewer than 20 students, and one the Department of Education reports only as a wide range (such as 50–100%). Those numbers are too uncertain to rank. The Department also publishes most rates in bands rather than exact figures (a rate between 95% and 99% is shown as 97%), which is why many towns tie. Graduation data: EDFacts via the Urban Institute Education Data Portal. Each district's page shows its rate against the state.

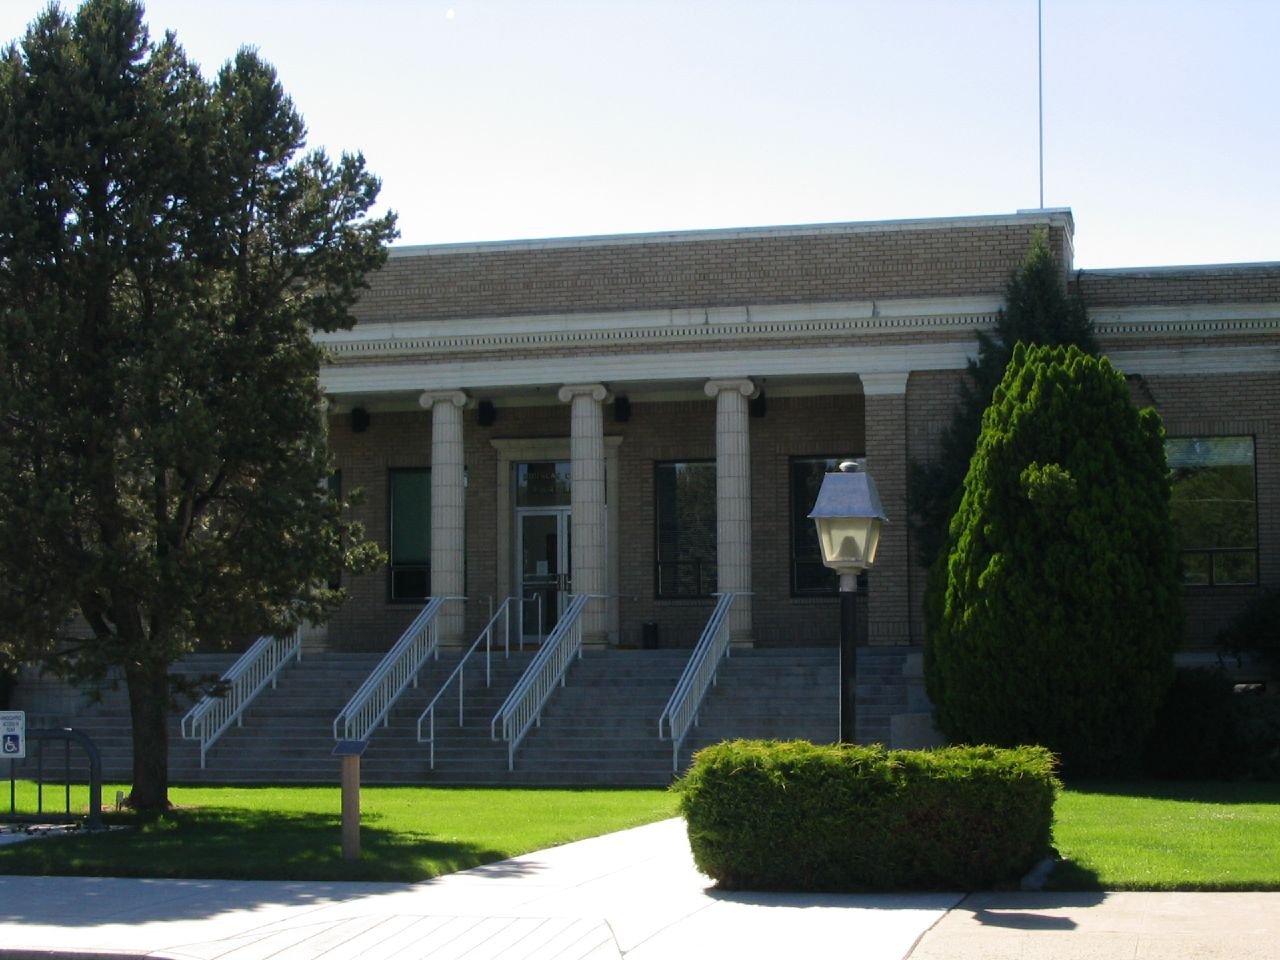
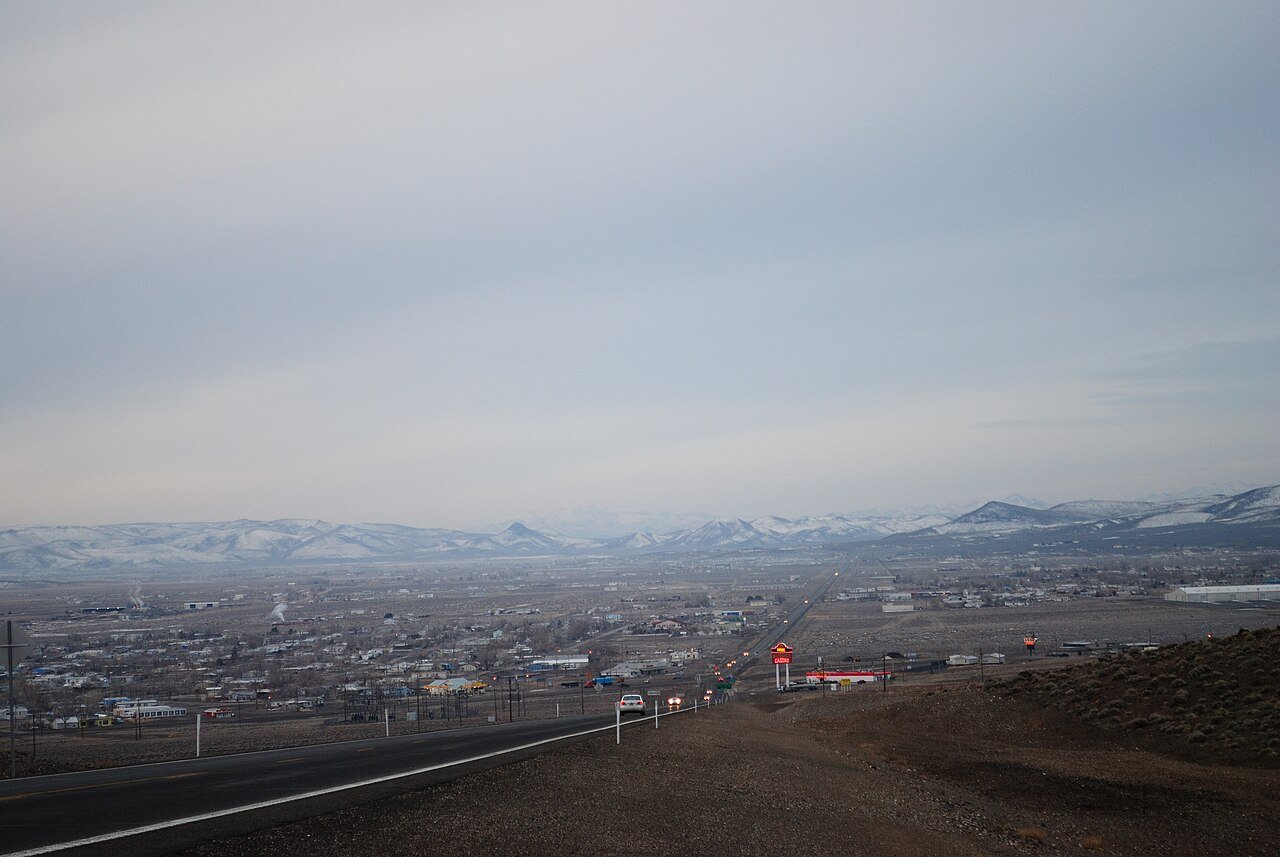
Only towns with at least 2,500 residents are ranked; Census estimates for smaller places are too uncertain. Population and income: U.S. Census Bureau American Community Survey 5-year estimates. Town photos: Wikimedia Commons, credited on each town’s page.

Same ranking in other states