NVNevada rankings

Towns with the lowest depression rates in Nevada

Ranked by the share of adults who have ever been told by a doctor that they have depression, as estimated by the CDC. 42 towns with 2,500+ residents.
CDC PLACES health estimates, 2025 release

#TownAdults with depressionLikely rangePopulation
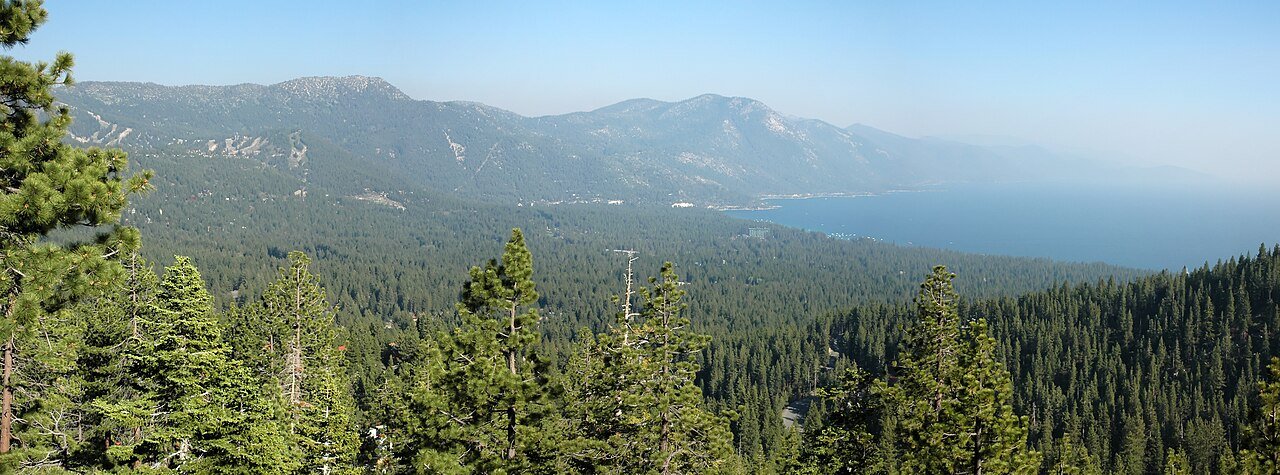
T1 Map of Johnson Lane Johnson Lane6,467 people 19% 16–22% 6,467
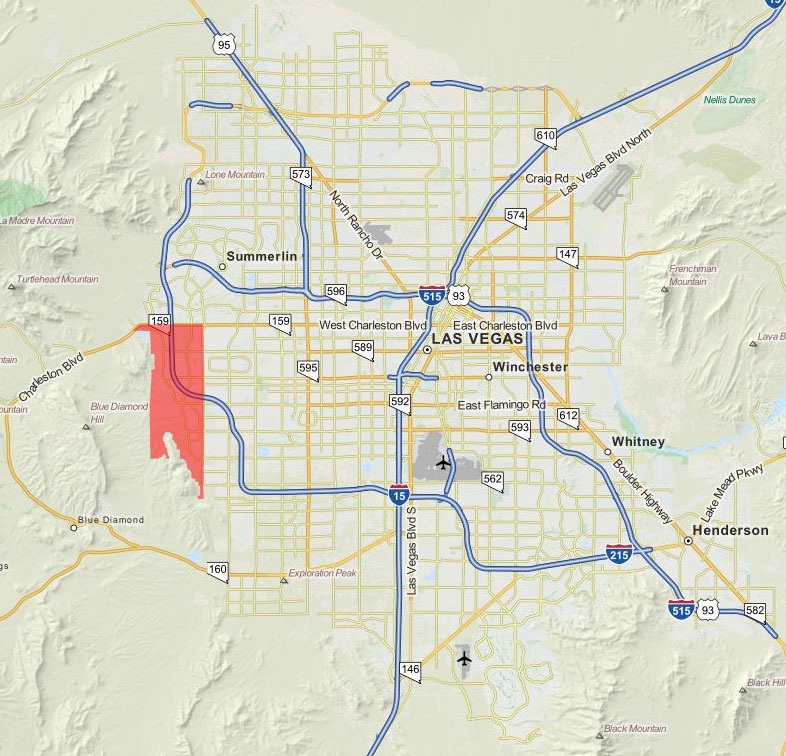
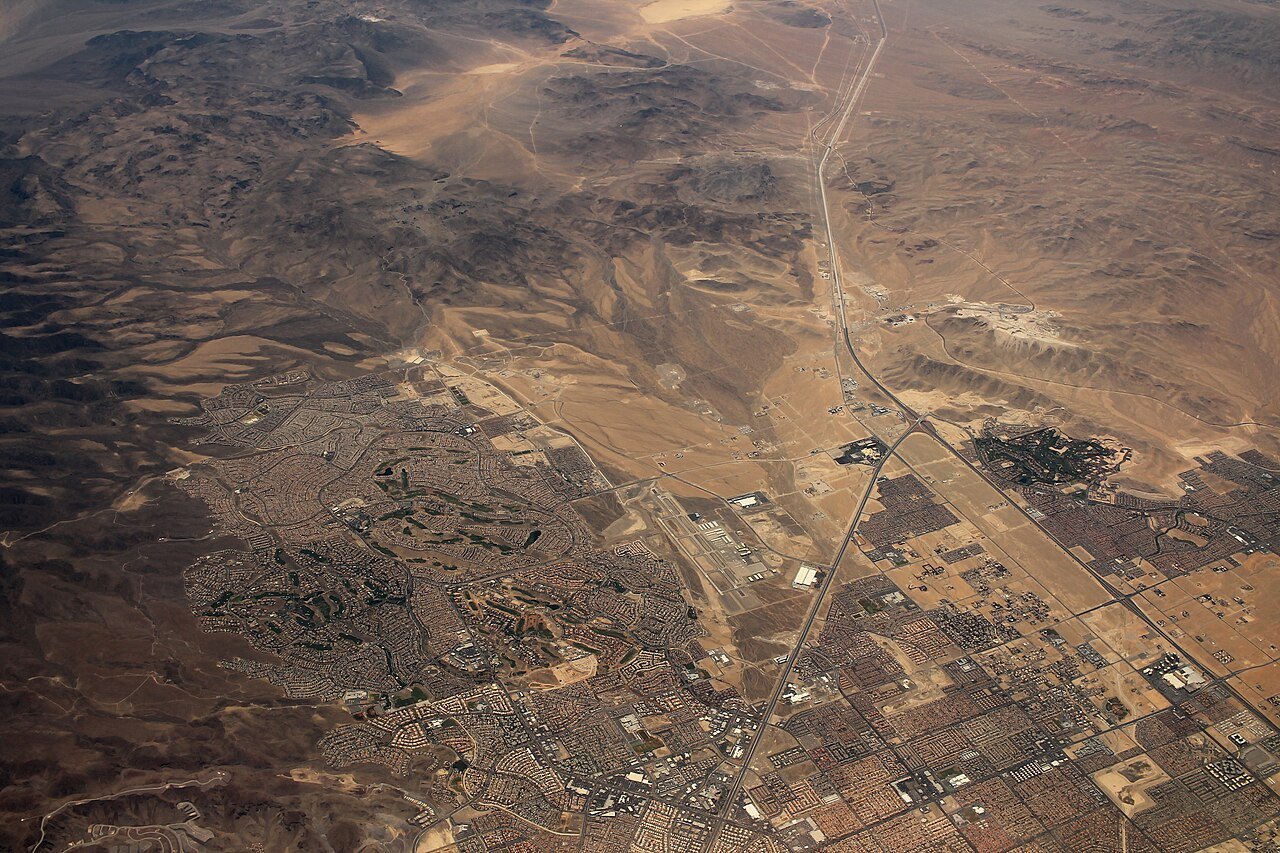
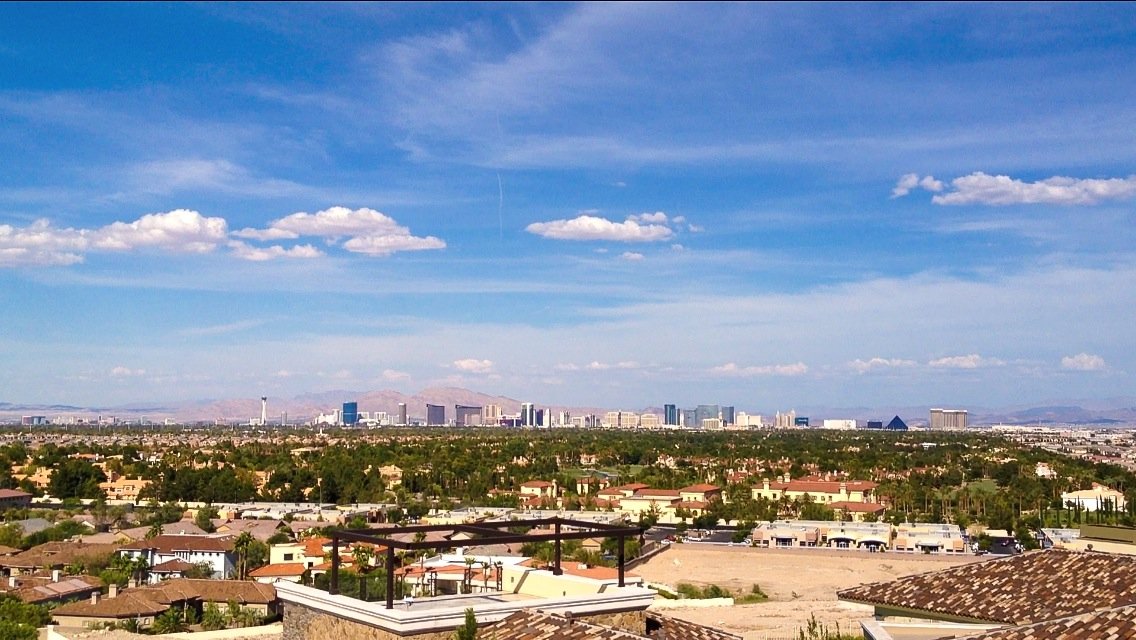
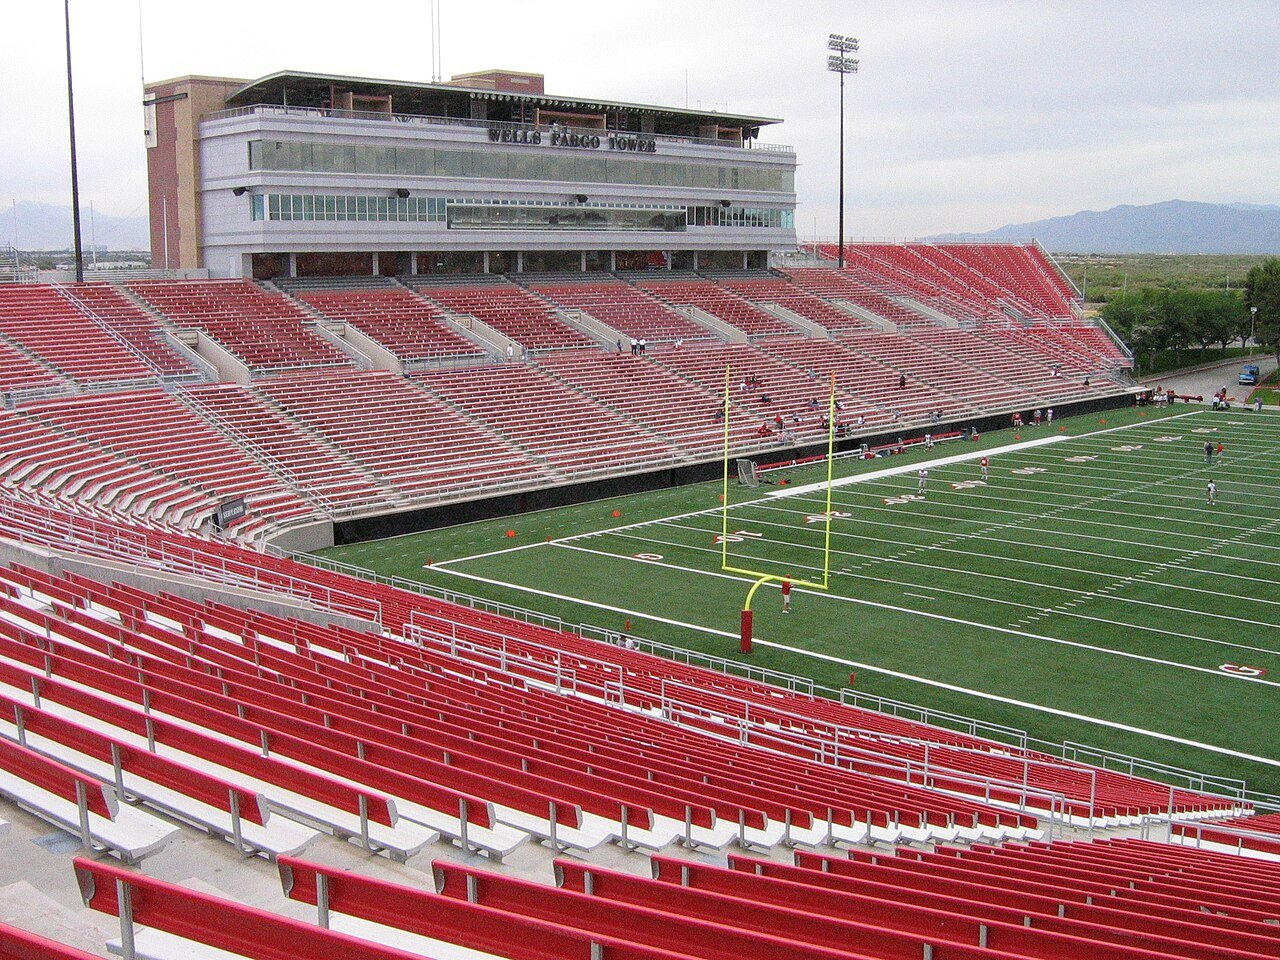
T1 Map of Summerlin South Summerlin South31,354 people 19% 17–22% 31,354
T3 Minden Minden3,707 people 20% 16–23% 3,707
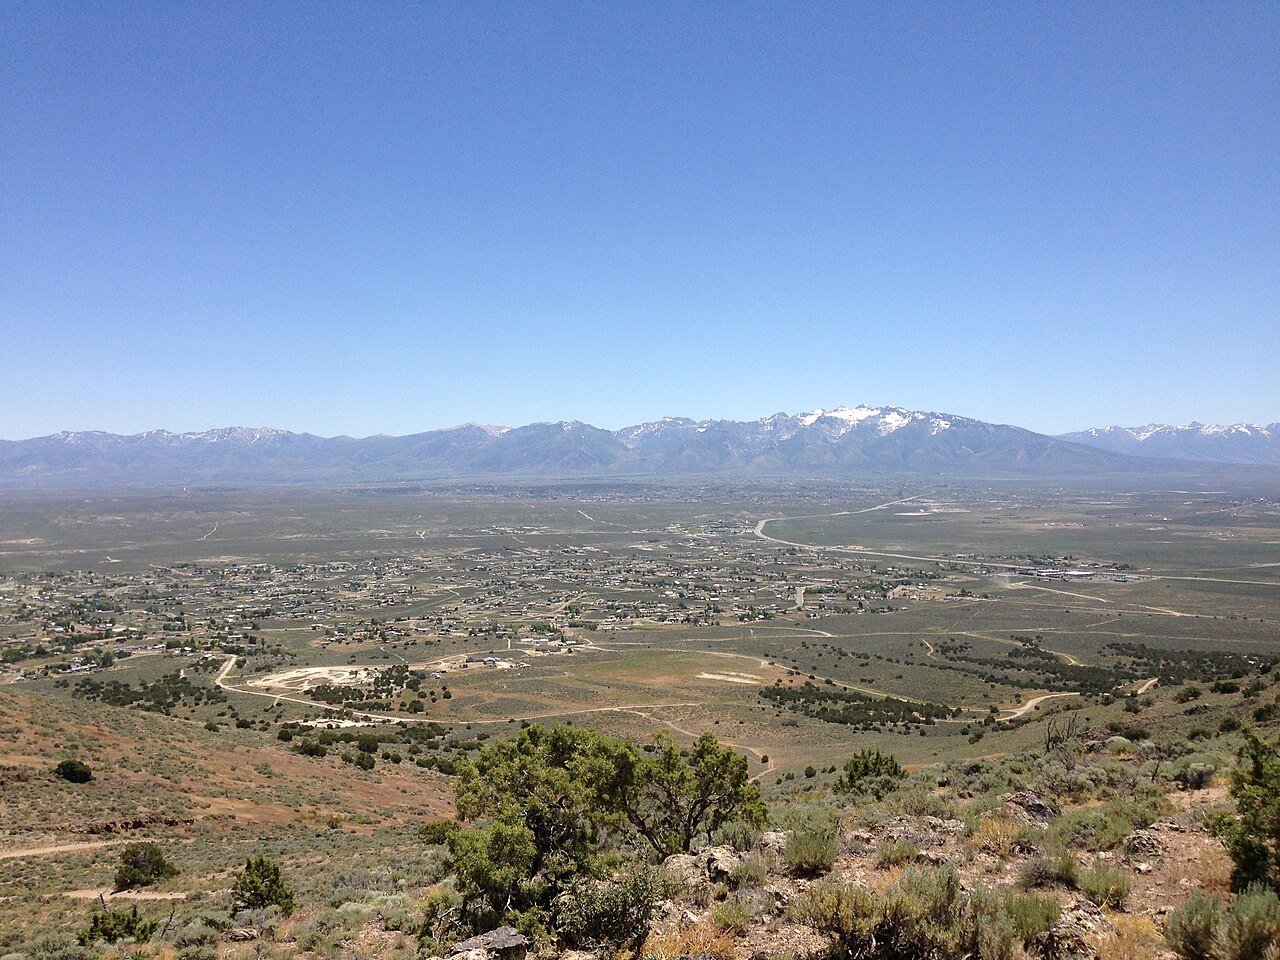
T3 Map of Indian Hills Indian Hills5,527 people 20% 16–23% 5,527
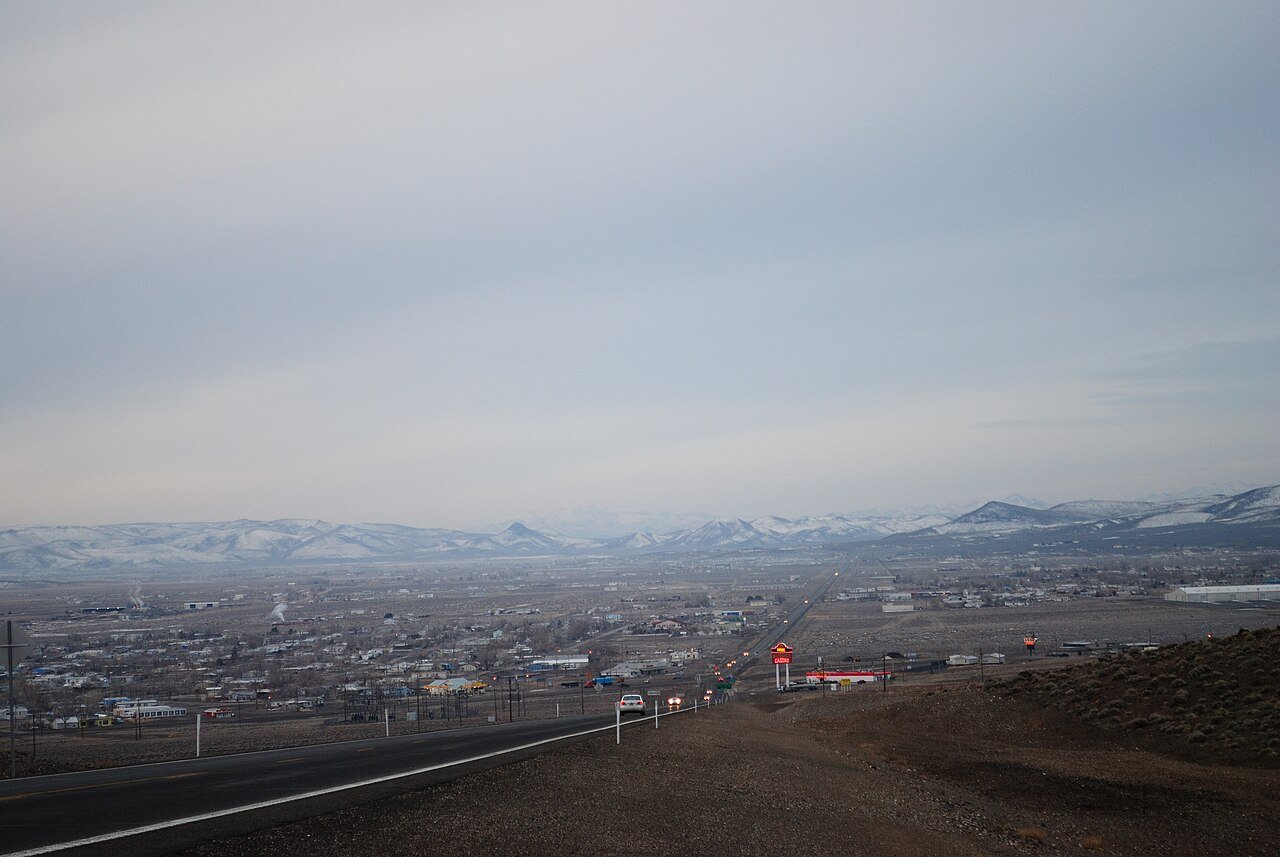
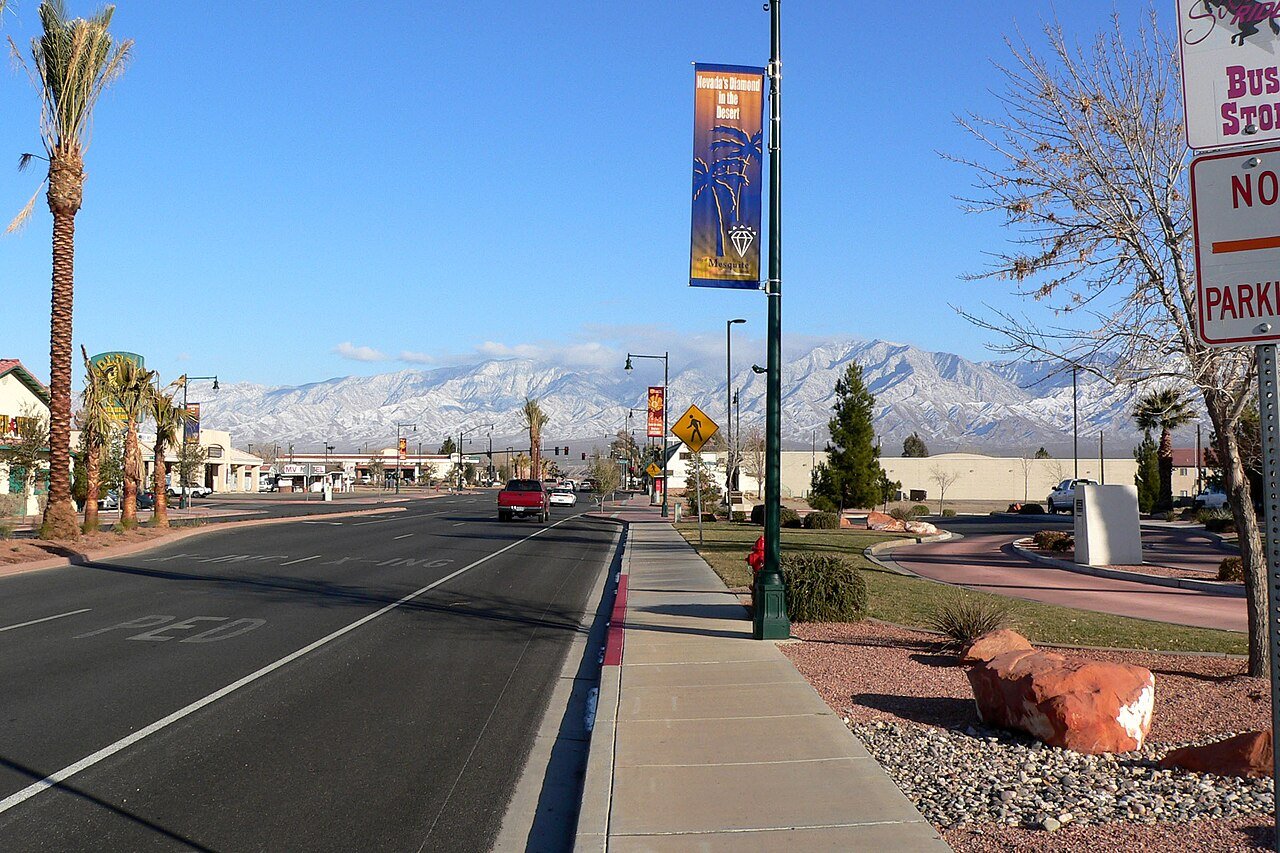
T3 Mesquite Mesquite22,059 people 20% 17–23% 22,059
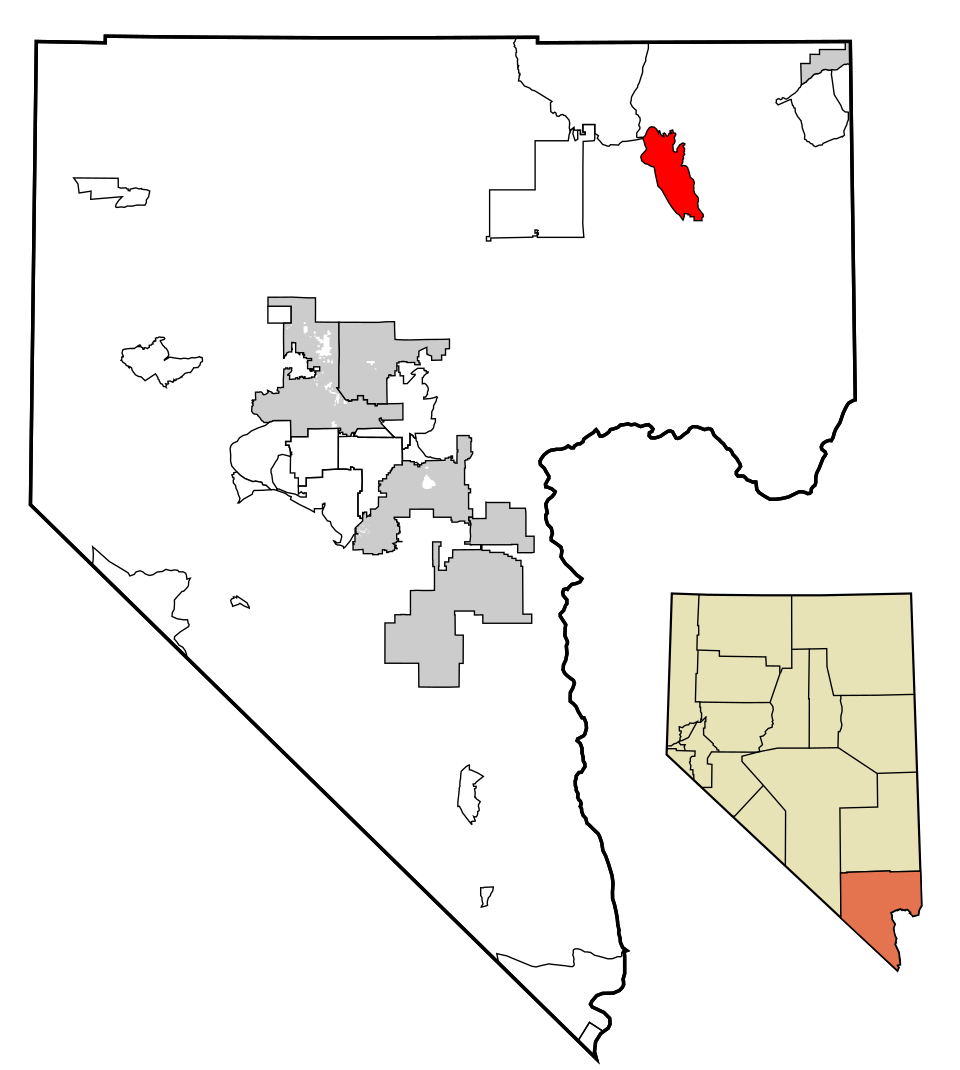
T3 Incline Village Incline Village9,272 people 20% 17–23% 9,272
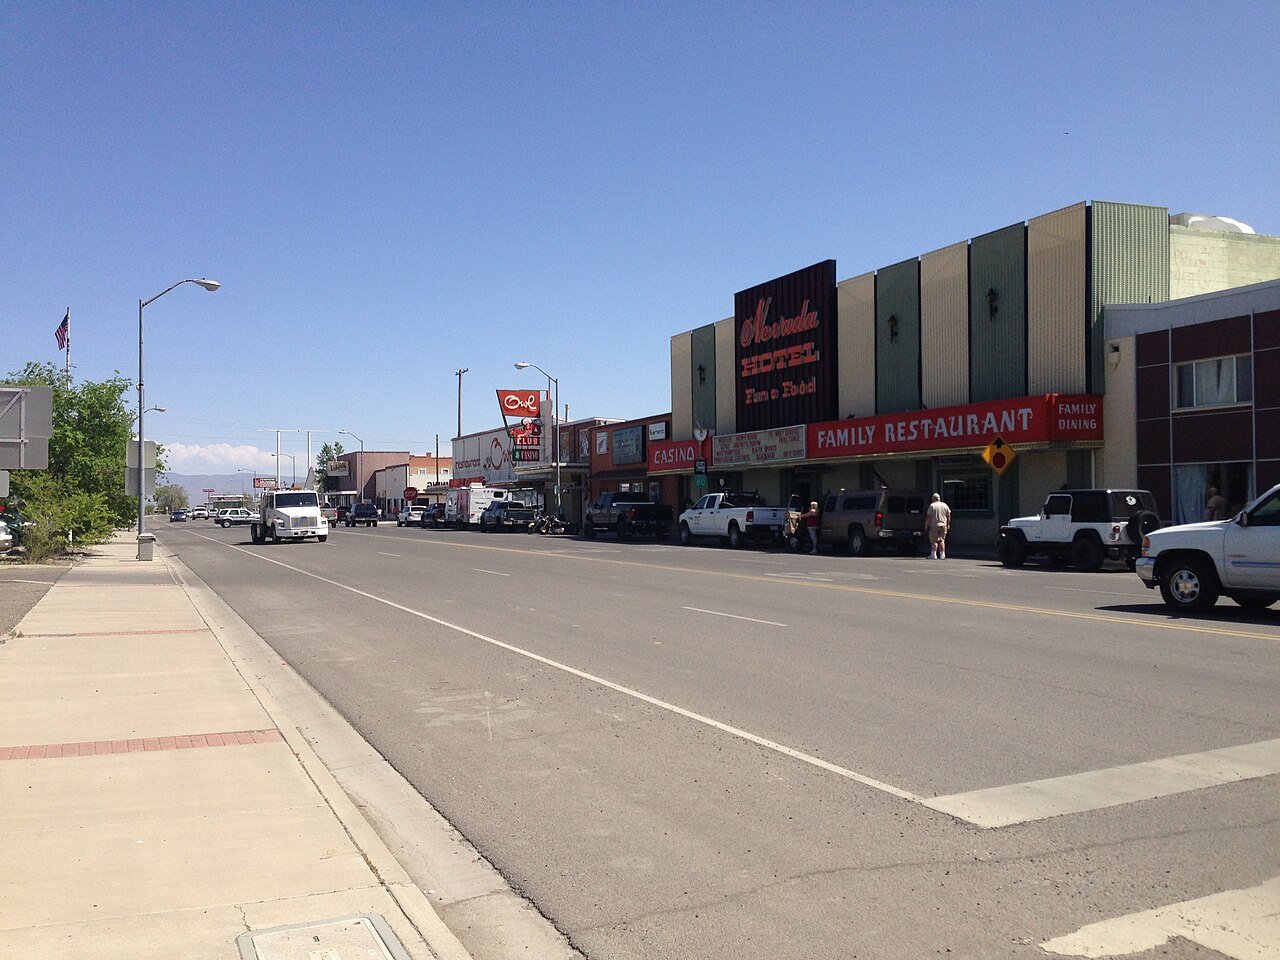
T3 Enterprise Enterprise240,464 people 20% 17–23% 240,464
T3 Spring Valley Spring Valley219,187 people 20% 17–23% 219,187
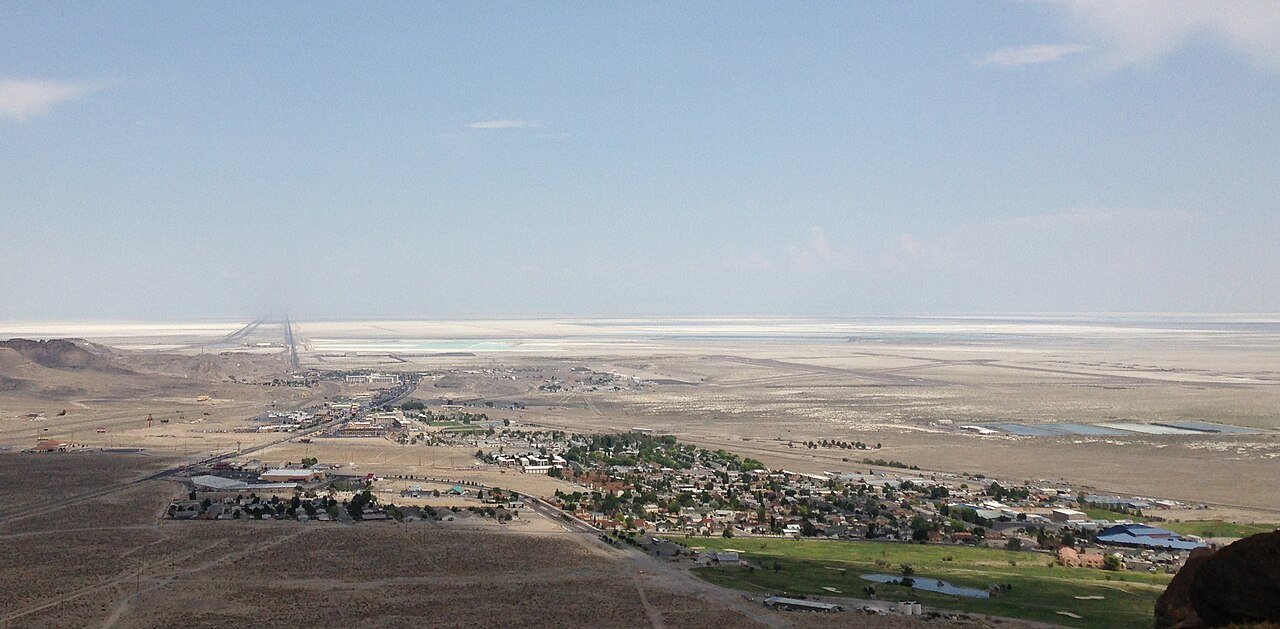
T3 West Wendover West Wendover4,514 people 20% 17–24% 4,514
T3 Gardnerville Gardnerville5,486 people 20% 17–24% 5,486
T3 Map of Gardnerville Ranchos Gardnerville Ranchos12,114 people 20% 17–24% 12,114
T12 North Las Vegas North Las Vegas278,595 people 21% 18–24% 278,595
T12 Henderson Henderson332,141 people 21% 18–24% 332,141
T12 Paradise Paradise185,913 people 21% 18–24% 185,913
T12 Whitney Whitney47,221 people 21% 18–24% 47,221
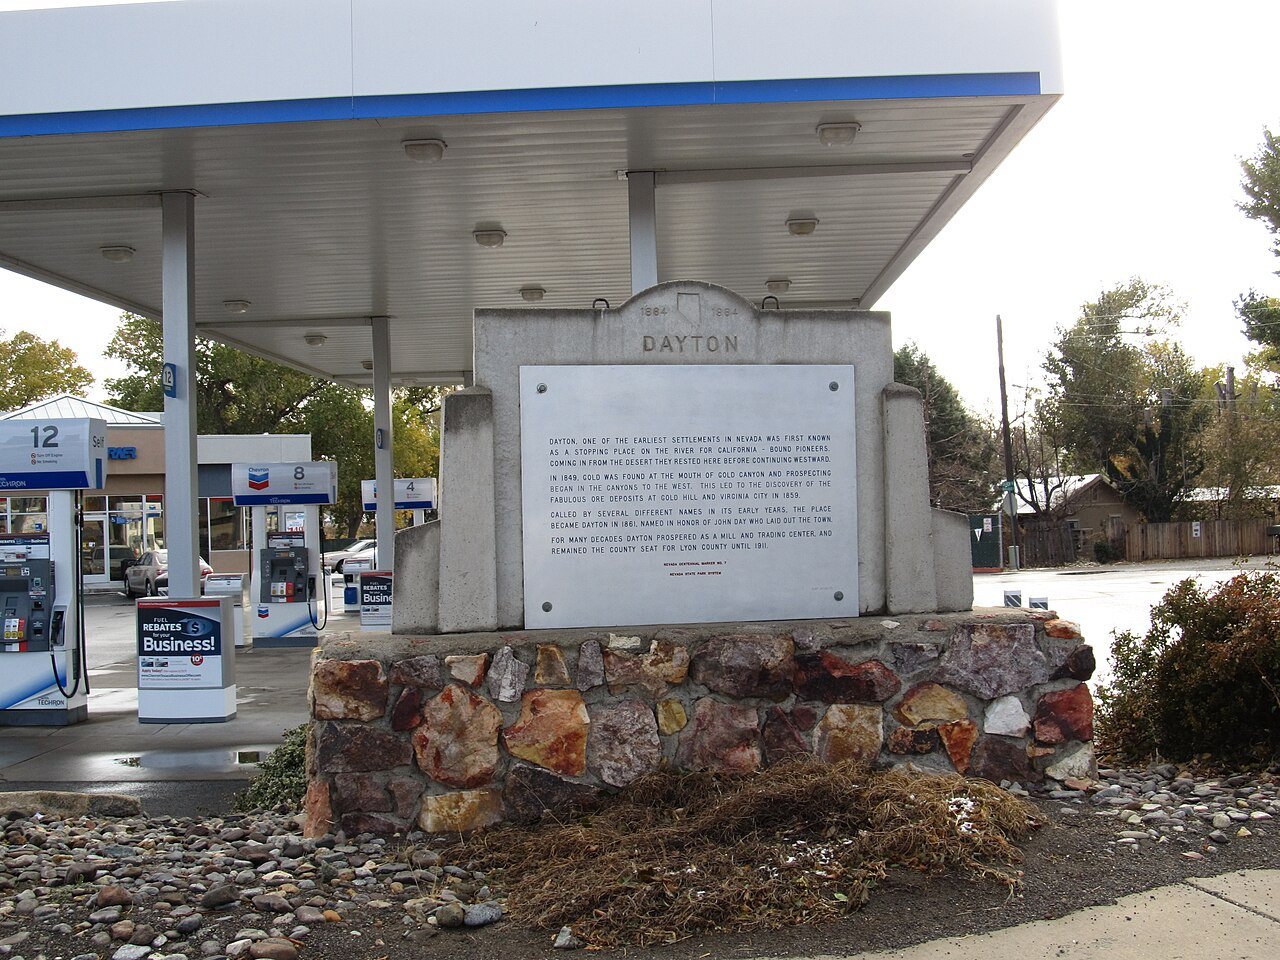
T12 Dayton Dayton15,781 people 21% 18–25% 15,781
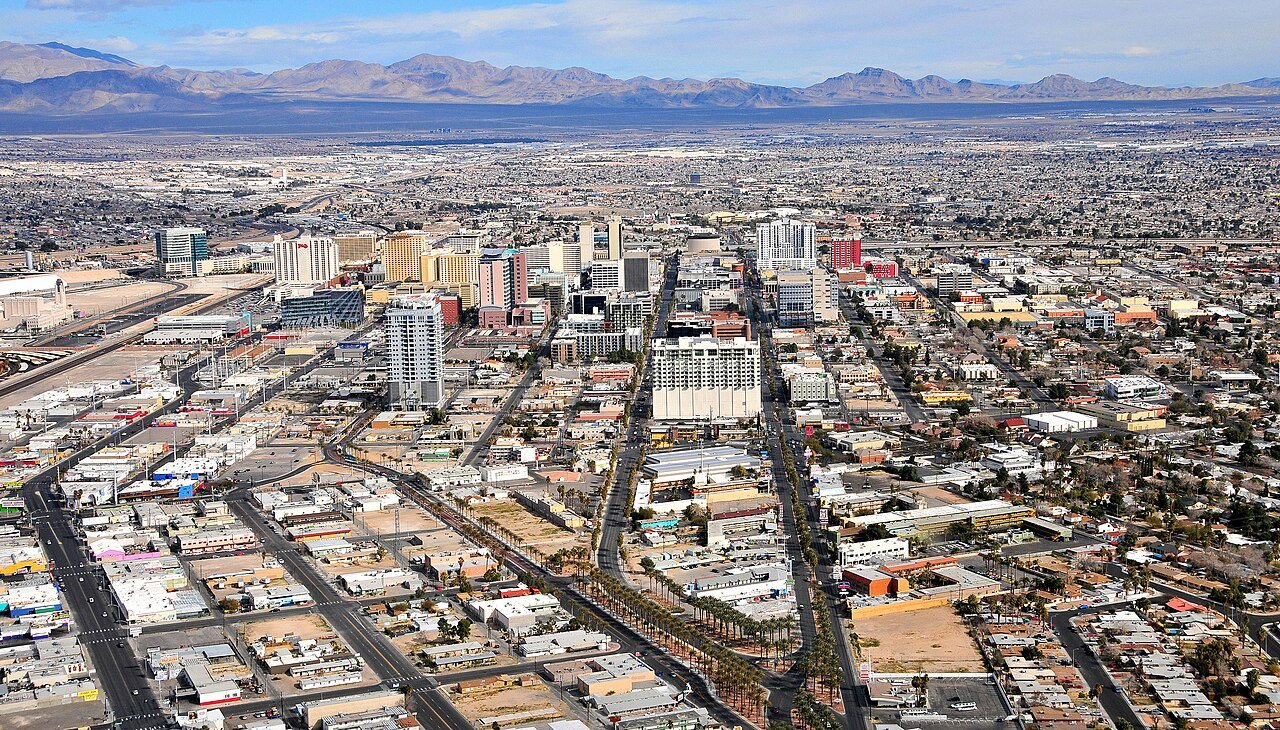
T12 Las Vegas Las Vegas660,400 people 21% 18–24% 660,400
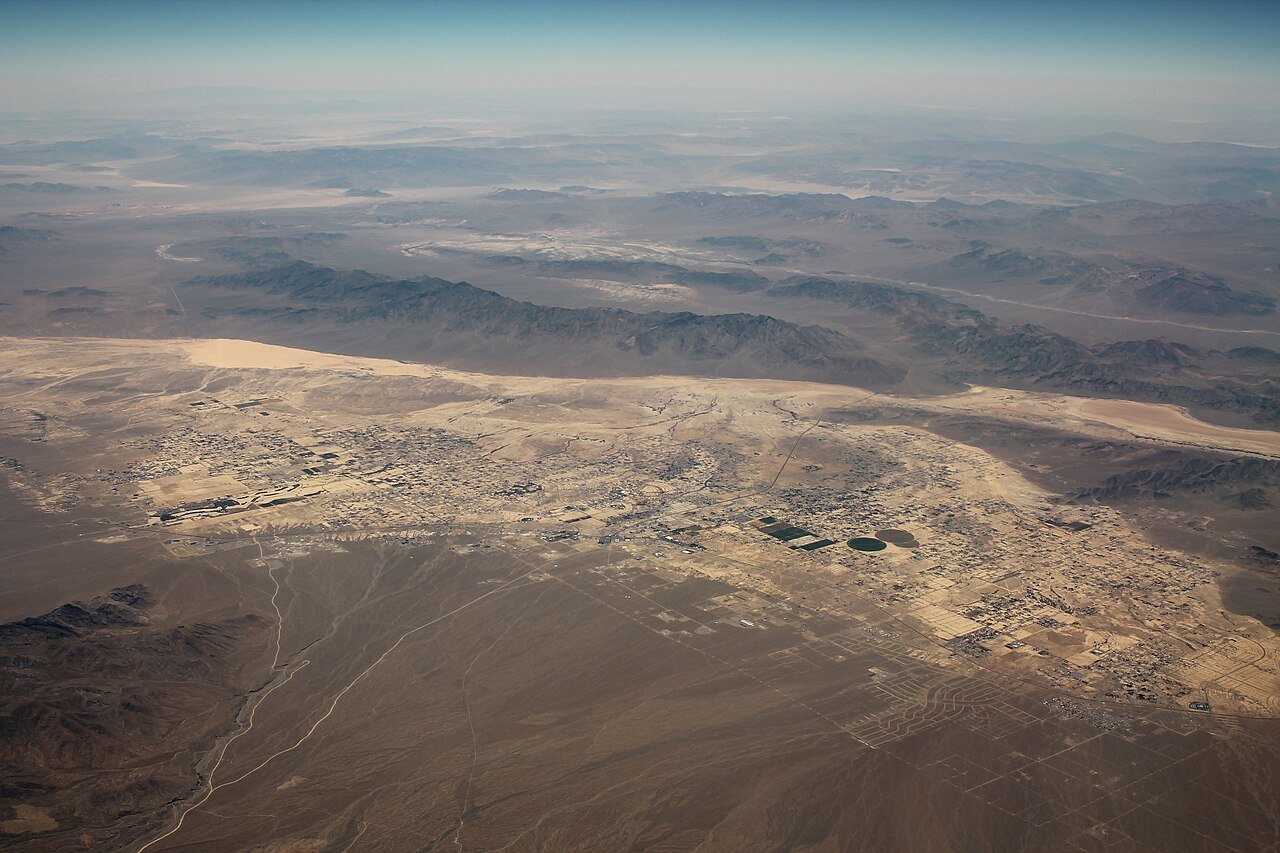
T12 Pahrump Pahrump47,347 people 21% 18–25% 47,347
T12 Winchester Winchester37,081 people 21% 18–24% 37,081
T12 Sunrise Manor Sunrise Manor200,218 people 21% 18–24% 200,218
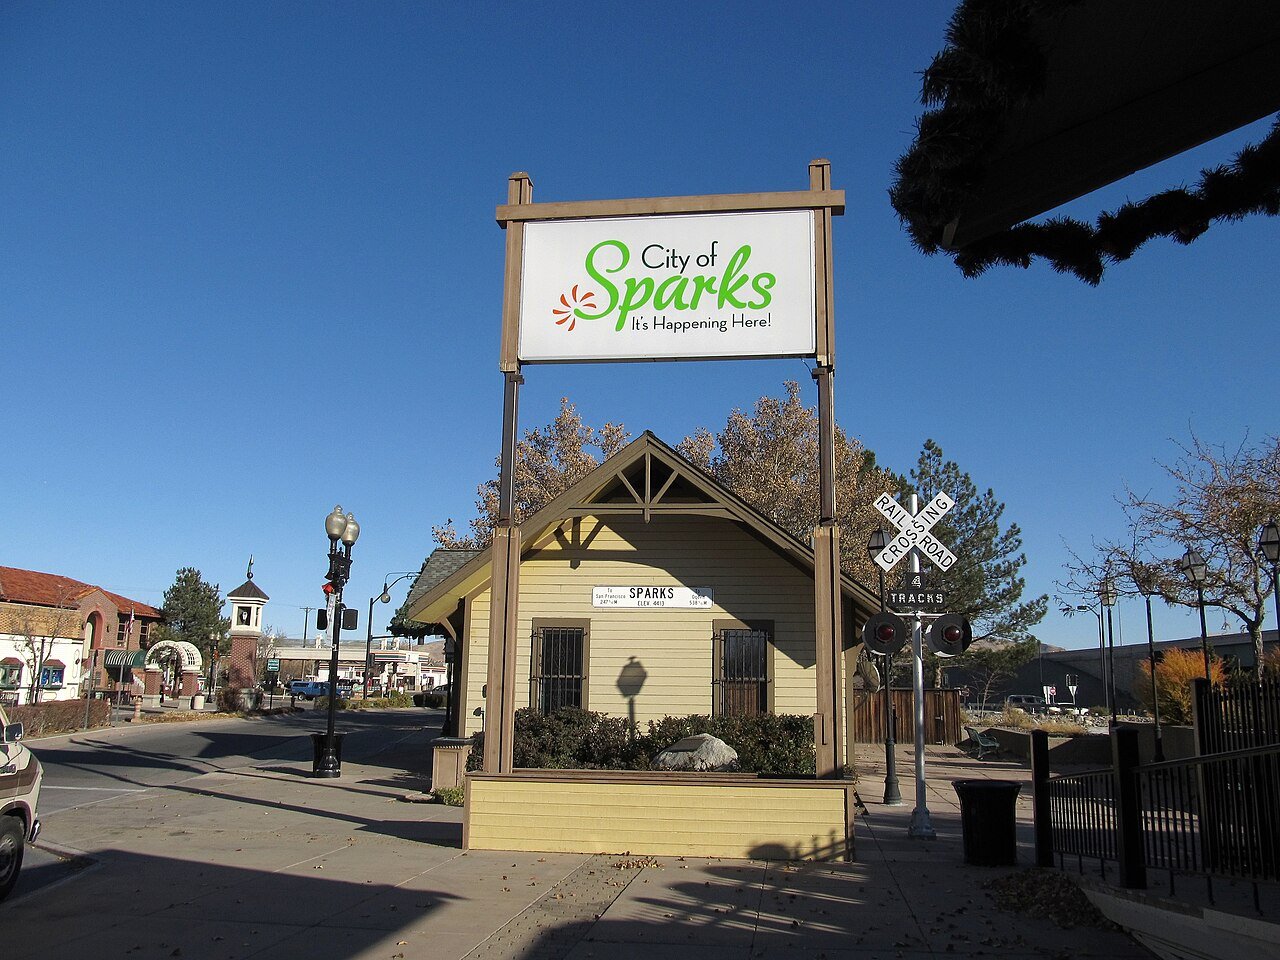
T12 Sparks Sparks110,024 people 21% 18–24% 110,024
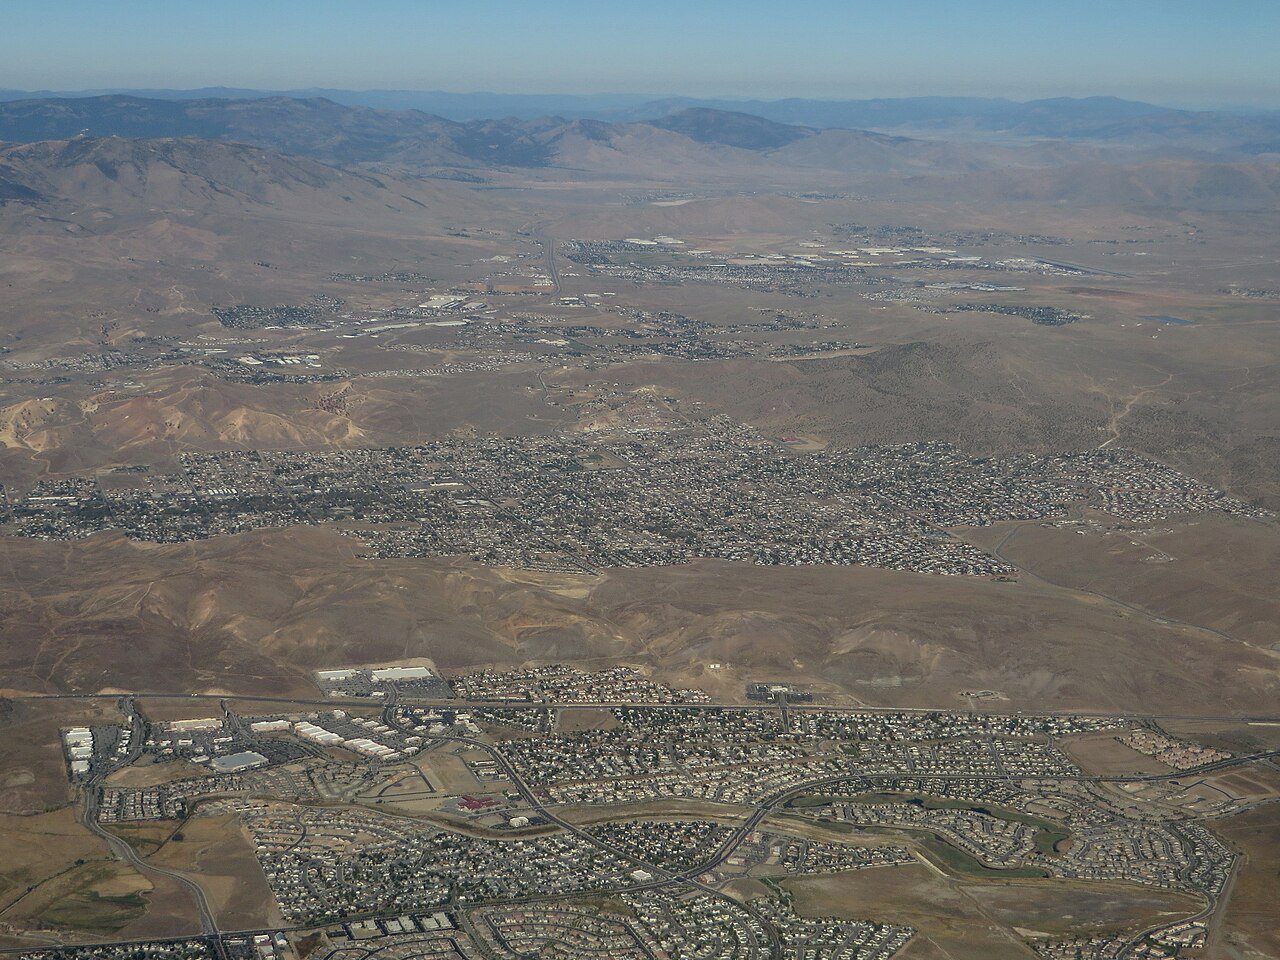
T22 Spanish Springs Spanish Springs17,980 people 22% 19–25% 17,980
T22 Carson Carson58,384 people 22% 18–26% 58,384
T22 Boulder City Boulder City14,919 people 22% 19–25% 14,919
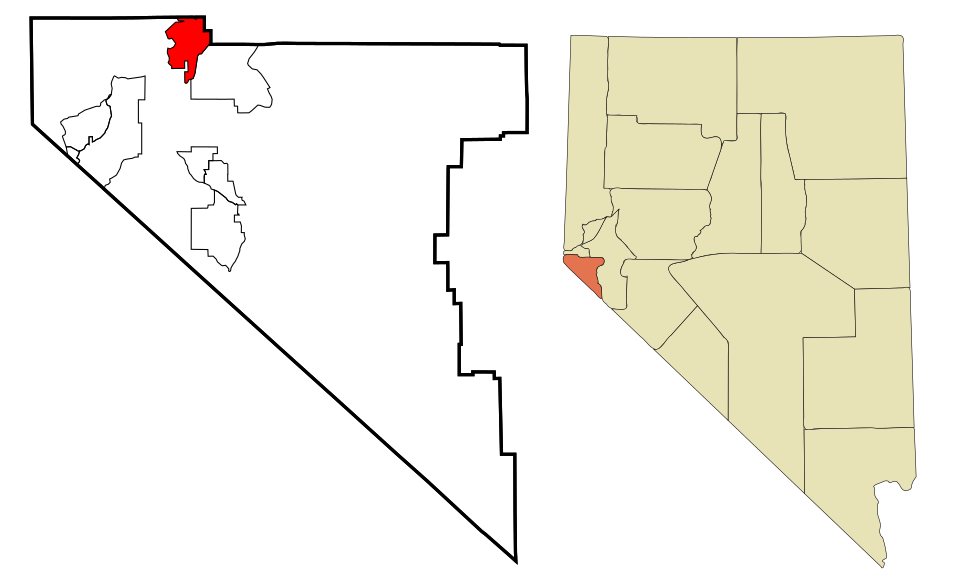
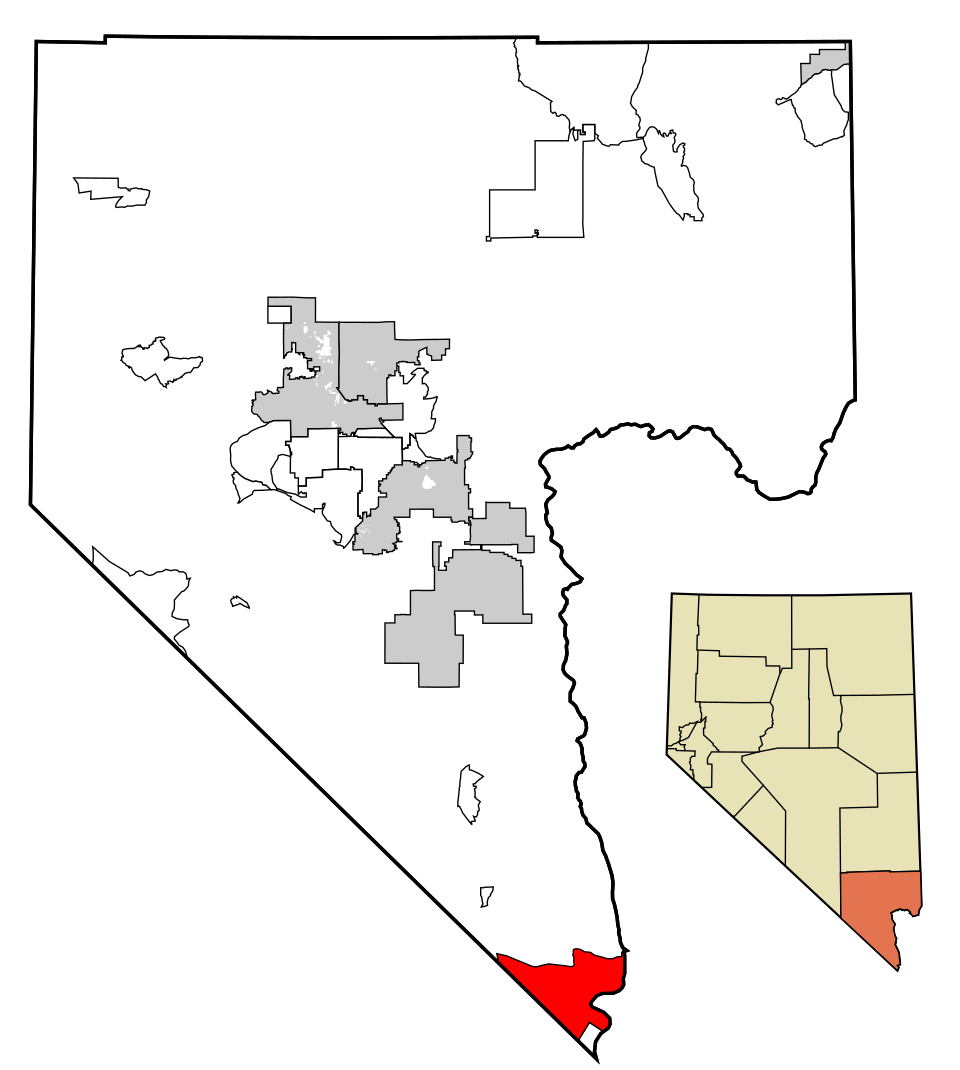
T22 Map of Laughlin Laughlin8,789 people 22% 19–25% 8,789
T22 Elko Elko20,696 people 22% 18–26% 20,696
T22 Washoe Valley Washoe Valley3,315 people 22% 19–25% 3,315
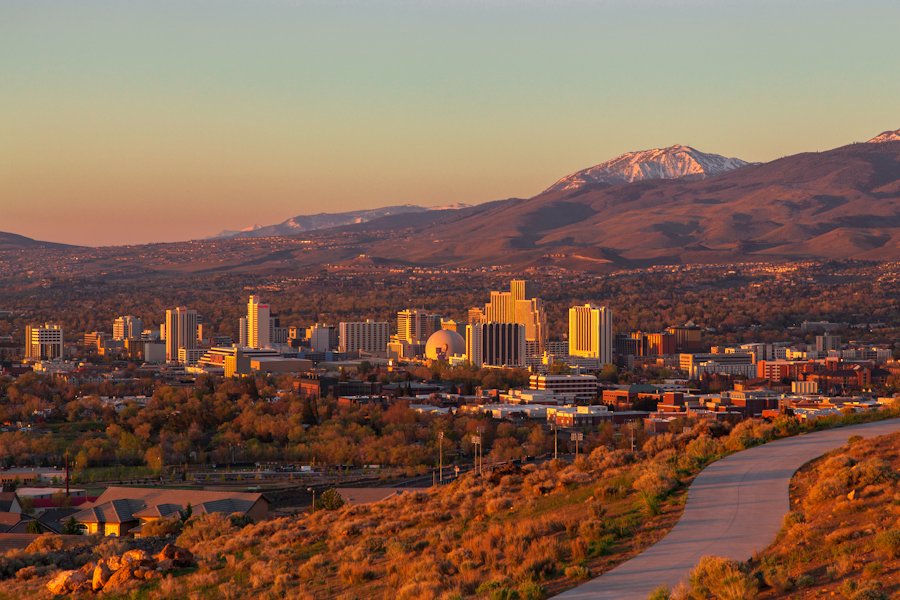
T22 Reno Reno273,212 people 22% 19–25% 273,212
T22 Lemmon Valley4,412 people 22% 19–25% 4,412
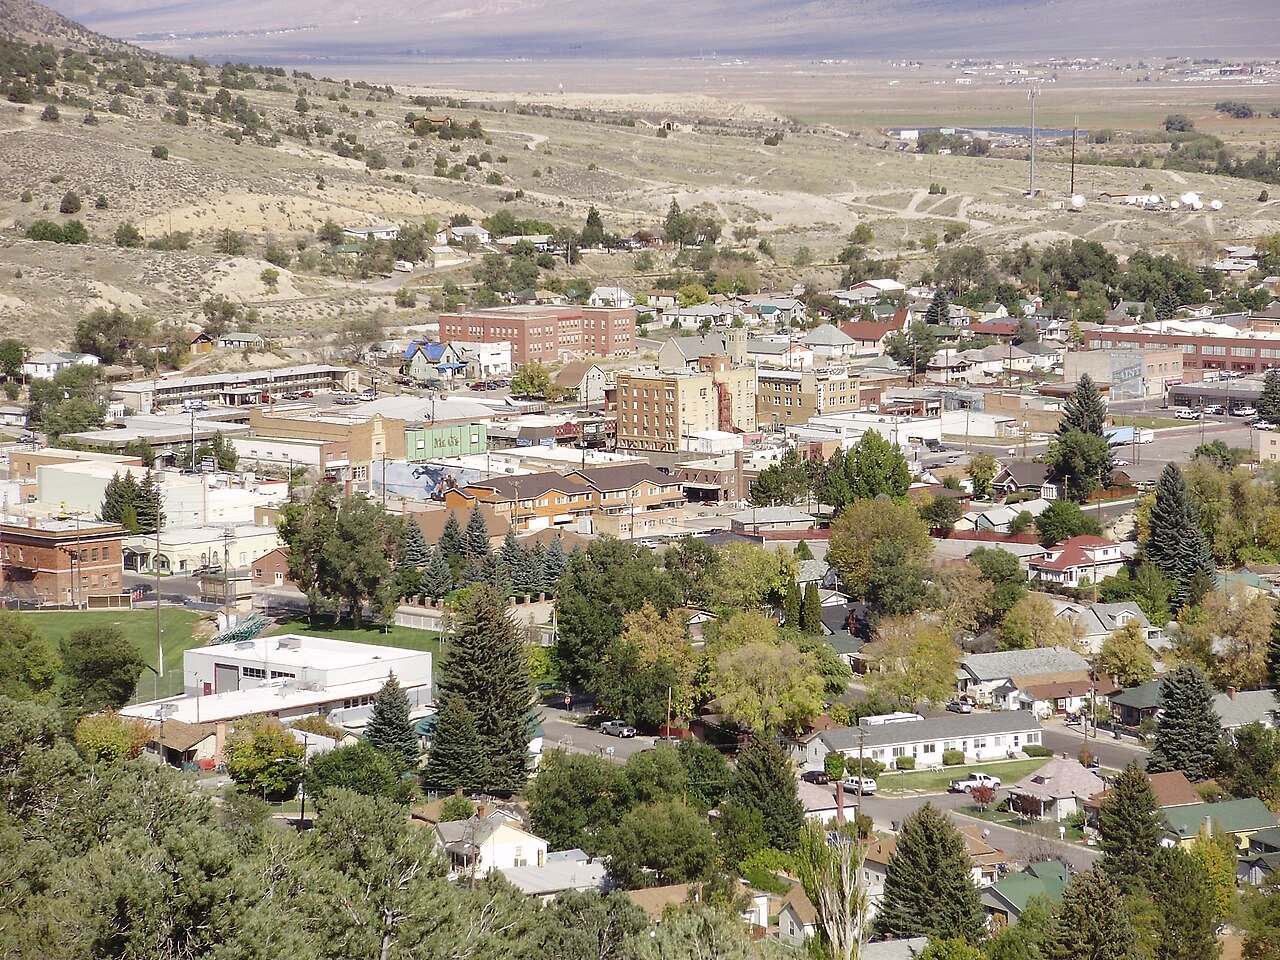
T22 Ely Ely3,929 people 22% 19–26% 3,929
T22 Sun Valley Sun Valley22,228 people 22% 19–25% 22,228
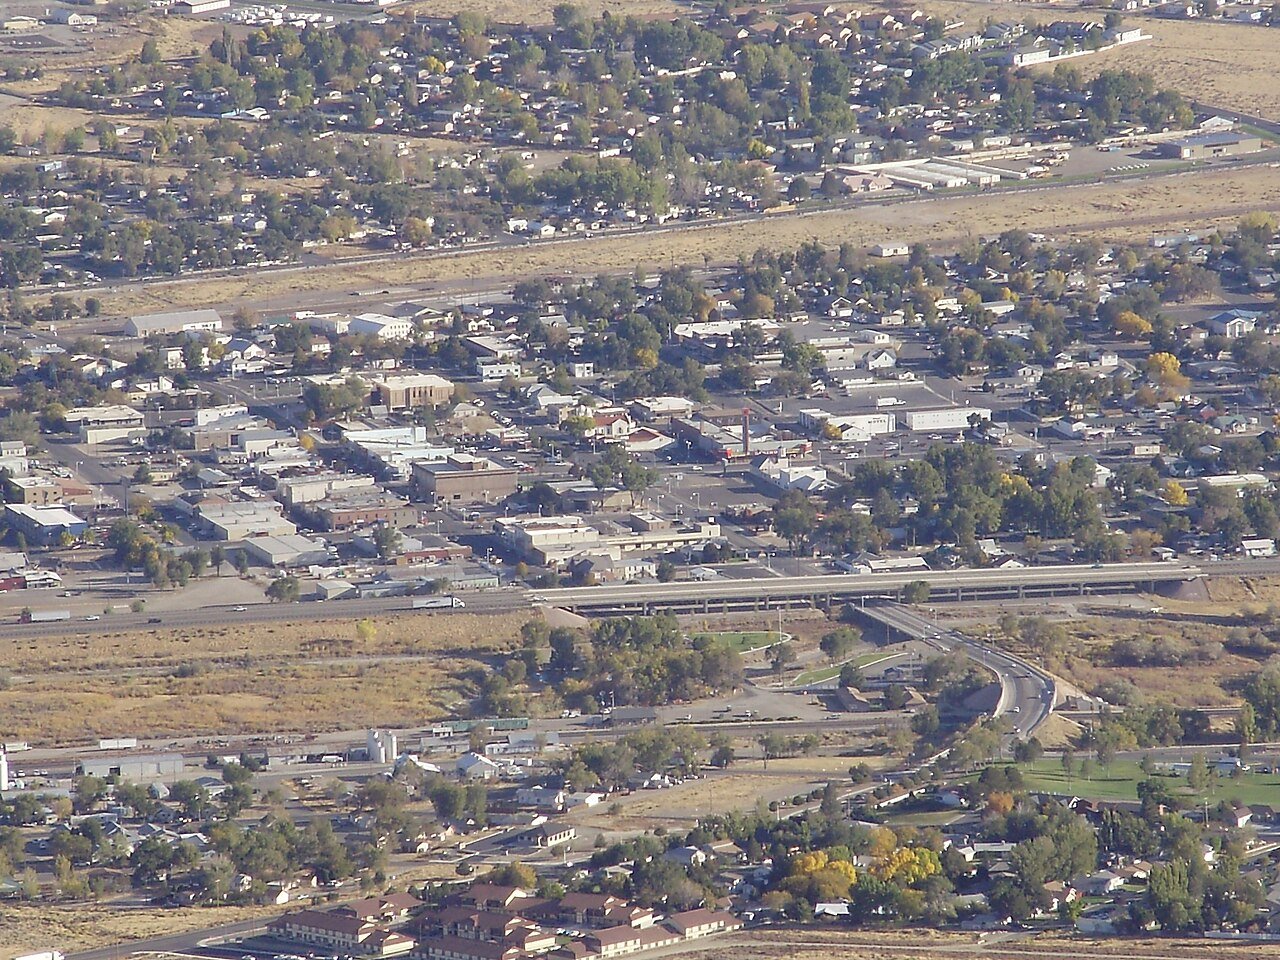
T22 Winnemucca Winnemucca8,361 people 22% 19–26% 8,361
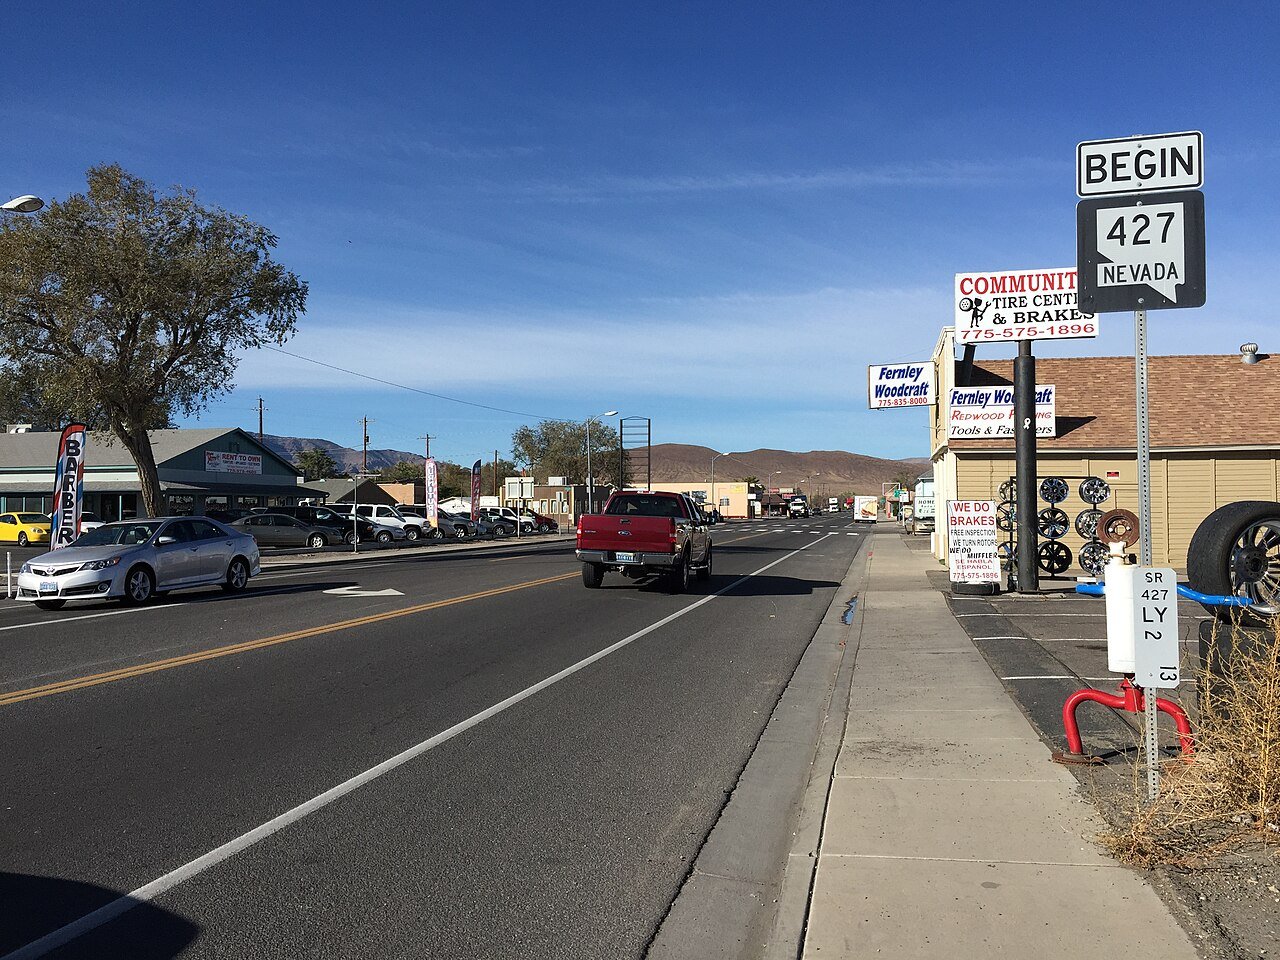
T33 Fernley Fernley24,225 people 23% 19–26% 24,225
T33 Yerington Yerington3,150 people 23% 19–26% 3,150
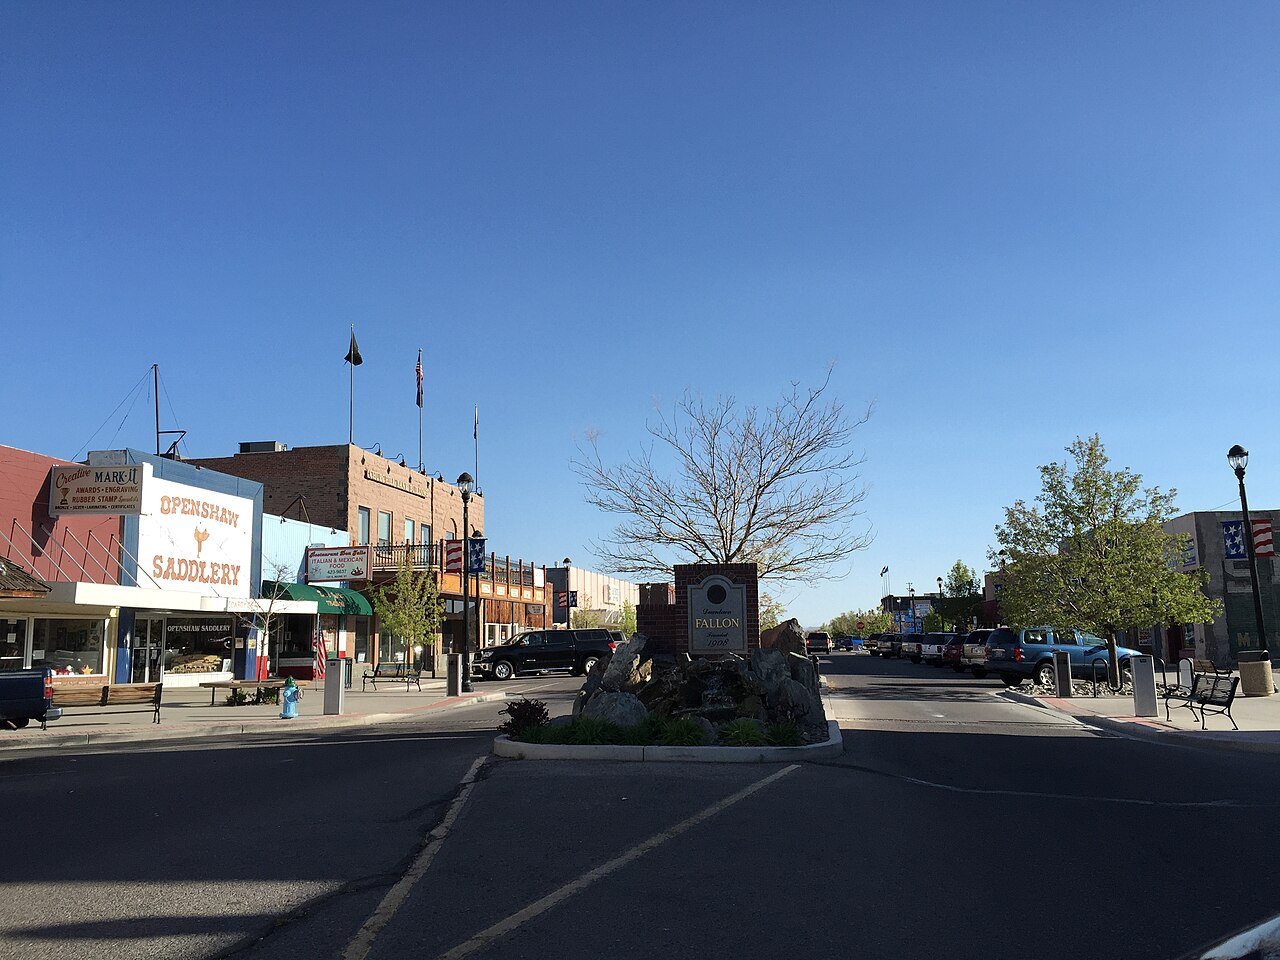
T33 Fallon Fallon9,463 people 23% 19–27% 9,463
T33 Cold Springs Cold Springs11,321 people 23% 20–26% 11,321
T33 Spring Creek Spring Creek14,739 people 23% 20–27% 14,739
T33 Silver Springs Silver Springs5,060 people 23% 20–27% 5,060
T33 Hawthorne Hawthorne2,809 people 23% 19–27% 2,809
T33 Map of Moapa Valley Moapa Valley6,684 people 23% 20–27% 6,684
41 Battle Mountain Battle Mountain3,518 people 24% 20–28% 3,518
42 Nellis AFB5,087 people 28% 25–32% 5,087

How this ranking works

We rank every town by the share of adults who have ever been told by a doctor that they have depression, as estimated by the CDC. The lowest share ranks #1. Across Nevada it’s 21%.

These are the CDC’s modeled estimates, not a count: national survey answers combined with each area’s age, sex, race and income mix. Each carries a likely range (shown in the table), so we rank on the whole percent and towns at the same figure share a rank (T = tied). Differences of a point or two are within the estimates’ margins.

Cities and villages use the CDC’s own estimate for that place. New England towns and townships, which the CDC doesn’t publish, use the ZIP codes that cover them, weighted by land area.

Only towns with at least 2,500 residents are ranked; Census estimates for smaller places are too uncertain. Population and income: U.S. Census Bureau American Community Survey 5-year estimates. Health estimates: CDC PLACES. Town photos: Wikimedia Commons, credited on each town’s page.

Same ranking in other states