KYKentucky rankings

Wettest towns in Kentucky

Ranked by rain and melted snow in a normal year, 1991–2020, from NOAA’s gridded climate normals for each town. Neighboring towns on the same 5 km grid square have the same numbers, so each square is listed once, under its largest town. 135 towns with 2,500+ residents.
NOAA U.S. Climate Normals, 1991–2020

#TownRain + melted snowWettest monthSnow a year
1 Russell Springs Russell Springs2,773 people 55 in July 5 in
2 Monticello Monticello5,753 people 54 in July 14 in
3 Murray Murray18,080 people 54 in May 7 in
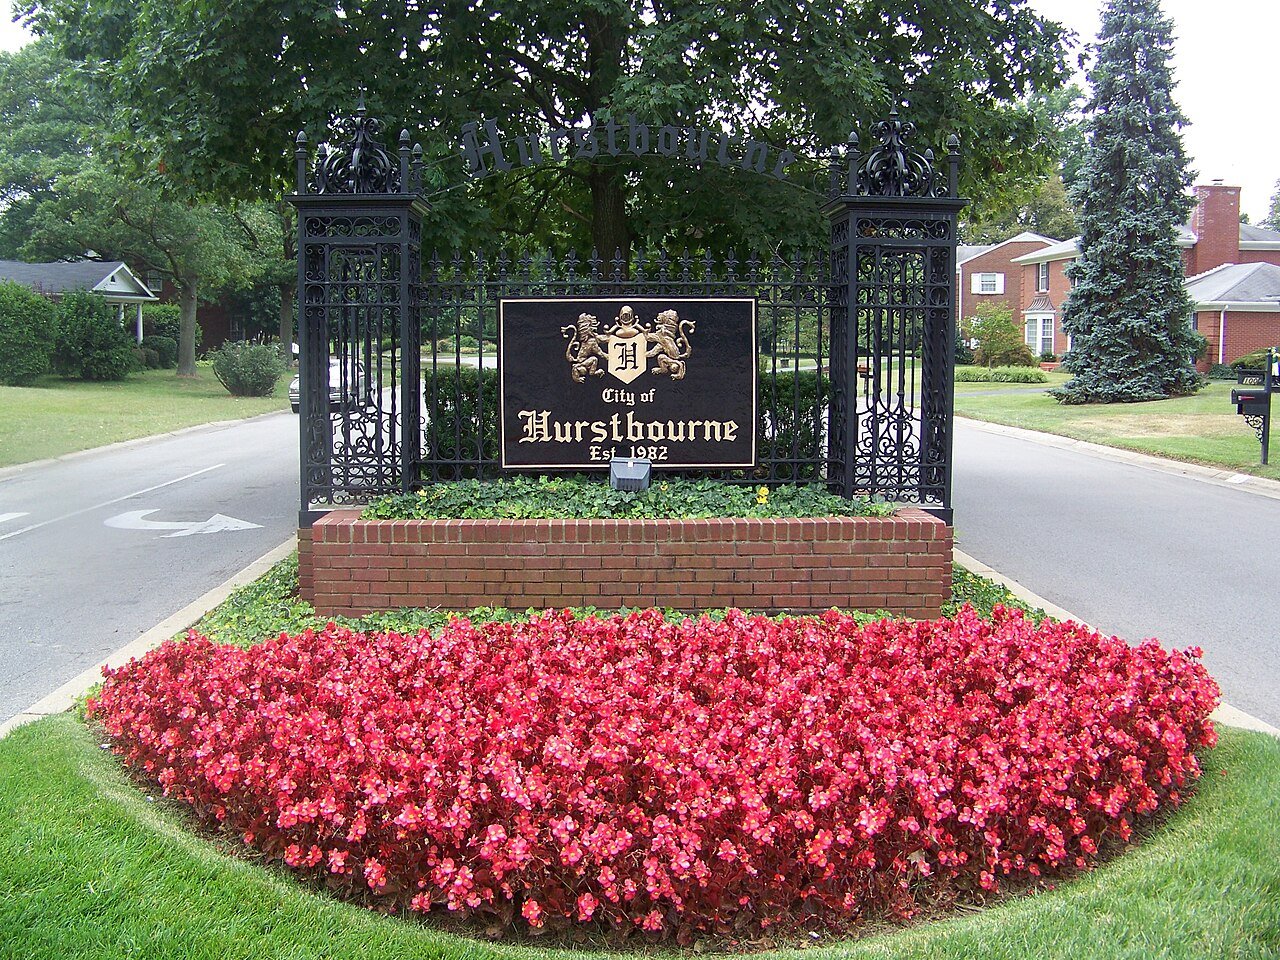
4 Cave City Cave City2,730 people 54 in May 6 in
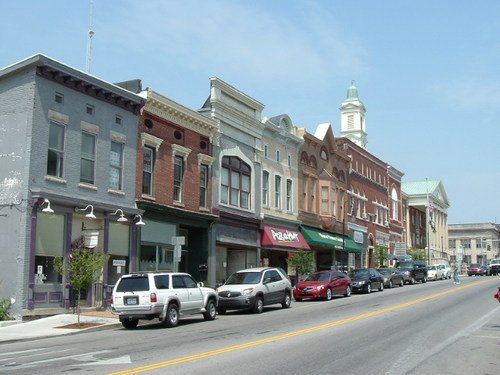
5 Tompkinsville Tompkinsville2,613 people 53 in March 6 in
6 Scottsville Scottsville4,427 people 53 in May 8 in
7 Glasgow Glasgow15,197 people 53 in May 6 in
8 London London7,561 people 53 in July 6 in
9 Corbin Corbin8,246 people 53 in July 11 in
10 Somerset Somerset12,216 people 53 in July 11 in
11 Fort Campbell North11,356 people 53 in May 0.5 in
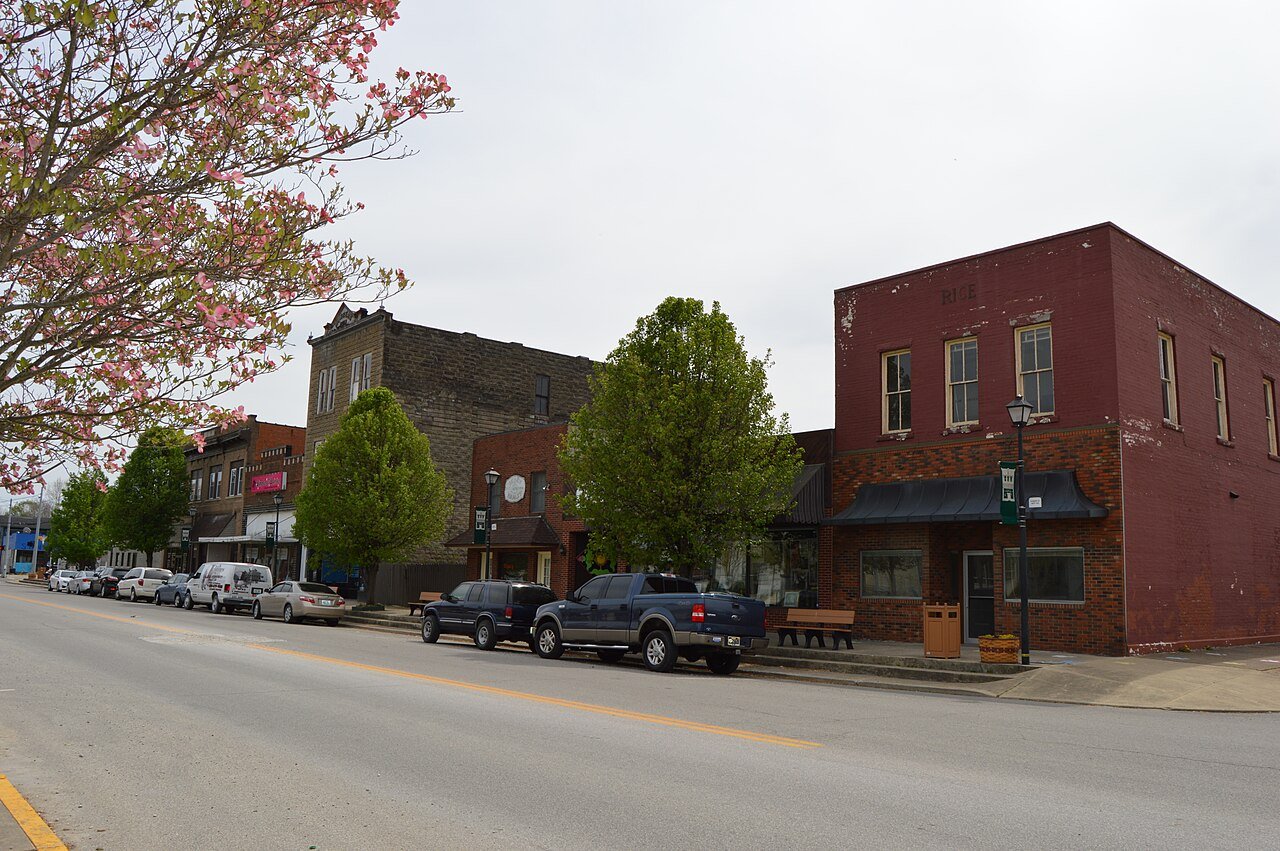
12 Oak Grove Oak Grove7,962 people 53 in May 0.5 in
13 Leitchfield Leitchfield6,819 people 53 in May 9 in
14 Barbourville Barbourville3,146 people 53 in July 11 in
15 Russellville Russellville7,316 people 52 in May —
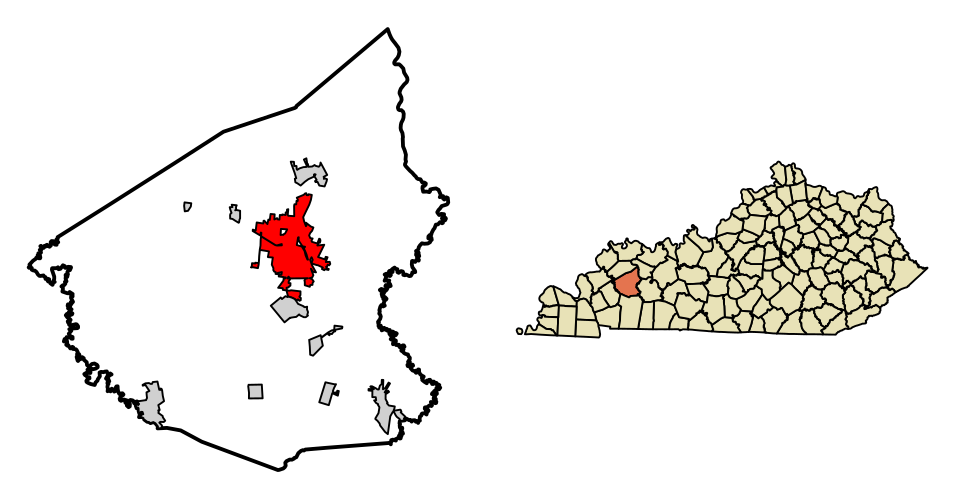
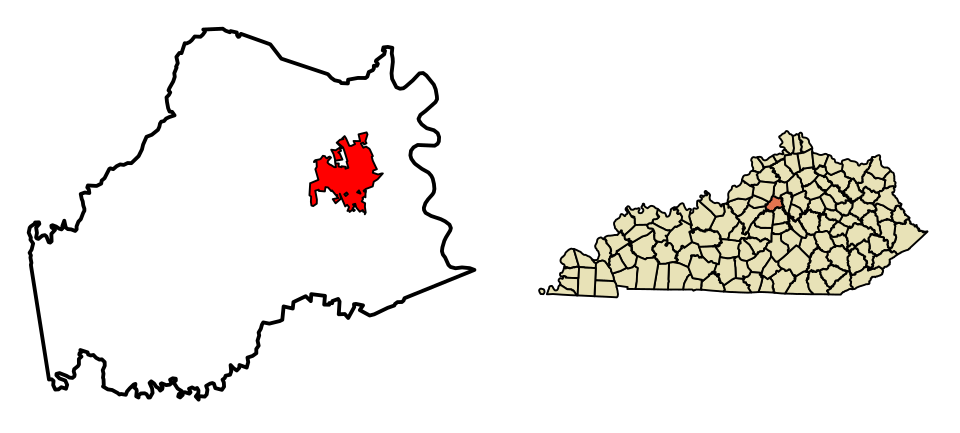
16 Map of Campbellsville Campbellsville11,622 people 52 in May 15 in
17 Mayfield Mayfield9,868 people 52 in May 1 in
18 Williamsburg Williamsburg5,270 people 52 in July 11 in
19 Columbia Columbia4,808 people 52 in July 5 in
20 Crestwood Crestwood6,356 people 52 in May 15 in
21 Hodgenville Hodgenville3,389 people 52 in May 0.1 in
22 Cadiz Cadiz2,677 people 52 in May 4 in
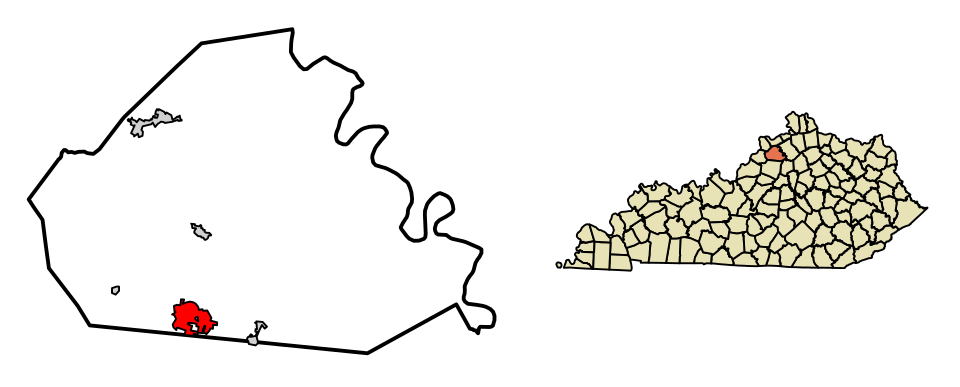
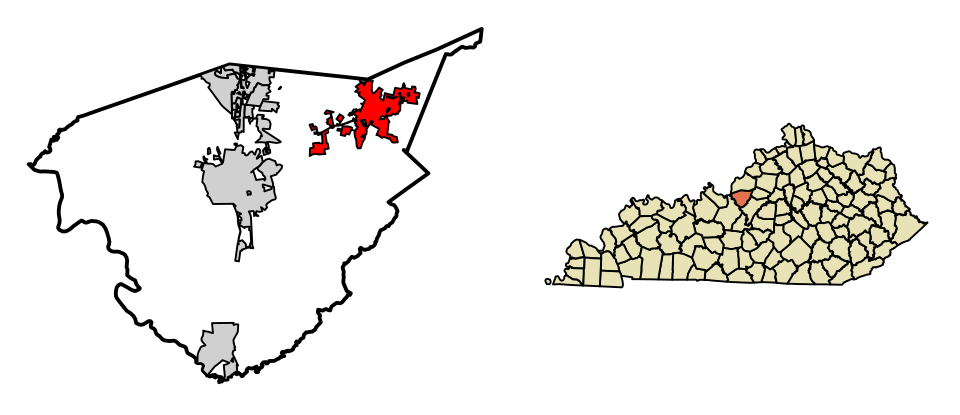
23 Map of Buckner Buckner4,119 people 52 in May 15 in
24 Hopkinsville Hopkinsville30,906 people 52 in May 5 in
25 La Grange La Grange10,311 people 52 in May 12 in
26 Middlesborough Middlesborough9,123 people 52 in December 8 in
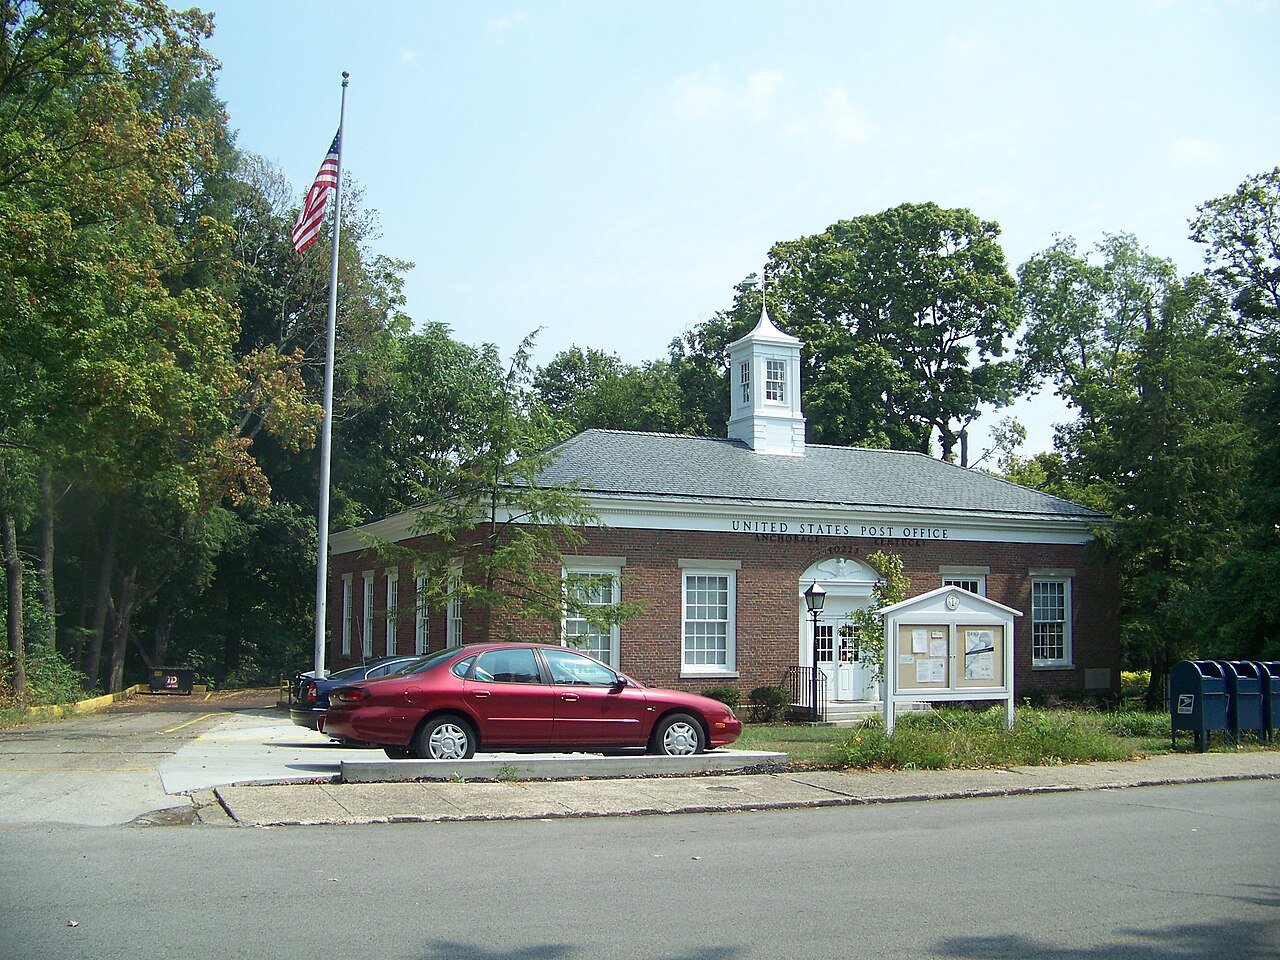
27 Anchorage Anchorage2,506 people 52 in May 15 in
28 Lebanon Lebanon6,430 people 52 in May 3 in
29 Simpsonville Simpsonville3,062 people 52 in May 15 in
30 Elizabethtown Elizabethtown32,576 people 51 in May 5 in
31 Map of Franklin Franklin10,360 people 51 in May 4 in
32 Middletown Middletown9,763 people 51 in May 15 in
33 Bowling Green Bowling Green75,388 people 51 in May 9 in
34 Map of Douglass Hills Douglass Hills5,474 people 51 in May 15 in
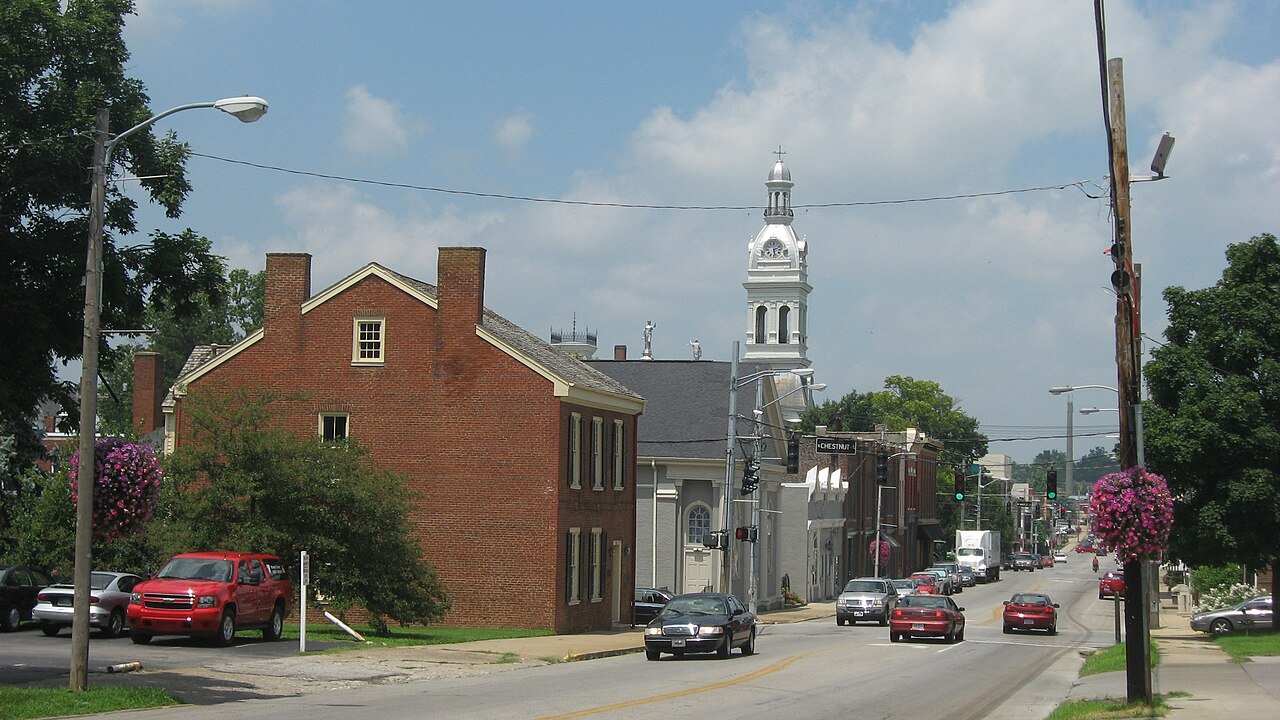
35 Bardstown Bardstown13,804 people 51 in May 12 in
36 Benton Benton4,748 people 51 in May 7 in
37 Springfield Springfield2,899 people 51 in May 3 in
38 Jeffersontown Jeffersontown29,199 people 51 in May 15 in
39 Shelbyville Shelbyville17,668 people 51 in May 15 in
40 Hurstbourne Hurstbourne4,702 people 51 in May 15 in
41 Versailles Versailles10,492 people 51 in May 15 in
42 Map of Massac Massac4,698 people 51 in April 9 in
43 Map of Eddyville Eddyville2,897 people 51 in May 9 in
44 Radcliff22,864 people 51 in May 3 in
45 Lyndon Lyndon11,030 people 51 in May 15 in
46 Map of Prospect Prospect4,542 people 51 in May 15 in
47 Map of Hendron Hendron4,495 people 51 in April 9 in
48 Beaver Dam Beaver Dam3,524 people 51 in May 4 in
49 Marion Marion2,886 people 51 in May 9 in
50 Map of Eminence Eminence2,724 people 51 in May —
51 Map of Madisonville Madisonville19,515 people 50 in May 4 in
52 Map of Lawrenceburg Lawrenceburg11,943 people 50 in May 15 in
53 Map of Vine Grove Vine Grove6,830 people 50 in May 5 in
54 Map of Mount Washington Mount Washington18,480 people 50 in May 4 in
55 Princeton Princeton6,241 people 50 in April 9 in
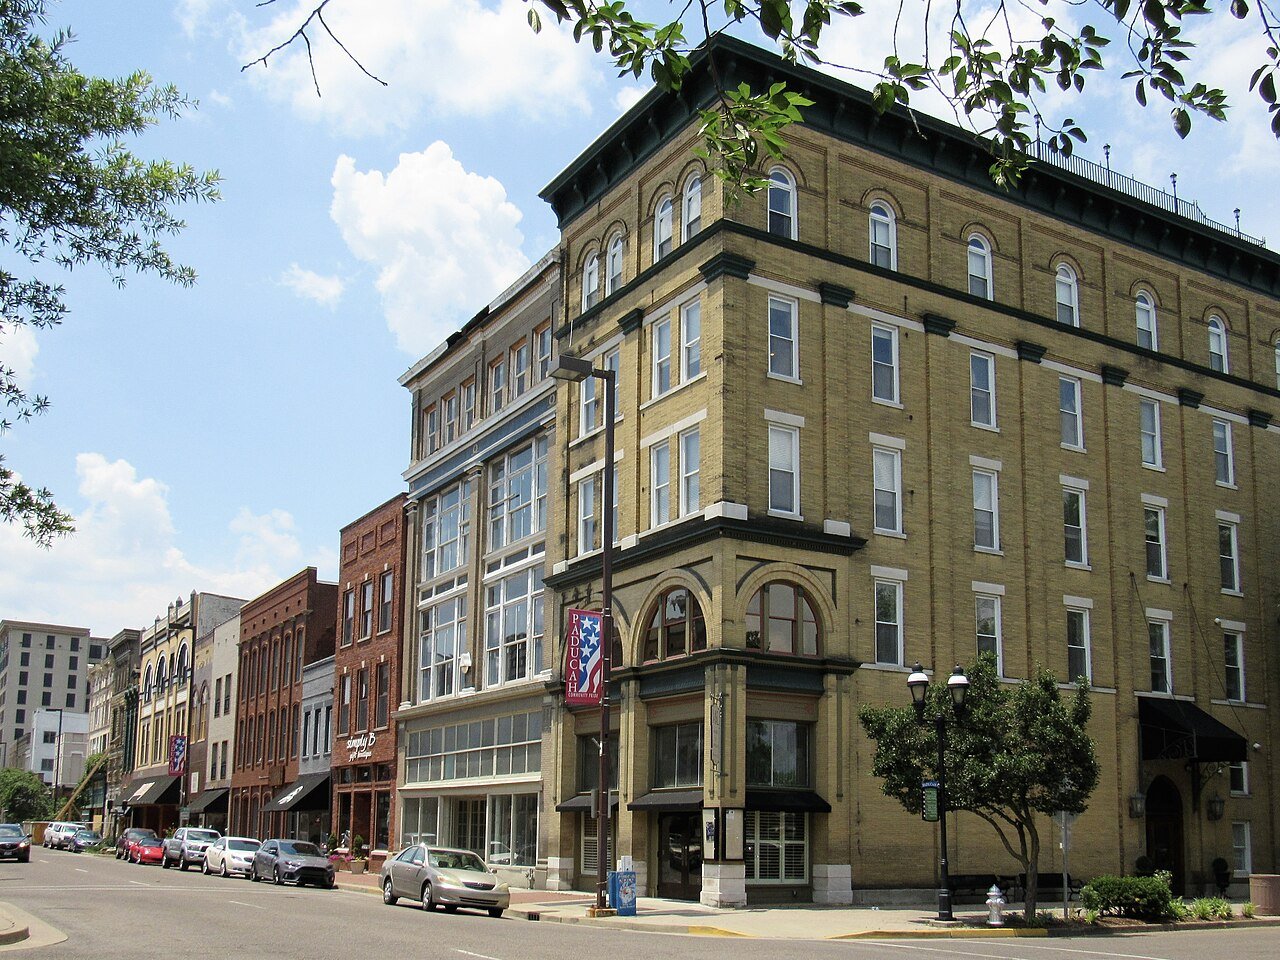
56 Paducah Paducah26,845 people 50 in April 9 in
57 Berea Berea15,786 people 50 in July 1 in
58 Farley4,458 people 50 in April 9 in
59 Louisville/Jefferson County metro government783,022 people 50 in May 15 in
60 Lexington-Fayette urban county323,725 people 50 in May 15 in
61 Nicholasville Nicholasville32,197 people 50 in May 10 in
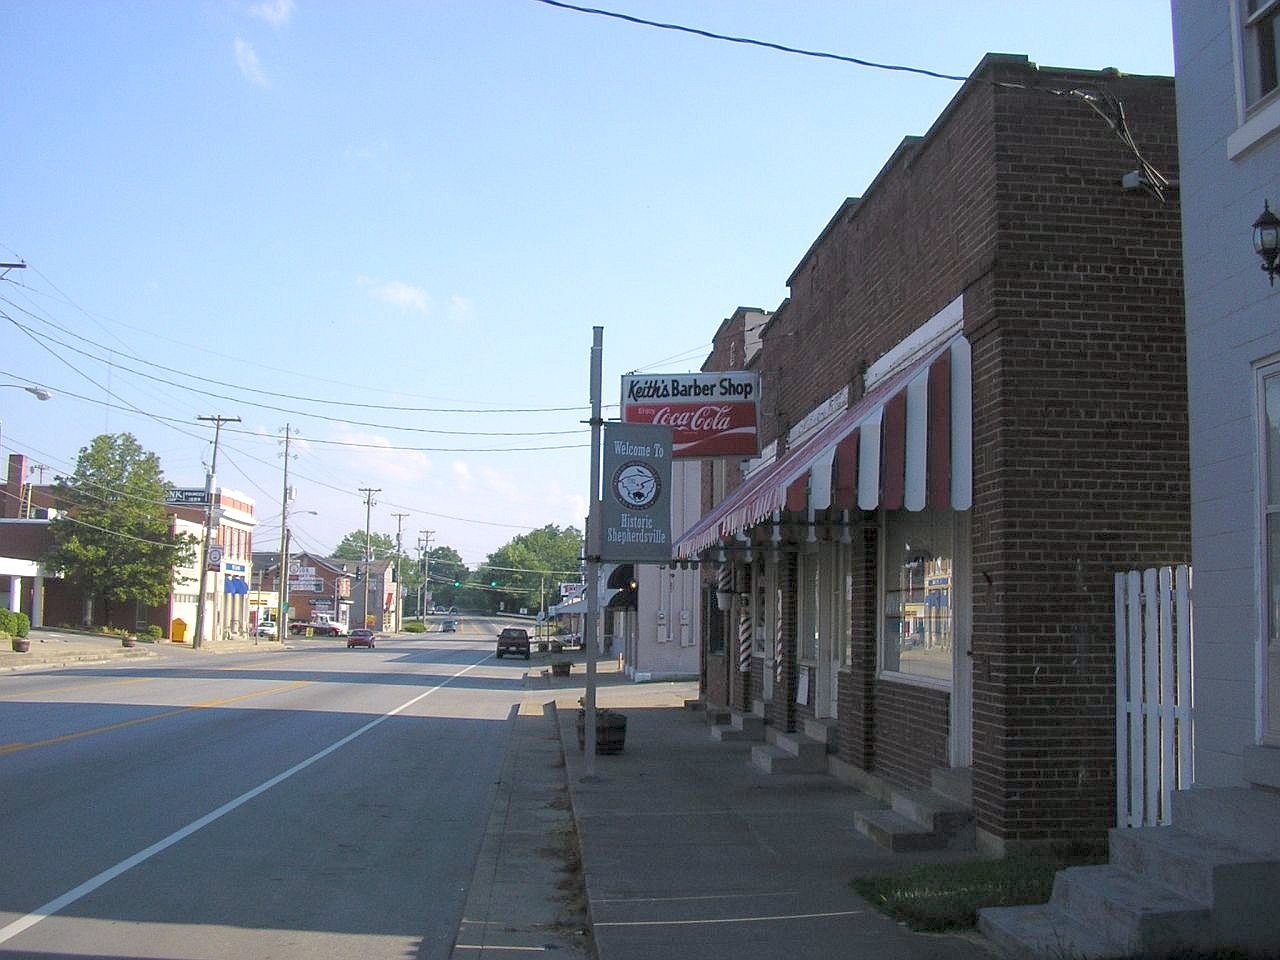
62 Shepherdsville Shepherdsville14,533 people 50 in May 4 in
63 Map of Reidland Reidland5,277 people 50 in April 9 in
64 Map of Greenville Greenville4,410 people 50 in May 4 in
65 Calvert City Calvert City2,526 people 50 in May 4 in
66 Richmond Richmond37,111 people 50 in July 1 in
67 Map of Fort Knox Fort Knox8,836 people 50 in May 5 in
68 Stanton Stanton3,218 people 50 in July 6 in
69 Hartford Hartford2,649 people 50 in May 4 in
70 St. Matthews St. Matthews17,577 people 50 in May 15 in
71 Wilmore Wilmore6,057 people 50 in May 10 in
72 Harrodsburg Harrodsburg9,313 people 50 in May 15 in
73 Map of Hillview Hillview8,797 people 50 in May 15 in
74 Providence Providence2,857 people 50 in April 9 in
75 Irvine Irvine2,723 people 50 in July 6 in
76 Georgetown Georgetown39,117 people 50 in May 15 in
77 Winchester Winchester19,213 people 50 in July 9 in
78 Mount Sterling Mount Sterling7,551 people 50 in July 9 in
79 Morehead Morehead6,870 people 50 in July 7 in
80 Map of Stanford Stanford3,643 people 50 in May 7 in
81 Brandenburg Brandenburg2,937 people 50 in May —
82 Frankfort Frankfort28,503 people 49 in May 15 in
83 Hazard Hazard5,008 people 49 in July 9 in
84 Map of Indian Hills Indian Hills2,897 people 49 in May 4 in
85 Lancaster Lancaster4,013 people 49 in May 7 in
86 Paris Paris10,160 people 49 in May 15 in
87 Junction City Junction City2,643 people 49 in May 7 in
88 Map of Shively Shively15,638 people 49 in May 13 in
89 Central City Central City5,707 people 49 in May 4 in
90 Flemingsburg Flemingsburg2,965 people 49 in July 9 in
91 Thruston2,581 people 49 in May 6 in
92 Danville Danville17,327 people 49 in May 7 in
93 Map of Masonville Masonville2,887 people 49 in May 6 in
94 Owensboro Owensboro60,302 people 48 in May 6 in
95 Cynthiana Cynthiana6,458 people 48 in May 16 in
96 Carrollton Carrollton3,915 people 48 in May 21 in
97 Sorgho2,960 people 48 in May 6 in
98 West Liberty West Liberty3,295 people 48 in July 12 in
99 Henderson Henderson27,852 people 48 in April 12 in
100 Maysville Maysville8,737 people 48 in July 9 in
101 Morganfield Morganfield3,185 people 47 in May 8 in
102 Pikeville Pikeville7,490 people 47 in July 1 in
103 Prestonsburg Prestonsburg3,765 people 47 in July 4 in
104 Williamstown Williamstown3,945 people 47 in May 16 in
105 Paintsville Paintsville4,203 people 47 in July 17 in
106 Louisa Louisa2,580 people 47 in July 20 in
107 Map of Elsmere Elsmere9,205 people 47 in June 23 in
108 Union Union7,642 people 47 in June 23 in
109 Walton Walton5,730 people 47 in May 23 in
110 Florence Florence32,803 people 47 in June 23 in
111 Erlanger Erlanger19,875 people 47 in June 23 in
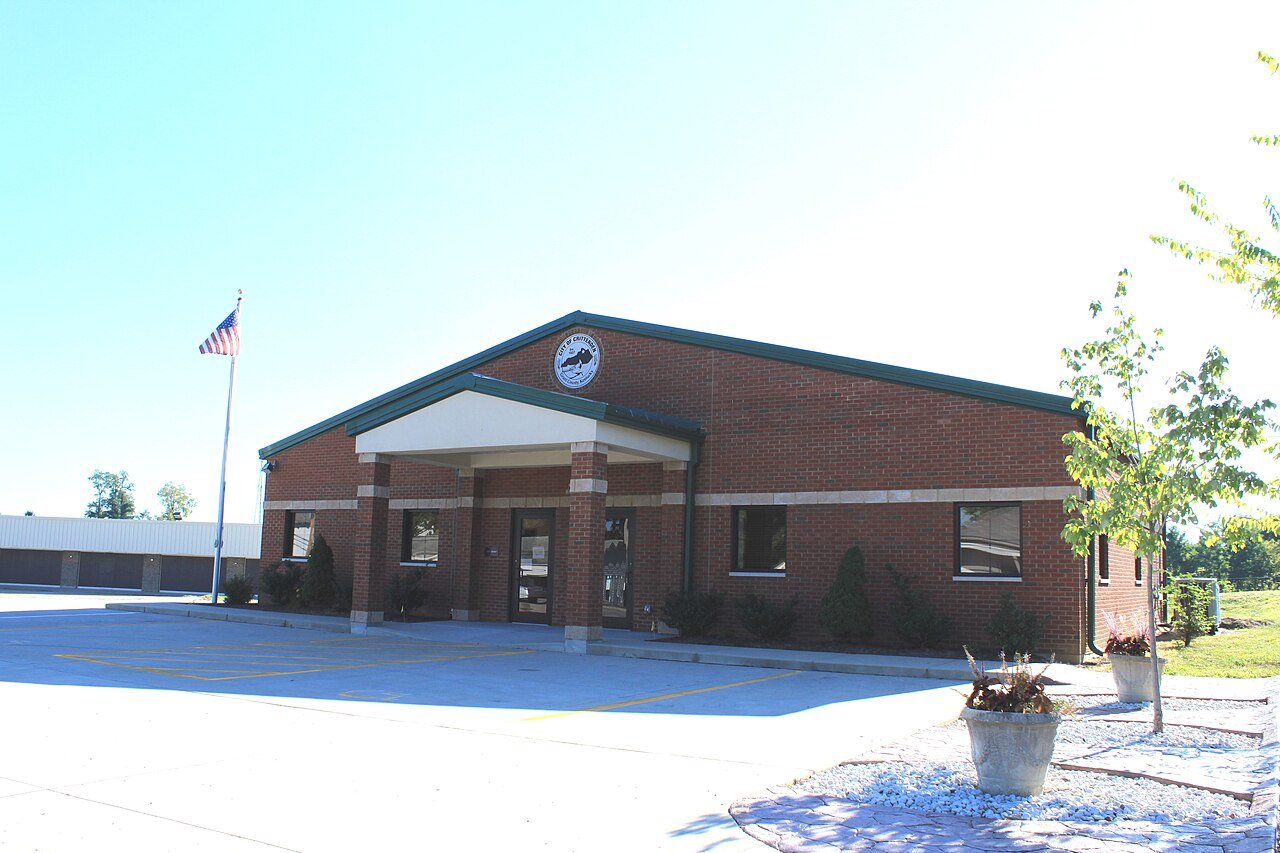
112 Crittenden Crittenden4,084 people 47 in May 23 in
113 Map of Oakbrook Oakbrook10,211 people 46 in June 23 in
114 Independence Independence29,392 people 46 in June 23 in
115 Burlington Burlington18,008 people 46 in June 23 in
116 Hebron Hebron6,407 people 46 in June 23 in
117 Map of Edgewood Edgewood8,447 people 46 in May 23 in
118 Map of Villa Hills Villa Hills7,480 people 46 in May 23 in
119 Fort Mitchell Fort Mitchell8,713 people 46 in May 23 in
120 Covington Covington41,110 people 45 in May 23 in
121 Map of Francisville Francisville10,565 people 45 in May 23 in
122 Map of Claryville Claryville3,251 people 45 in May 23 in
123 Alexandria Alexandria10,562 people 45 in May 23 in
124 Highland Heights Highland Heights6,444 people 45 in May 23 in
125 Map of Ludlow Ludlow4,378 people 45 in May 23 in
126 Map of Taylor Mill Taylor Mill6,937 people 45 in May 23 in
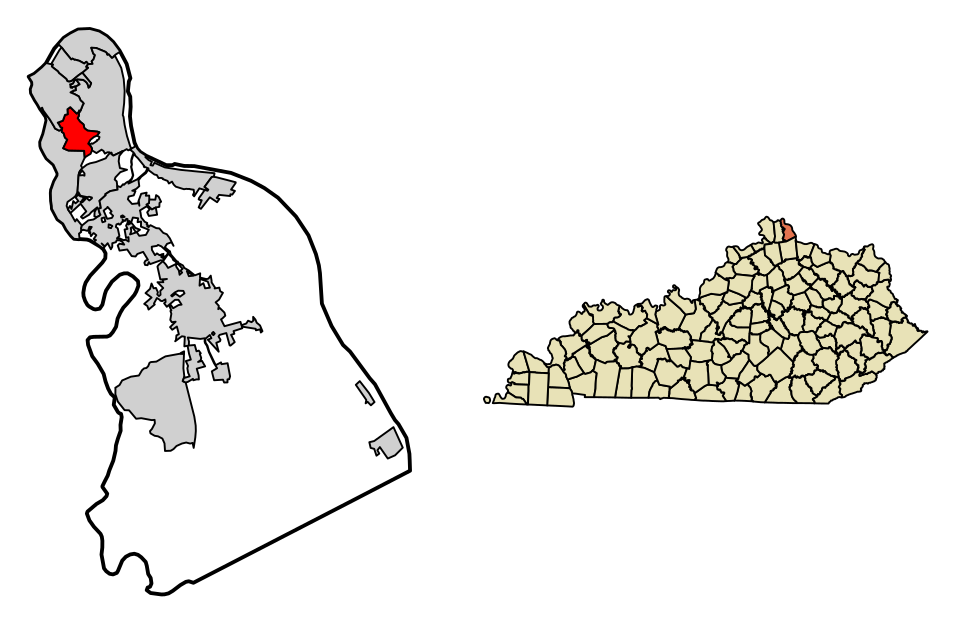
127 Newport Newport13,967 people 45 in May 23 in
128 Map of Southgate Southgate3,717 people 45 in May 23 in
129 Ashland Ashland21,295 people 45 in July 6 in
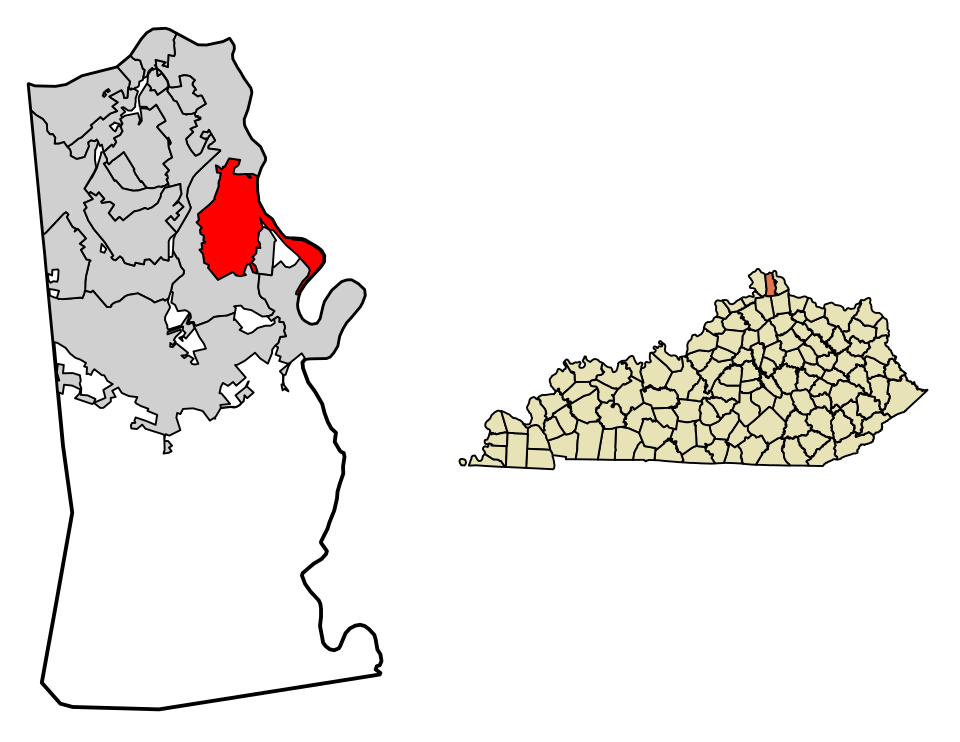
130 Fort Thomas Fort Thomas17,169 people 45 in May 23 in
131 Map of Fort Wright Fort Wright5,887 people 45 in May 23 in
132 Westwood4,473 people 44 in July 6 in
133 Grayson Grayson3,778 people 44 in July 18 in
134 Map of Russell Russell3,676 people 44 in July 6 in
135 Flatwoods Flatwoods7,269 people 44 in July 7 in

How this ranking works

We rank every town by rain and melted snow in a normal year, 1991–2020, from NOAA’s gridded climate normals for each town. The town with the highest figure ranks #1. Normals are 30-year averages, not a forecast, and each town’s Climate page shows its whole year month by month.

Temperatures and rainfall come from NOAA’s gridded normals, about 5 km (3 miles) square, read at each town’s center, so hills and coastlines are built in. Towns whose centers fall in the same square have the same numbers, so only the largest of them is listed.

Only towns with at least 2,500 residents are ranked; Census estimates for smaller places are too uncertain. Population and income: U.S. Census Bureau American Community Survey 5-year estimates. Climate: NOAA NCEI U.S. Climate Normals, 1991–2020. Town photos: Wikimedia Commons, credited on each town’s page.

Same ranking in other states