NVNevada rankings

Snowiest towns in Nevada

Ranked by average snowfall in a normal winter, 1991–2020, at the nearest NOAA weather station. Towns that share a station share its figure and its rank (T = tied). 25 towns with 2,500+ residents that get at least an inch of snow a year.
NOAA U.S. Climate Normals, 1991–2020

#TownSnow a yearDays with 1"+ of snowWeather station
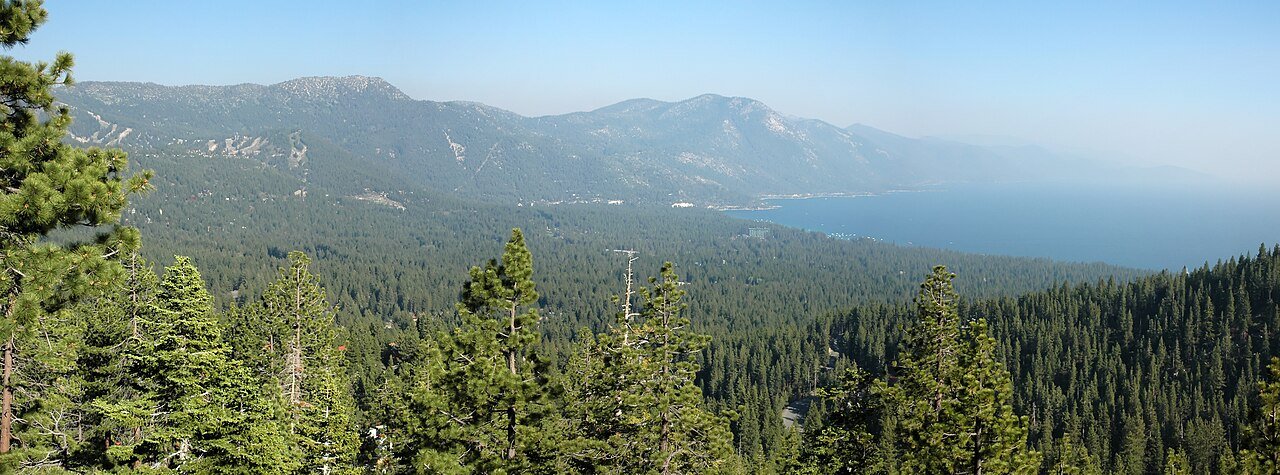
1 Incline Village Incline Village9,272 people 179 in 33 Tahoe City, CA
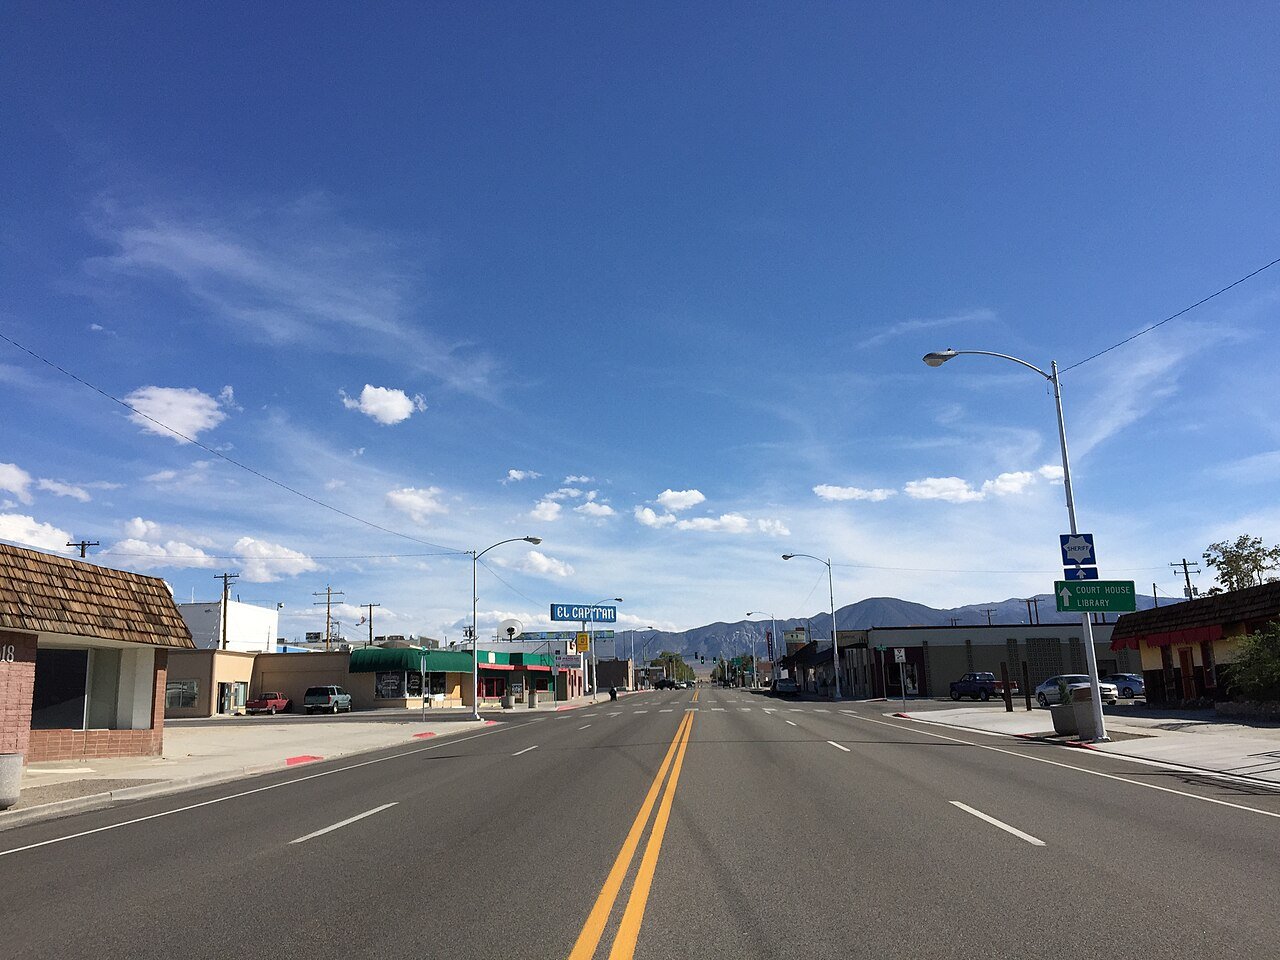
2 Ely Ely3,929 people 54 in 16 Ely Yelland Fld Airport, NV
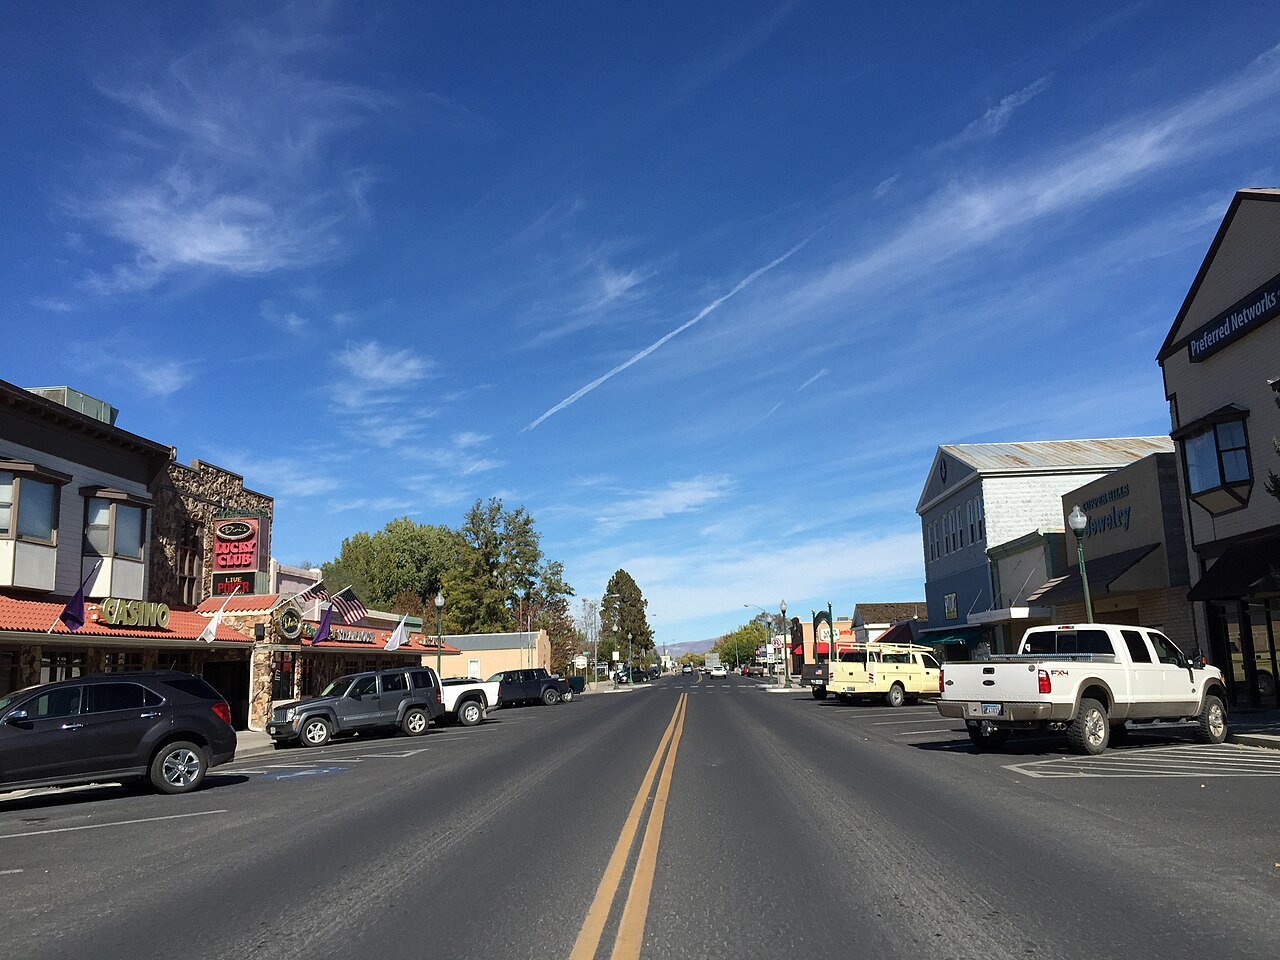
T3 Elko Elko20,696 people 41 in 14 Elko Rgnl Airport, NV
T3 Spring Creek Spring Creek14,739 people 41 in 14 Elko Rgnl Airport, NV
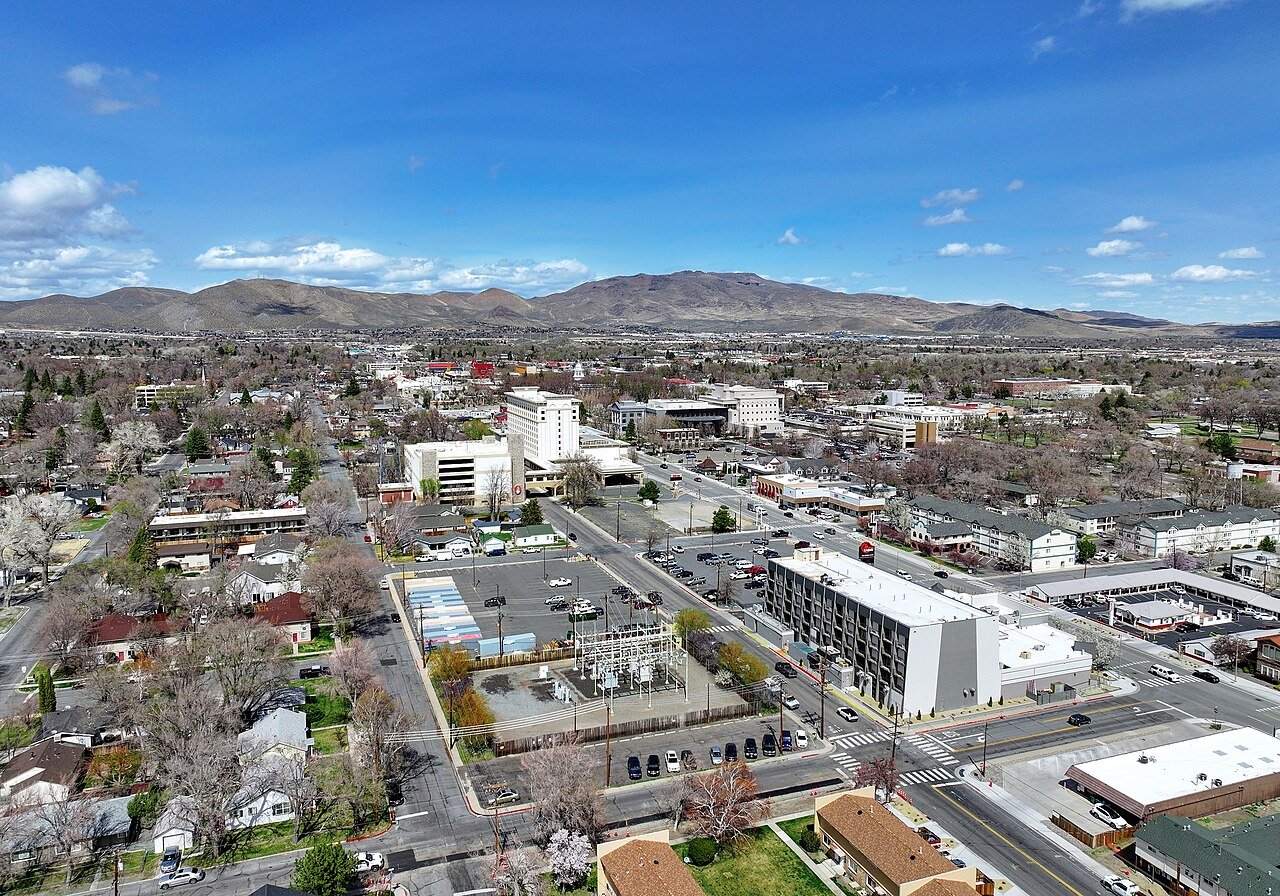
T5 Reno Reno273,212 people 33 in 10 Reno 1.4 Nne, NV
T5 Sun Valley Sun Valley22,228 people 33 in 10 Reno 1.4 Nne, NV
T7 Map of Gardnerville Ranchos Gardnerville Ranchos12,114 people 22 in 8 Minden, NV
T7 Gardnerville Gardnerville5,486 people 22 in 8 Minden, NV
T7 Minden Minden3,707 people 22 in 8 Minden, NV
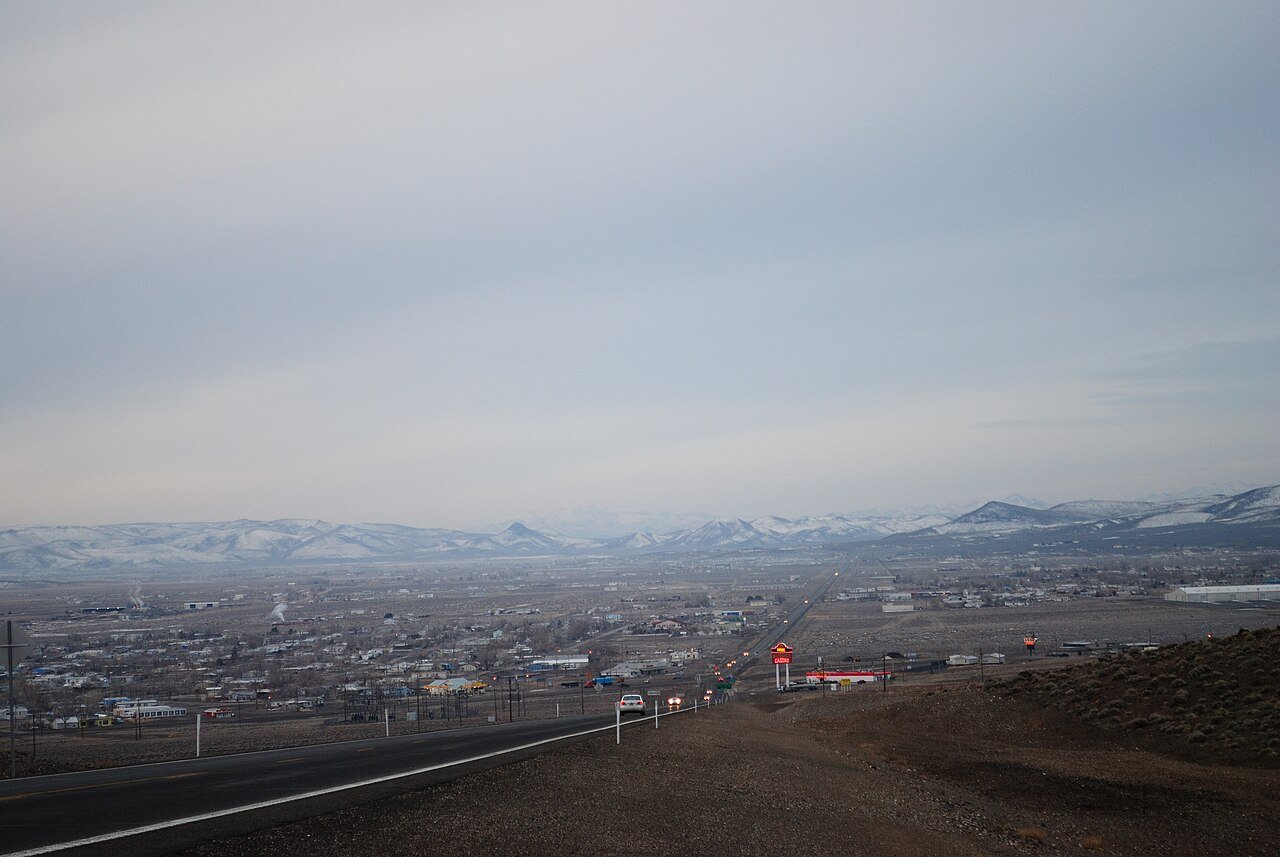
10 Winnemucca Winnemucca8,361 people 22 in 8 Winnemucca 3ssw, NV
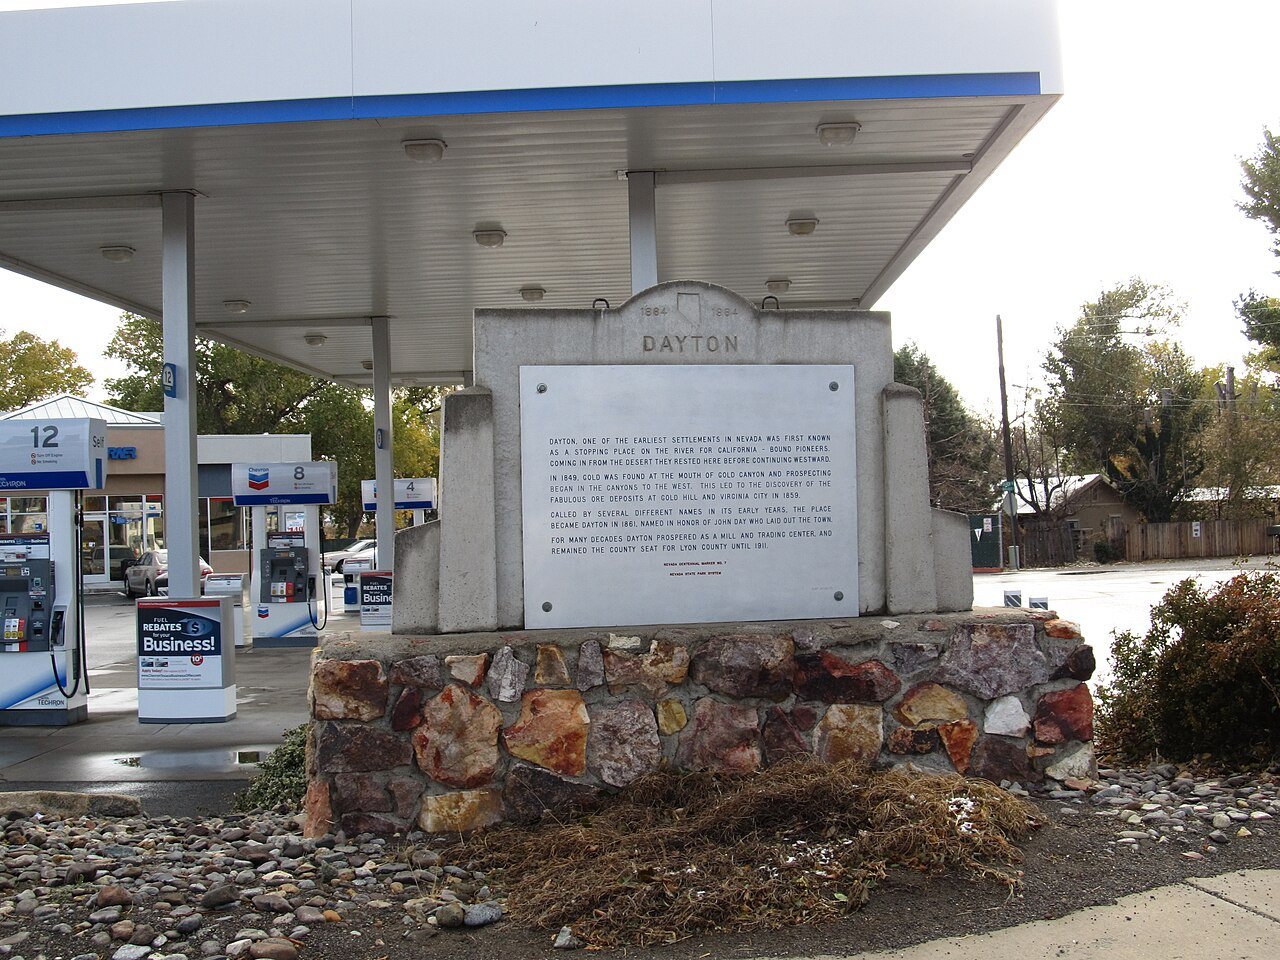
11 Dayton Dayton15,781 people 21 in 6 Reno Tahoe Intl Airport, NV
12 Battle Mountain Battle Mountain3,518 people 21 in 7 Battle Mountain 4se, NV
T13 Cold Springs Cold Springs11,321 people 17 in 6 Stead, NV
T13 Lemmon Valley4,412 people 17 in 6 Stead, NV
T15 Carson Carson58,384 people 14 in 5 Carson City, NV
T15 Map of Johnson Lane Johnson Lane6,467 people 14 in 5 Carson City, NV
T15 Map of Indian Hills Indian Hills5,527 people 14 in 5 Carson City, NV
T15 Washoe Valley Washoe Valley3,315 people 14 in 5 Carson City, NV
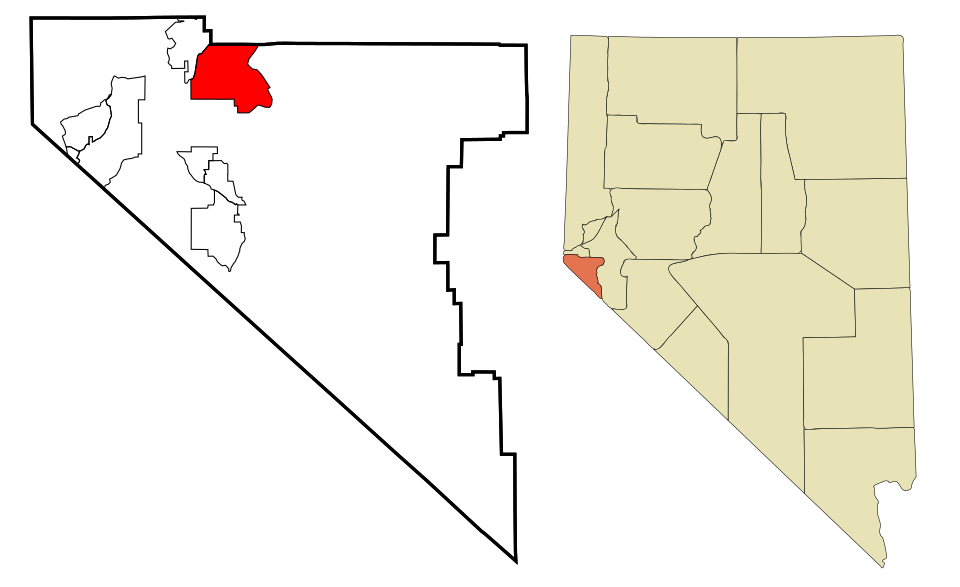
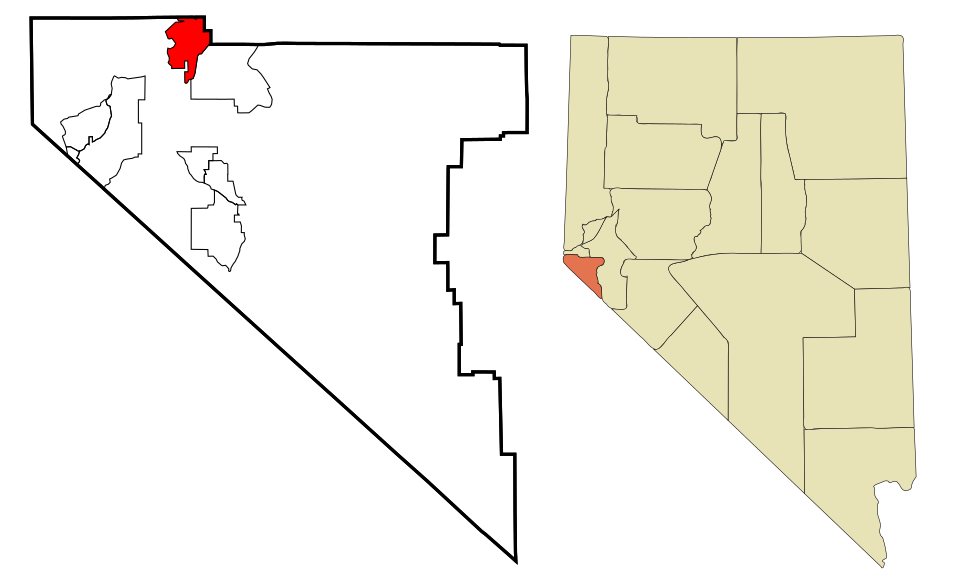
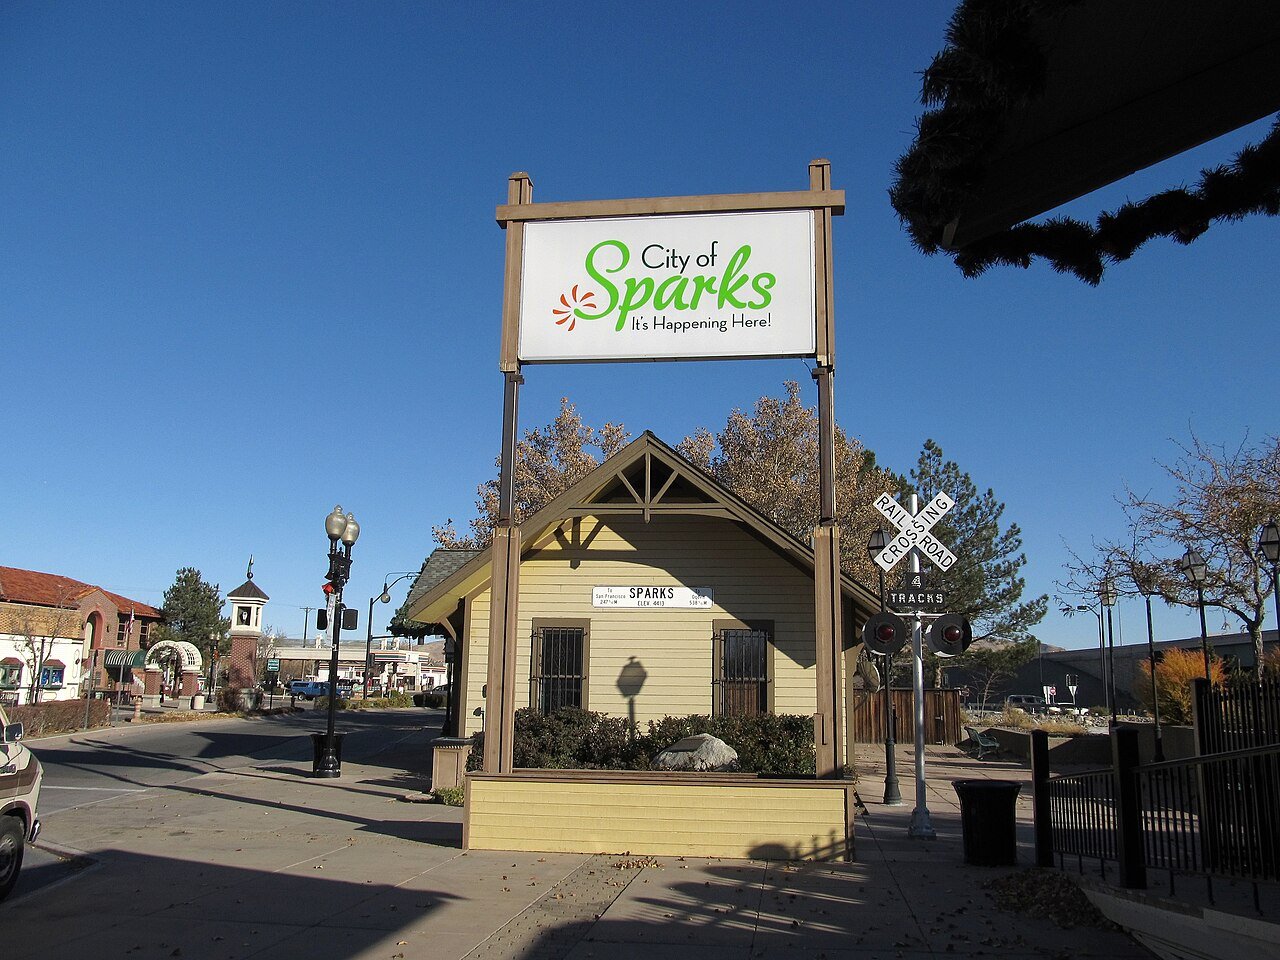
T19 Sparks Sparks110,024 people 6.8 in 3 Sparks, NV
T19 Spanish Springs Spanish Springs17,980 people 6.8 in 3 Sparks, NV
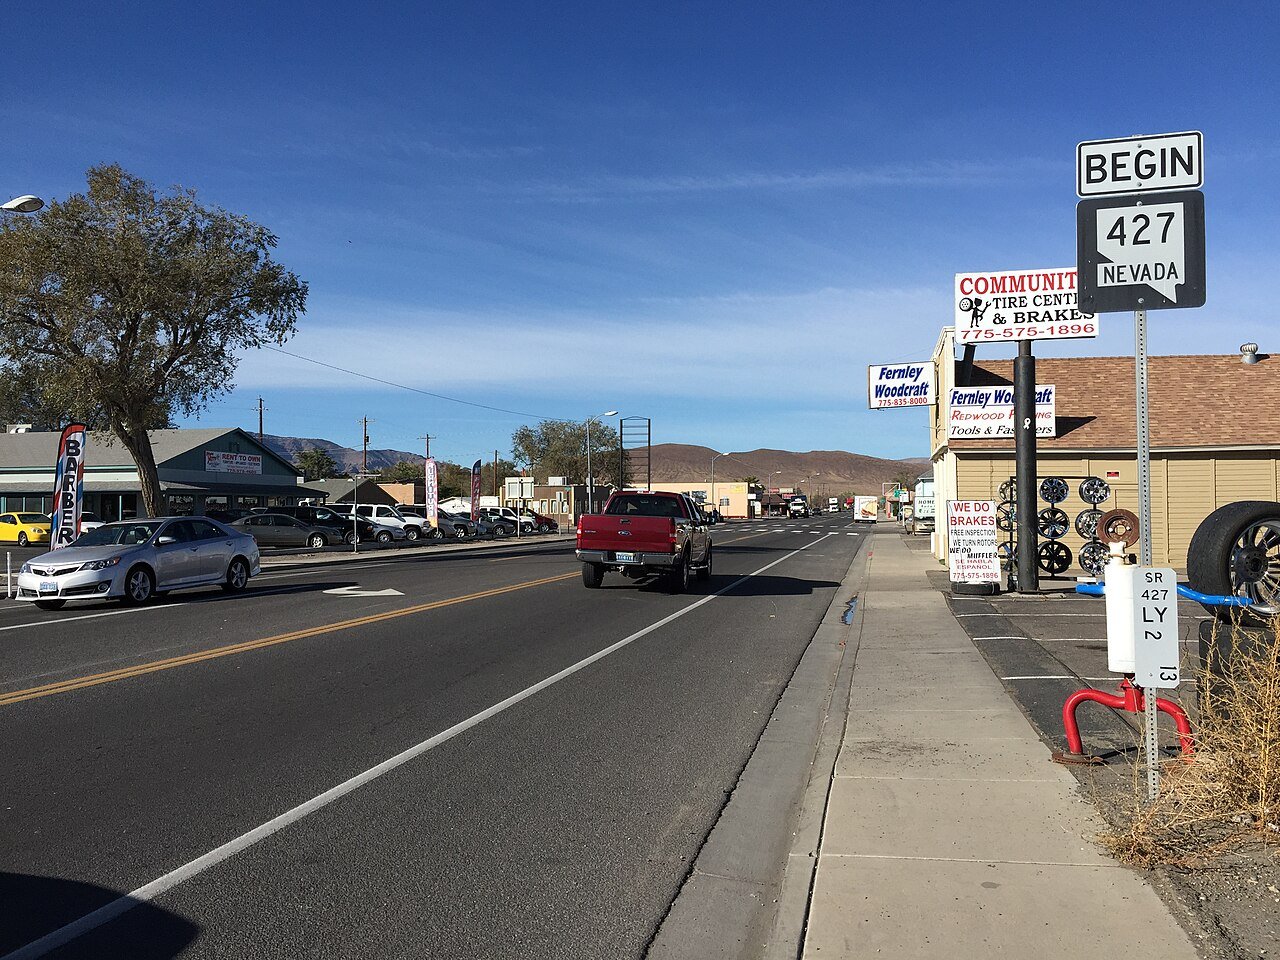
T21 Fernley Fernley24,225 people 4.5 in 2 Fallon Exp Stn, NV
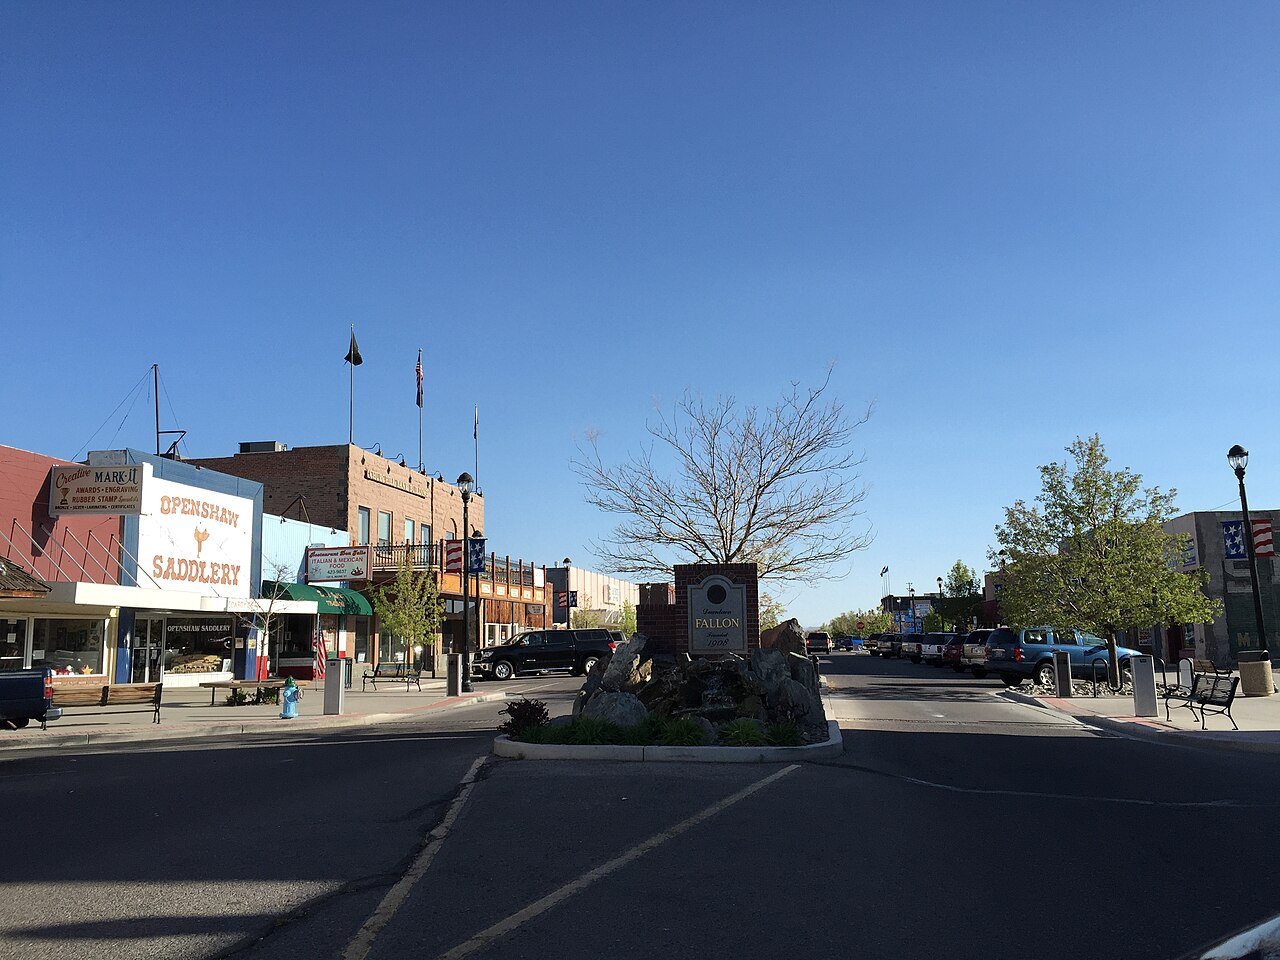
T21 Fallon Fallon9,463 people 4.5 in 2 Fallon Exp Stn, NV
T21 Silver Springs Silver Springs5,060 people 4.5 in 2 Fallon Exp Stn, NV
24 Yerington Yerington3,150 people 3.2 in 1 Yerington, NV
25 Hawthorne Hawthorne2,809 people 1.2 in 0 Hawthorne, NV

How this ranking works

We rank every town by average snowfall in a normal winter, 1991–2020, at the nearest NOAA weather station. Towns that get less than an inch a year aren’t ranked. The town with the highest figure ranks #1. Normals are 30-year averages, not a forecast, and each town’s Climate page shows its whole year month by month.

Snow and frost are measured at weather stations, and each town uses the nearest NOAA station with a matching climate (within 25 miles, with temperatures that agree with the town’s own). Towns near the same station share its figure, so they tie.

Only towns with at least 2,500 residents are ranked; Census estimates for smaller places are too uncertain. Population and income: U.S. Census Bureau American Community Survey 5-year estimates. Climate: NOAA NCEI U.S. Climate Normals, 1991–2020. Town photos: Wikimedia Commons, credited on each town’s page.

Same ranking in other states