MTMontana rankings

Wettest towns in Montana

Ranked by rain and melted snow in a normal year, 1991–2020, from NOAA’s gridded climate normals for each town. Neighboring towns on the same 5 km grid square have the same numbers, so each square is listed once, under its largest town. 43 towns with 2,500+ residents.
NOAA U.S. Climate Normals, 1991–2020

#TownRain + melted snowWettest monthSnow a year
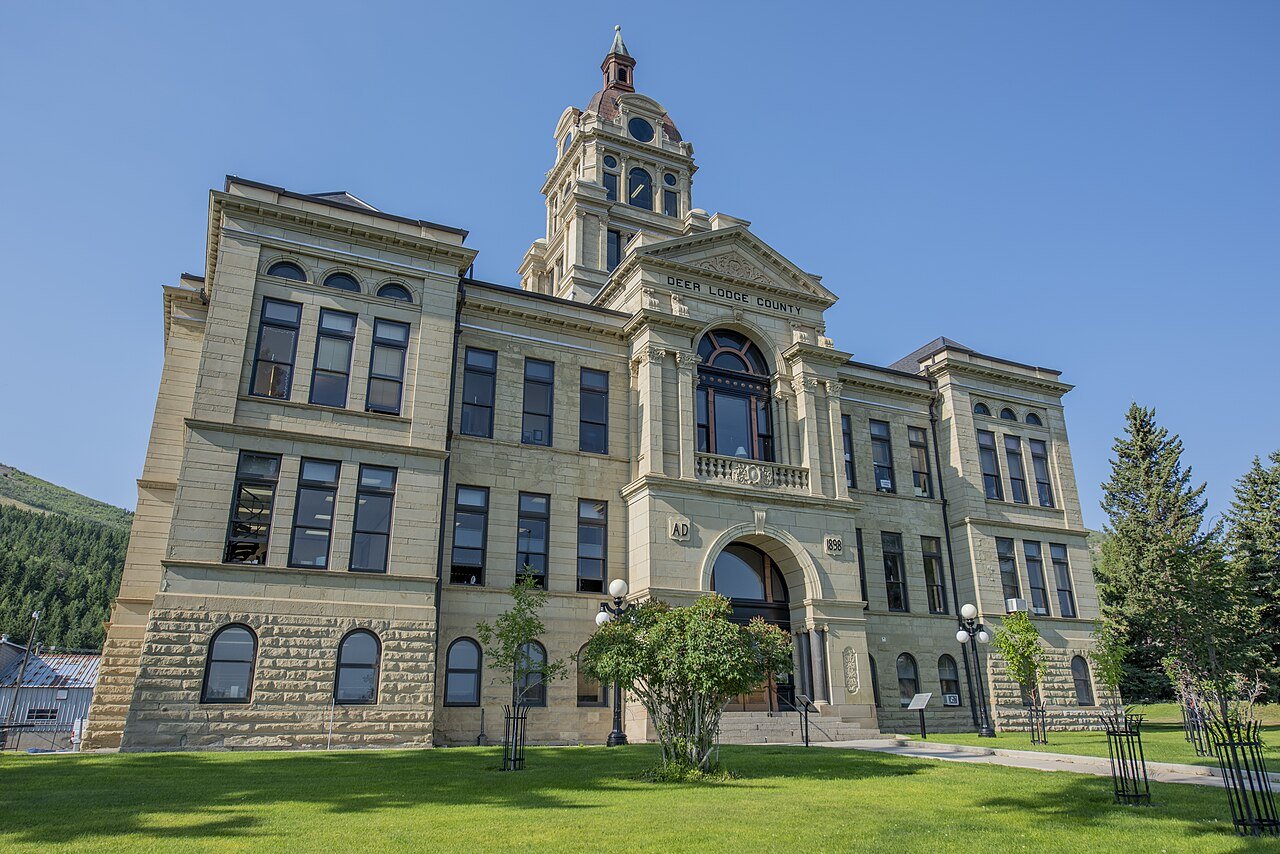
1 Anaconda-Deer Lodge County Anaconda-Deer Lodge County9,597 people 35 in May —
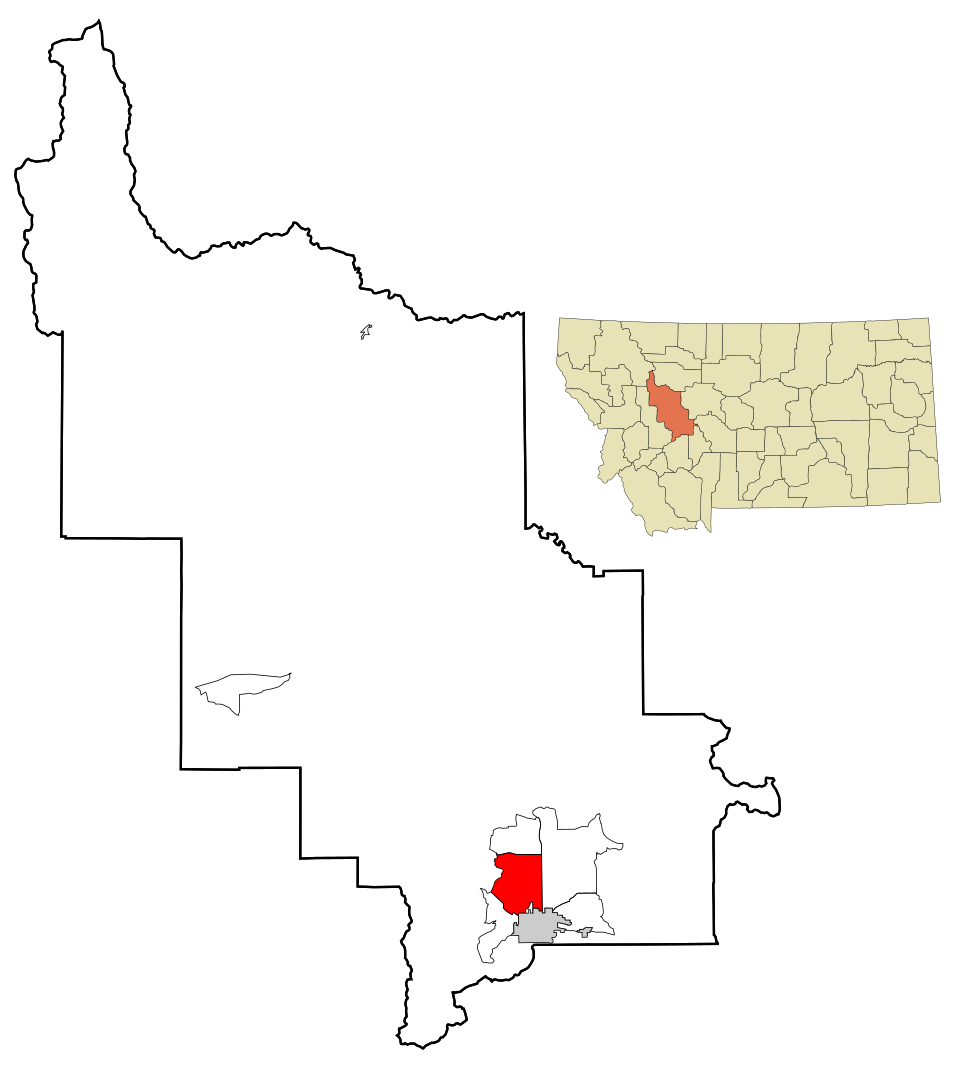
2 Columbia Falls Columbia Falls5,615 people 20 in June 54 in
3 Red Lodge Red Lodge2,502 people 20 in May 142 in
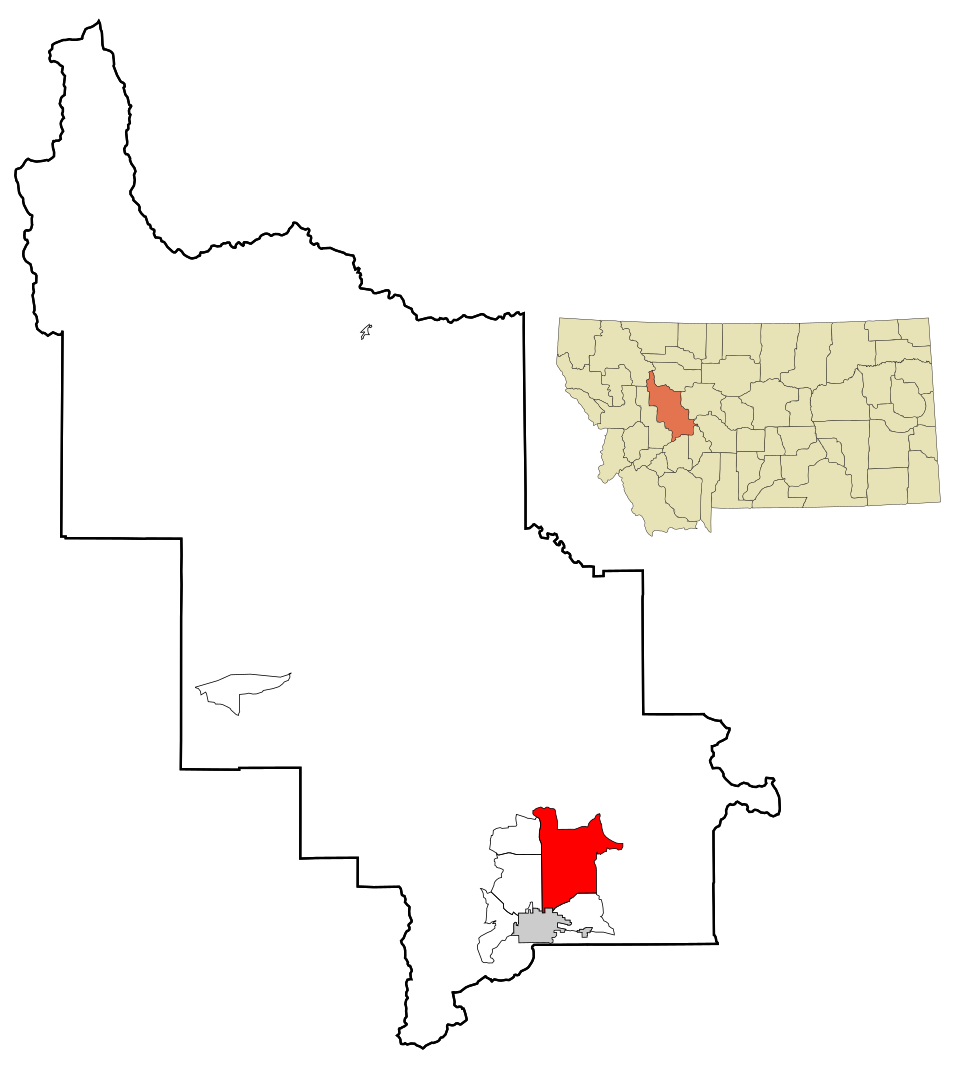
4 Bigfork Bigfork5,565 people 19 in June 51 in
5 Polson Polson5,428 people 19 in June 34 in
6 Libby Libby3,042 people 18 in November 48 in
7 Whitefish Whitefish8,749 people 18 in June 63 in
8 Lewistown Lewistown6,087 people 18 in June 112 in
9 Bozeman Bozeman56,114 people 17 in June 91 in
10 Map of Kalispell Kalispell28,504 people 16 in June 54 in
11 Map of Evergreen Evergreen9,611 people 15 in June 54 in
12 Lockwood Lockwood7,181 people 15 in May 35 in
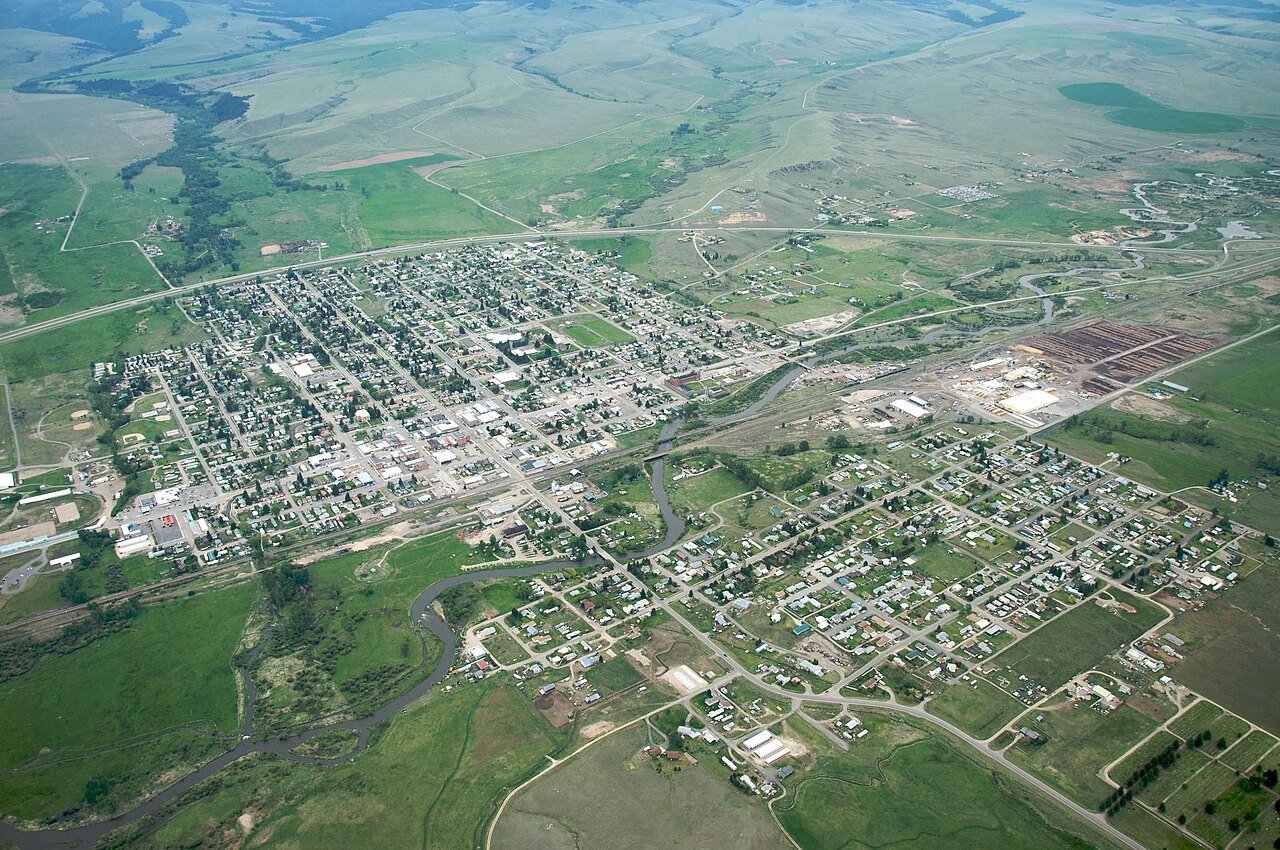
13 Map of Four Corners Four Corners5,791 people 15 in June 91 in
14 Sidney Sidney6,171 people 15 in June 30 in
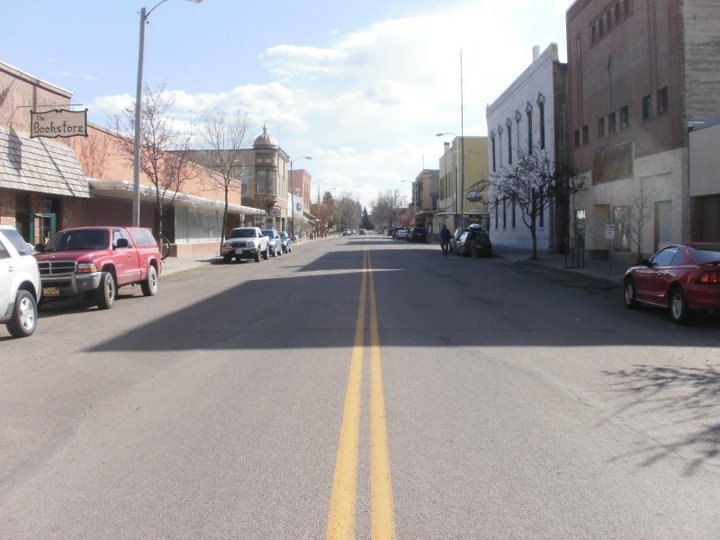
15 Map of North Browning North Browning3,144 people 15 in June —
16 Malmstrom AFB Malmstrom AFB4,302 people 15 in June 66 in
17 Billings Billings119,434 people 14 in May 48 in
18 Butte-Silver Bow Butte-Silver Bow35,785 people 14 in June 15 in
19 Laurel Laurel7,215 people 14 in May 48 in
20 Glendive Glendive4,810 people 14 in May 23 in
21 Lolo Lolo4,314 people 14 in June 43 in
22 Livingston Livingston8,780 people 14 in May 63 in
23 Map of Montana City Montana City3,092 people 14 in June 37 in
24 Missoula Missoula76,514 people 14 in June 43 in
25 Belgrade11,872 people 14 in June 91 in
26 Great Falls Great Falls60,329 people 13 in June 66 in
27 Hardin Hardin3,742 people 13 in May 28 in
28 Glasgow Glasgow3,190 people 13 in June 44 in
29 Map of Havre Havre9,258 people 13 in June 41 in
30 Map of Orchard Homes Orchard Homes5,588 people 13 in June 43 in
31 Hamilton Hamilton5,101 people 13 in June 17 in
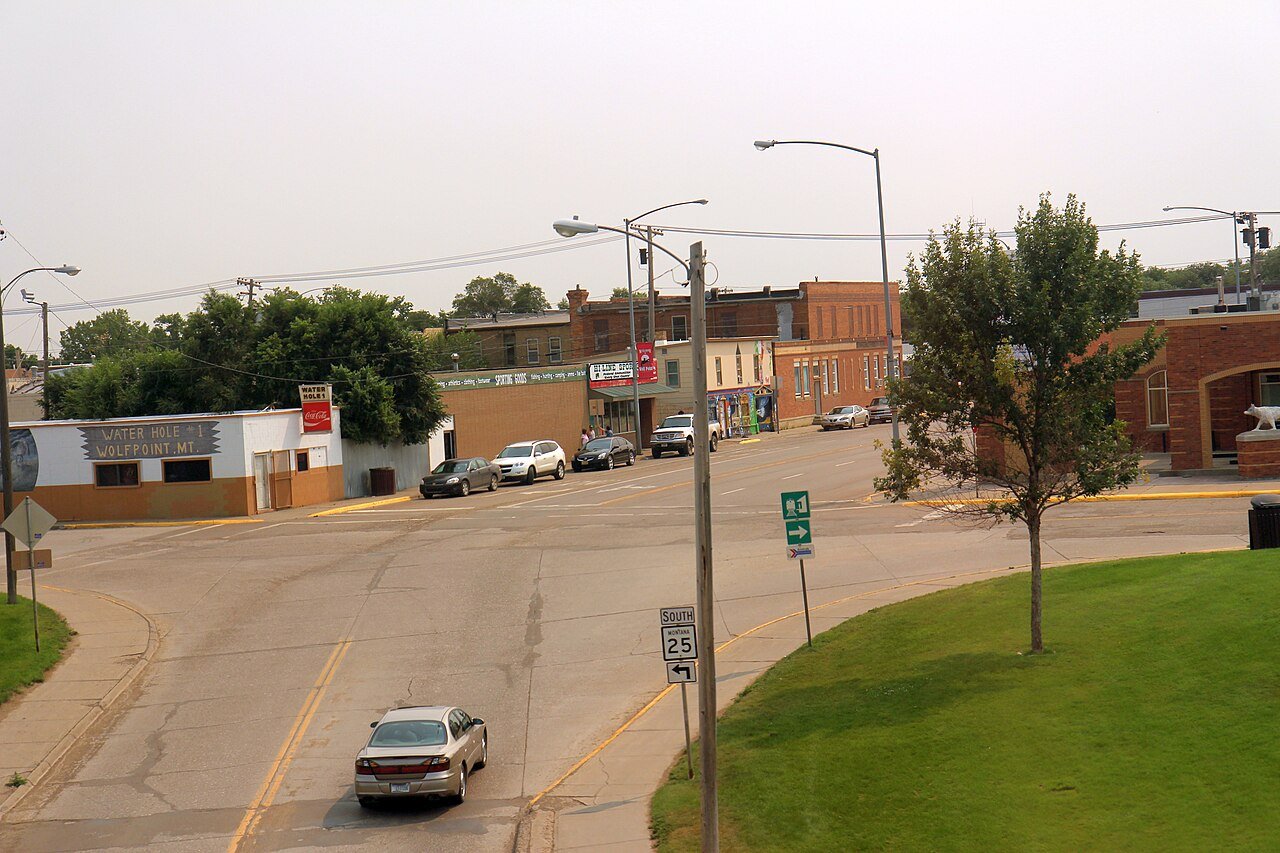
32 Wolf Point Wolf Point2,602 people 13 in June —
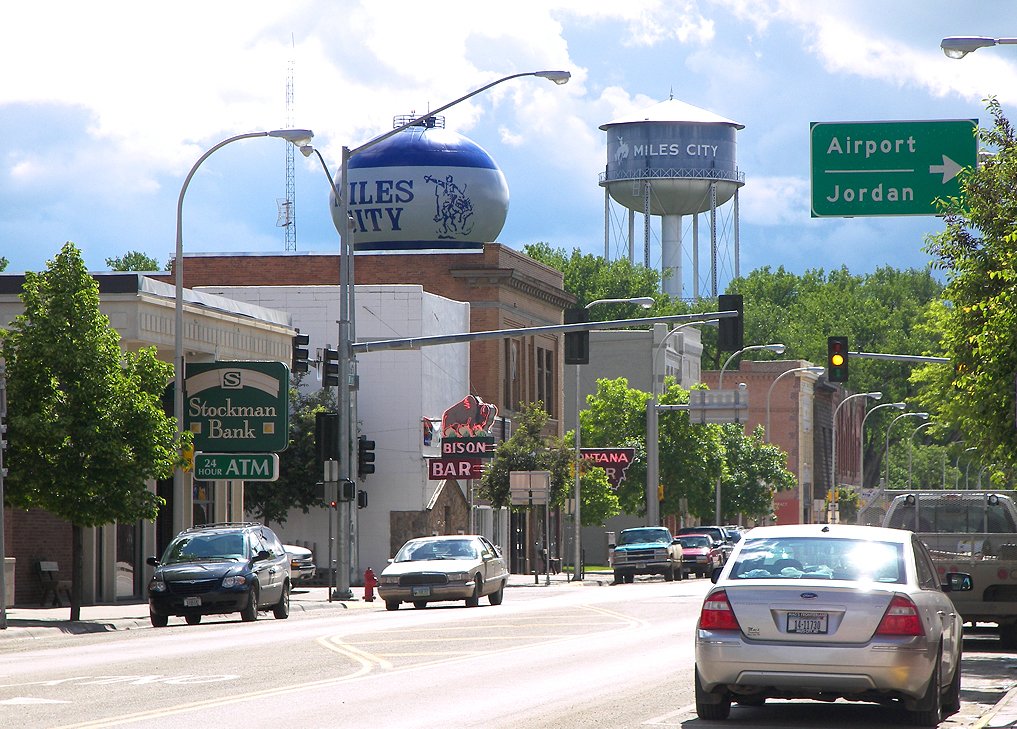
33 Miles City Miles City8,407 people 13 in May —
34 Helena Helena33,639 people 12 in June 37 in
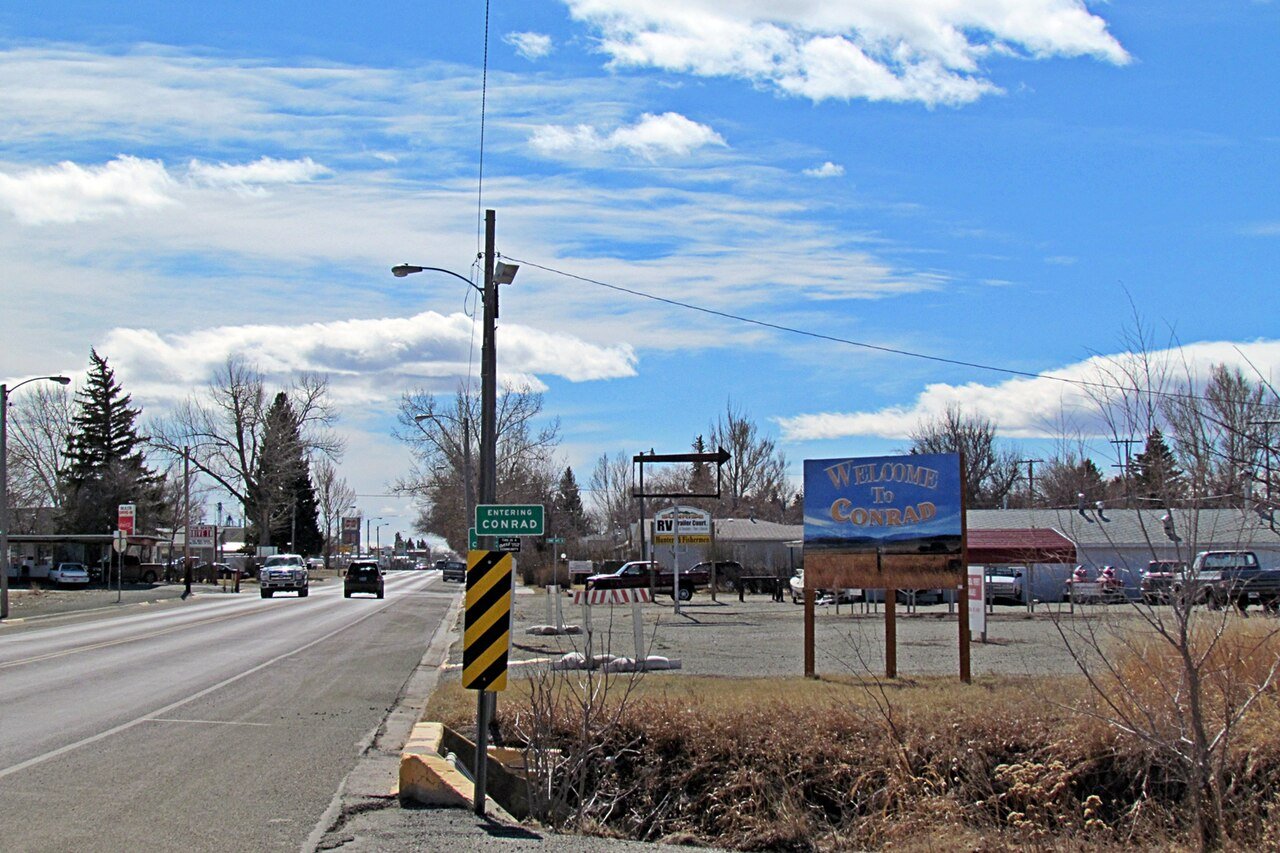
35 Conrad Conrad2,618 people 12 in June 47 in
36 Shelby Shelby3,216 people 12 in June 39 in
37 Map of Helena Valley Southeast Helena Valley Southeast9,108 people 12 in June 37 in
38 Map of Cut Bank Cut Bank3,028 people 12 in June 39 in
39 Map of Helena Valley Northwest Helena Valley Northwest5,183 people 11 in June 37 in
40 Map of Helena Valley West Central Helena Valley West Central8,056 people 11 in June 37 in
41 Map of Helena Valley Northeast Helena Valley Northeast4,659 people 11 in June 37 in
42 Deer Lodge Deer Lodge3,021 people 11 in June 75 in
43 Dillon Dillon4,085 people 9.6 in June 11 in

How this ranking works

We rank every town by rain and melted snow in a normal year, 1991–2020, from NOAA’s gridded climate normals for each town. The town with the highest figure ranks #1. Normals are 30-year averages, not a forecast, and each town’s Climate page shows its whole year month by month.

Temperatures and rainfall come from NOAA’s gridded normals, about 5 km (3 miles) square, read at each town’s center, so hills and coastlines are built in. Towns whose centers fall in the same square have the same numbers, so only the largest of them is listed.

Only towns with at least 2,500 residents are ranked; Census estimates for smaller places are too uncertain. Population and income: U.S. Census Bureau American Community Survey 5-year estimates. Climate: NOAA NCEI U.S. Climate Normals, 1991–2020. Town photos: Wikimedia Commons, credited on each town’s page.

Same ranking in other states