NENebraska rankings

Wettest towns in Nebraska

Ranked by rain and melted snow in a normal year, 1991–2020, from NOAA’s gridded climate normals for each town. Neighboring towns on the same 5 km grid square have the same numbers, so each square is listed once, under its largest town. 61 towns with 2,500+ residents.
NOAA U.S. Climate Normals, 1991–2020

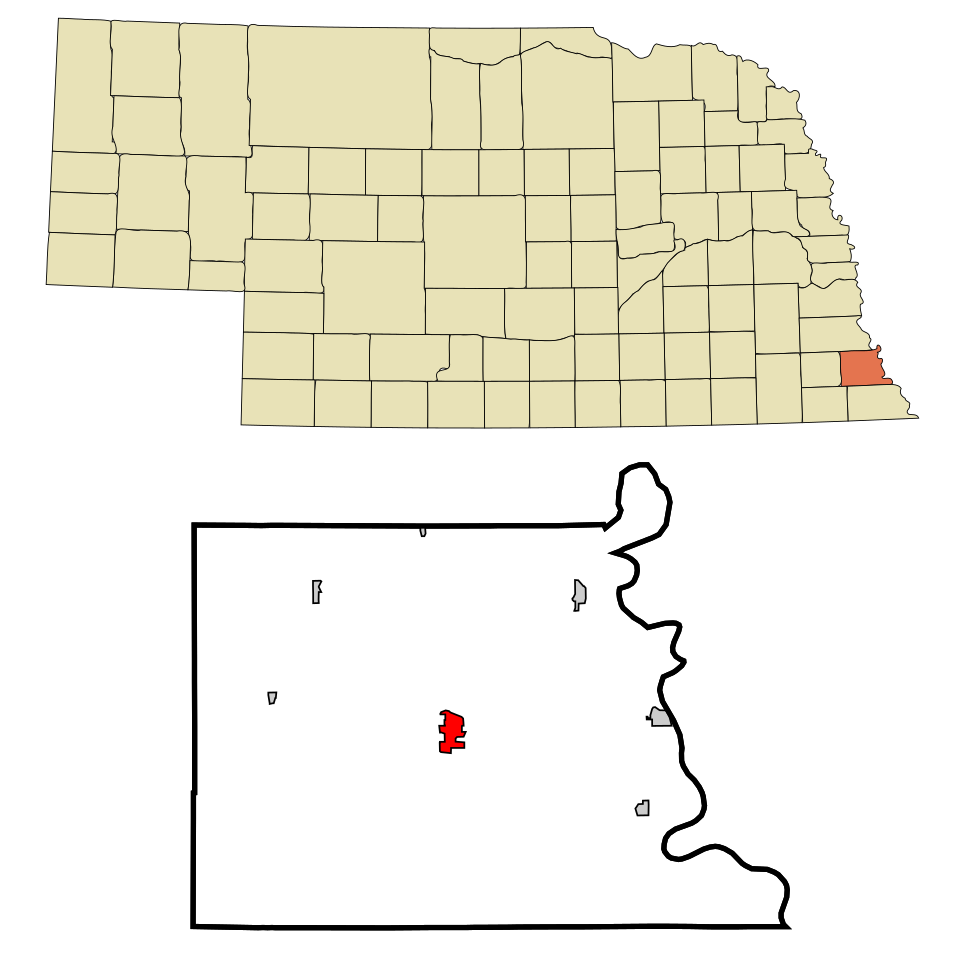
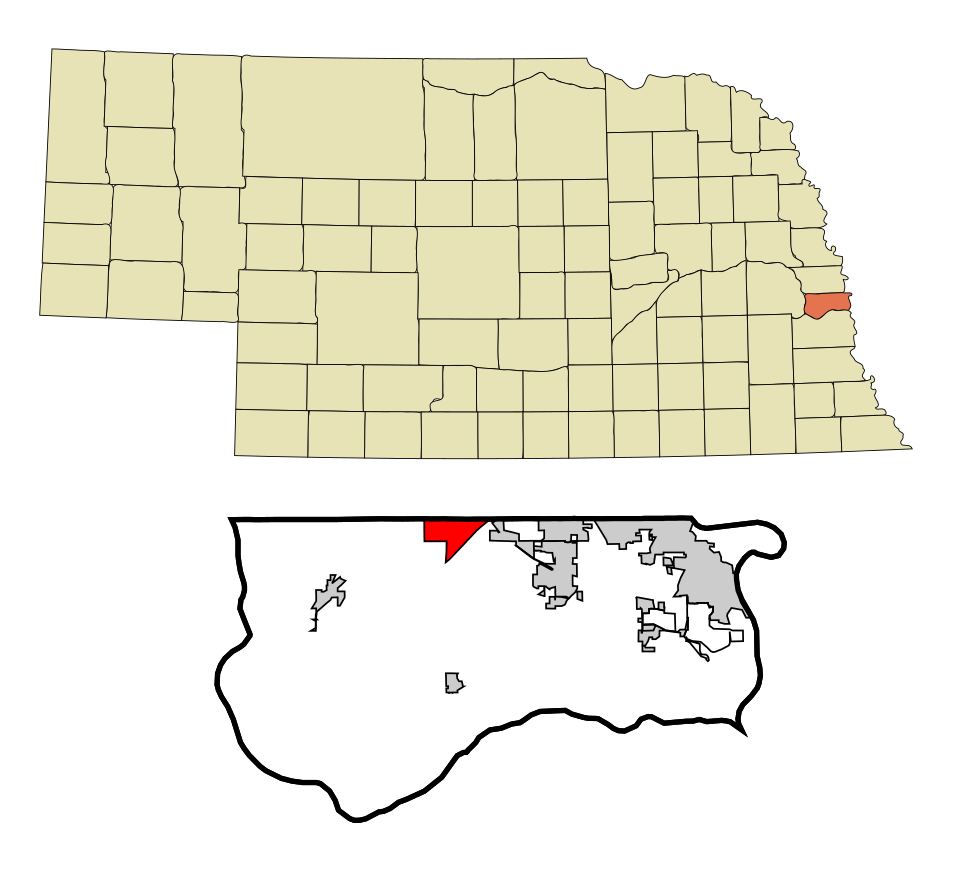
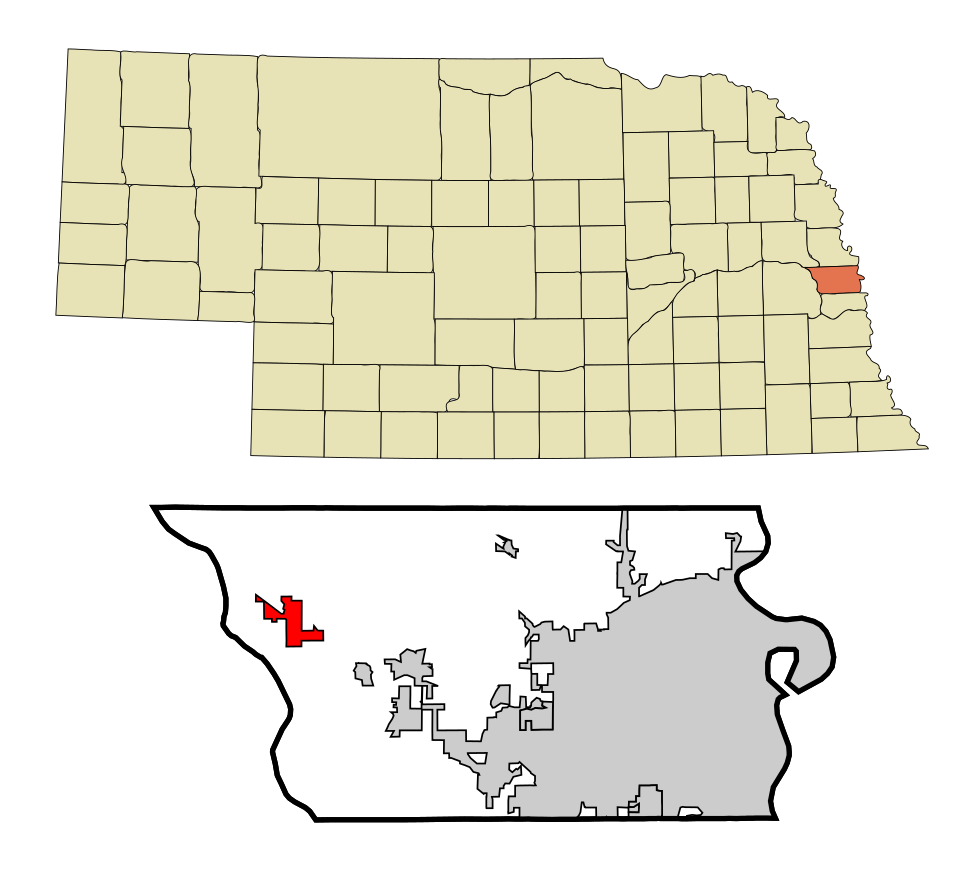
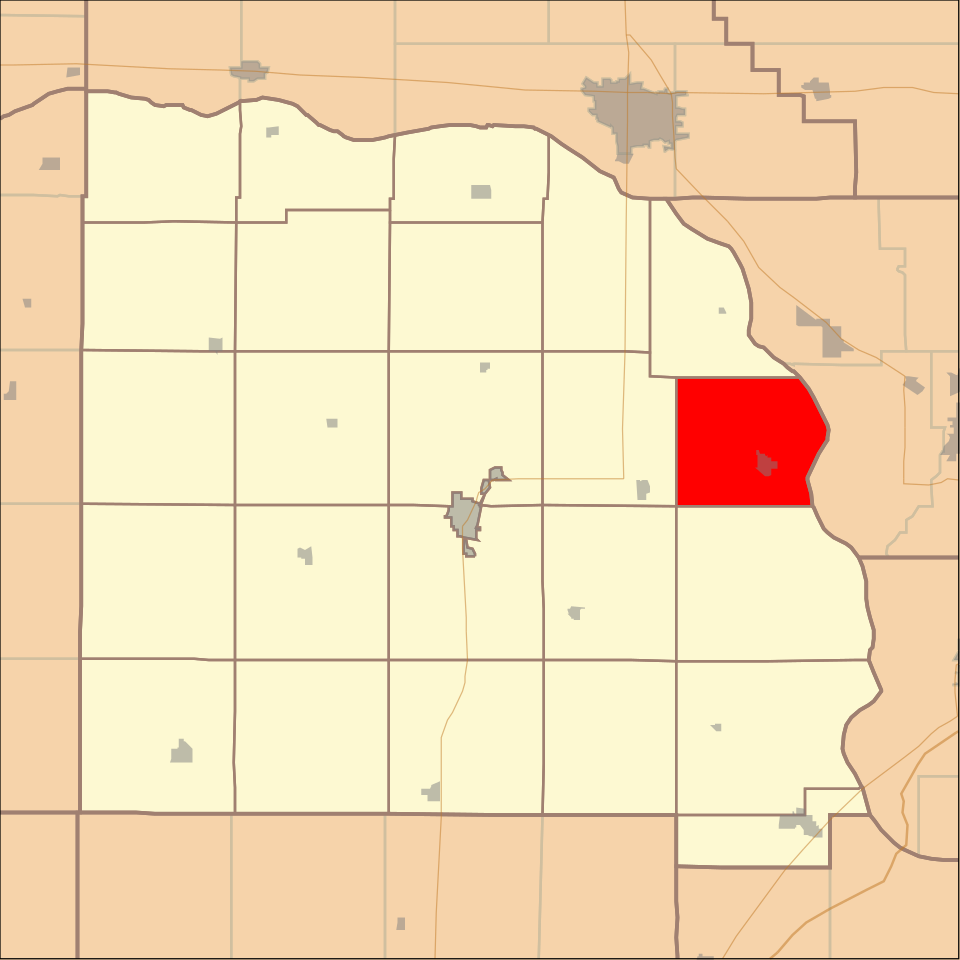
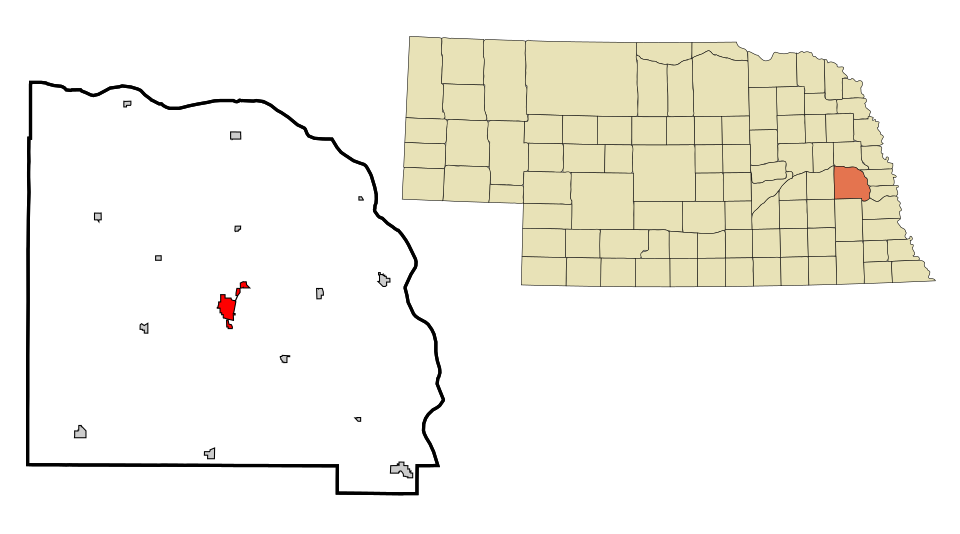
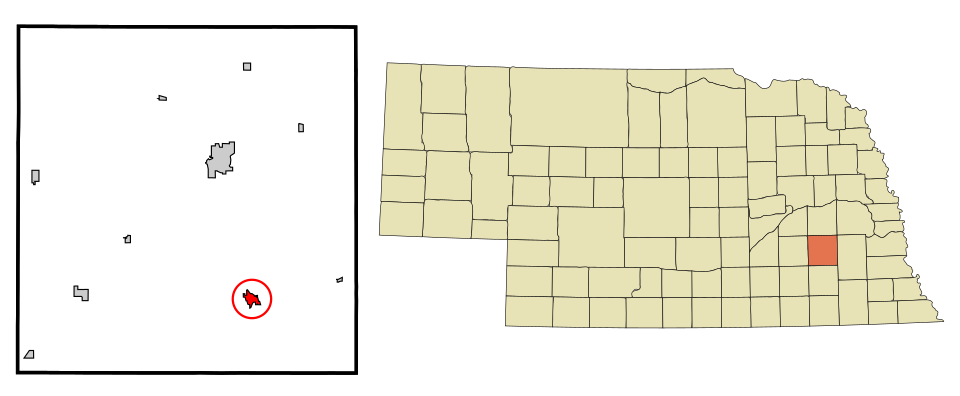
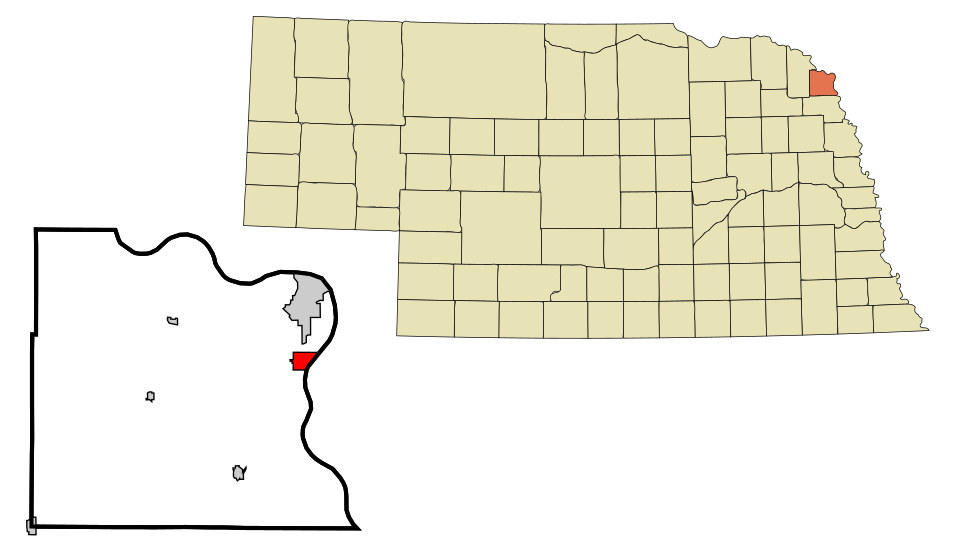
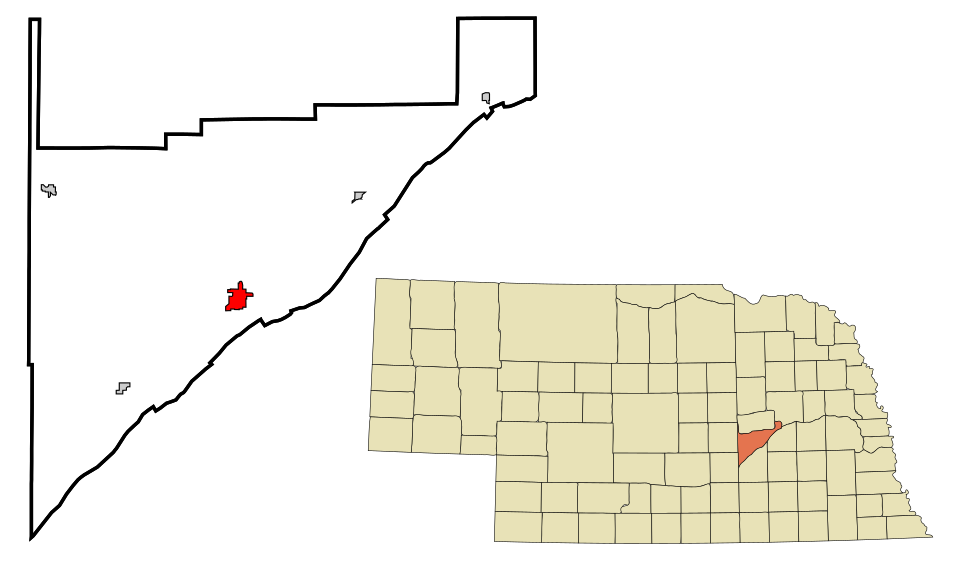
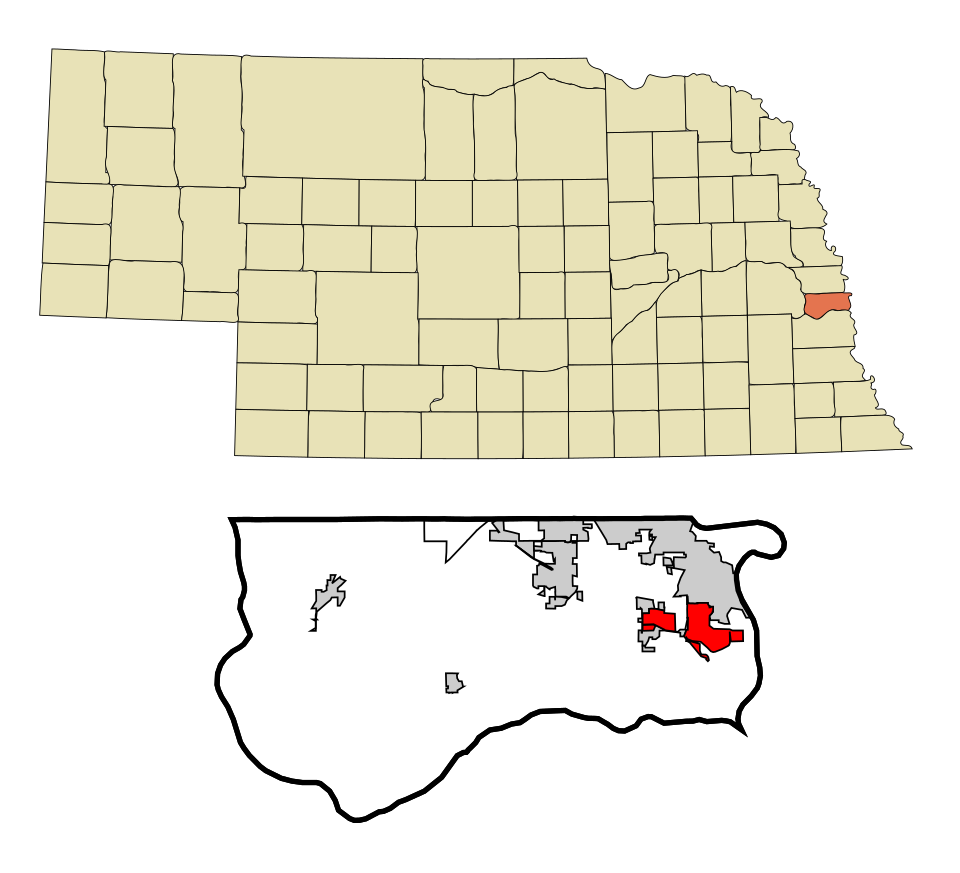
Map of Offutt AFB
Nebraska · Wettest

Where Offutt AFB lands: #11 of 61

33 in · Visit Offutt AFB →

#TownRain + melted snowWettest monthSnow a year
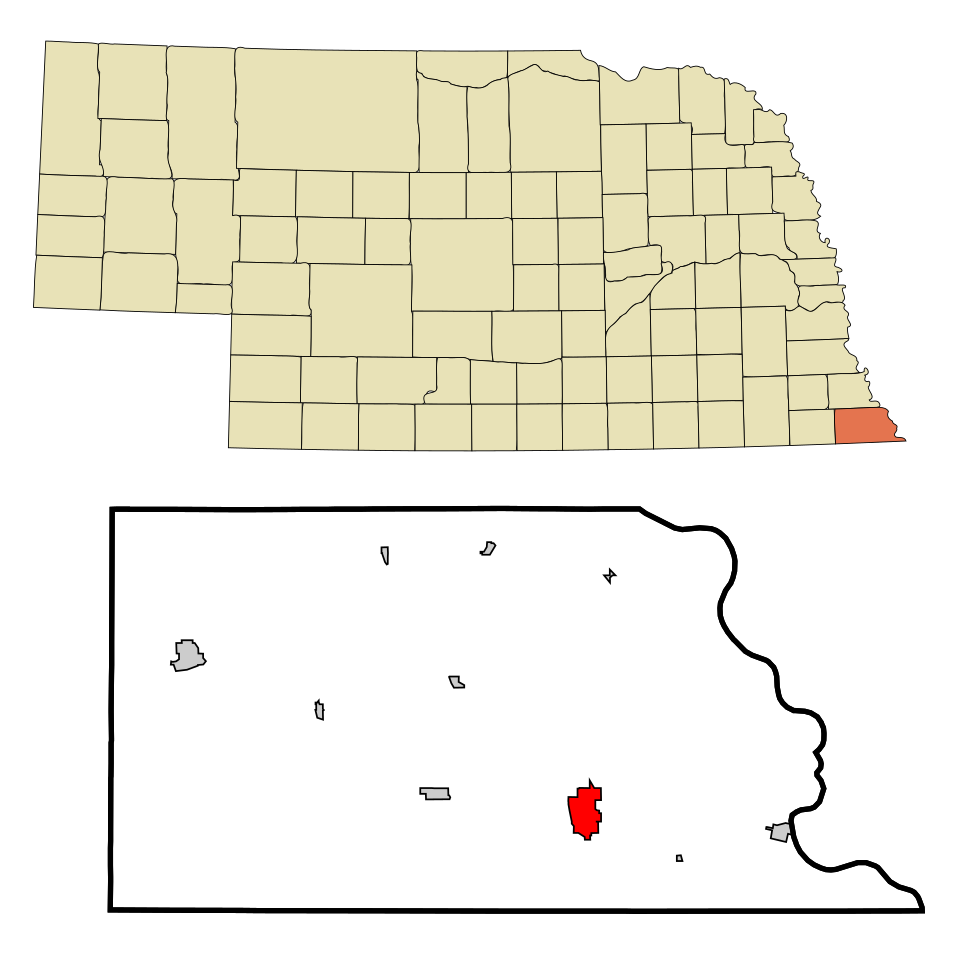
1 Map of Falls City Falls City4,077 people 34 in May 22 in
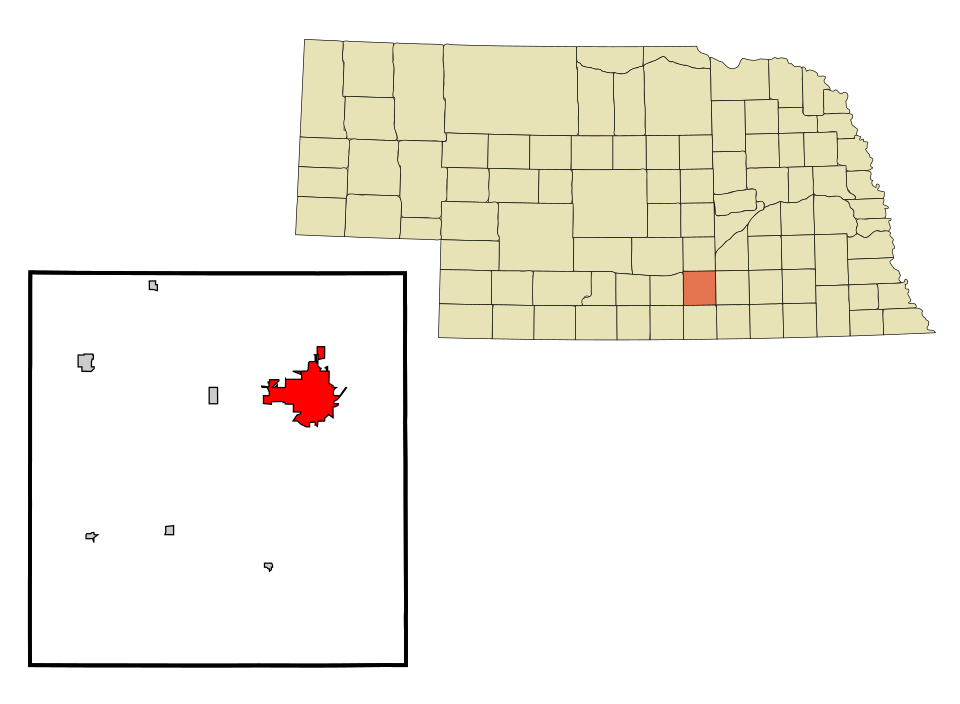
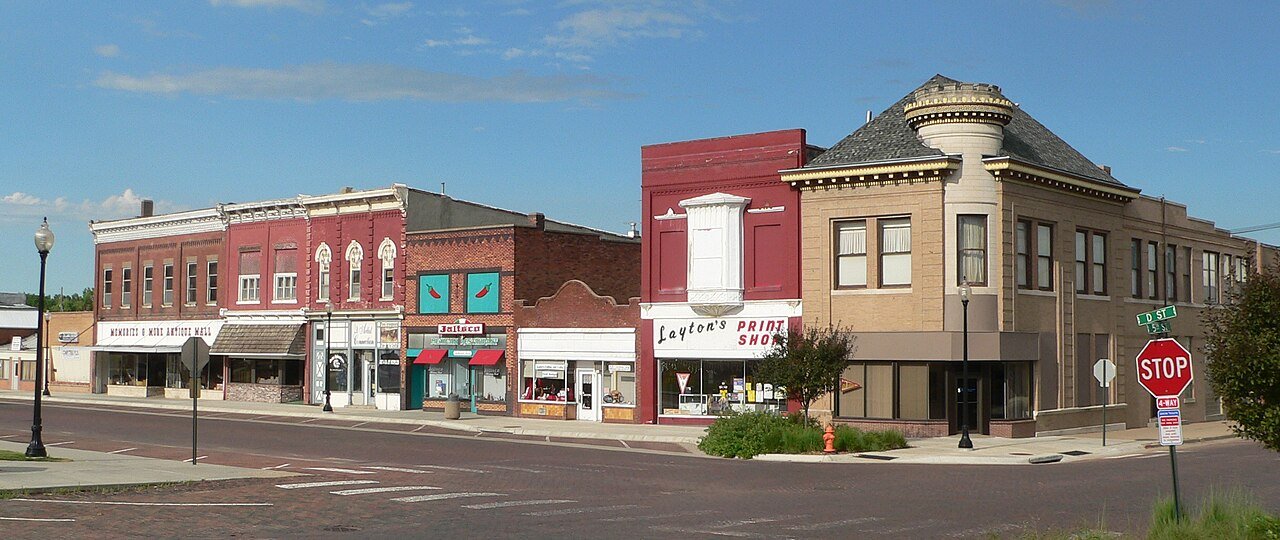
2 Map of Auburn Auburn3,470 people 34 in May 30 in

3 Nebraska City Nebraska City7,369 people 33 in May 24 in
4 Omaha Omaha488,837 people 33 in June 34 in
5 Bellevue Bellevue64,510 people 33 in May 25 in
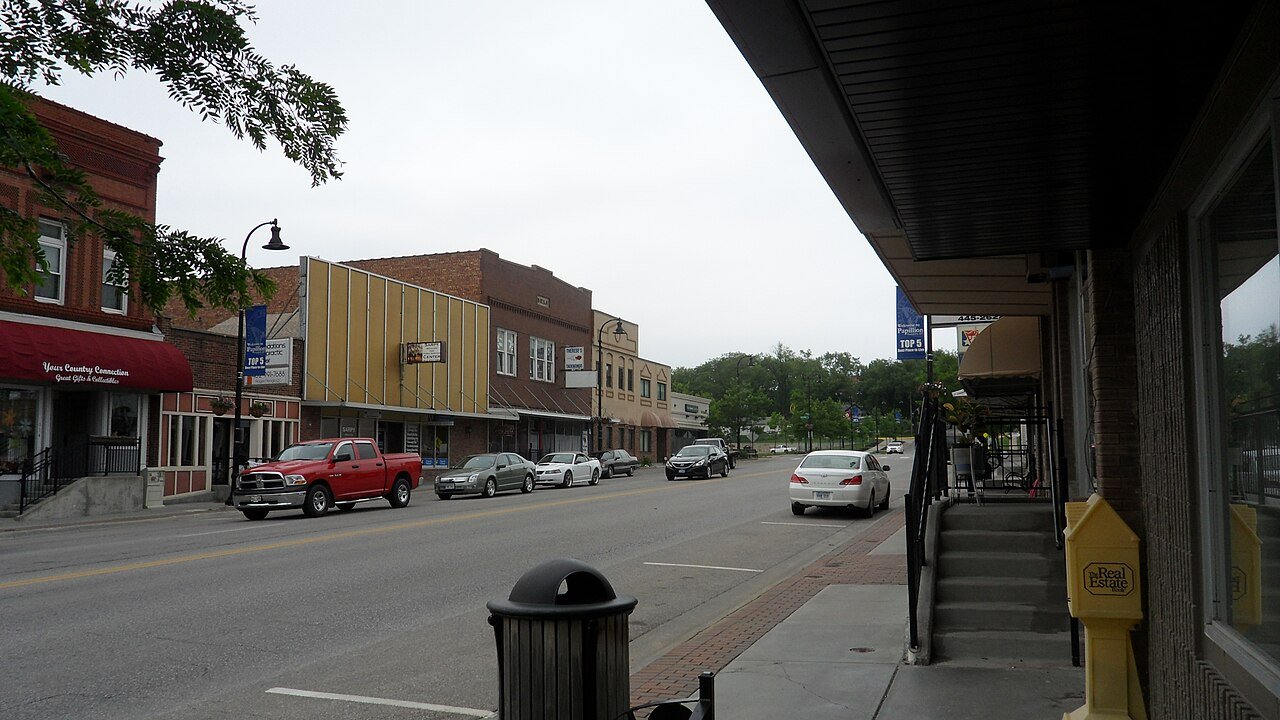
6 Papillion Papillion25,244 people 33 in May 36 in
7 La Vista La Vista16,563 people 33 in June 36 in
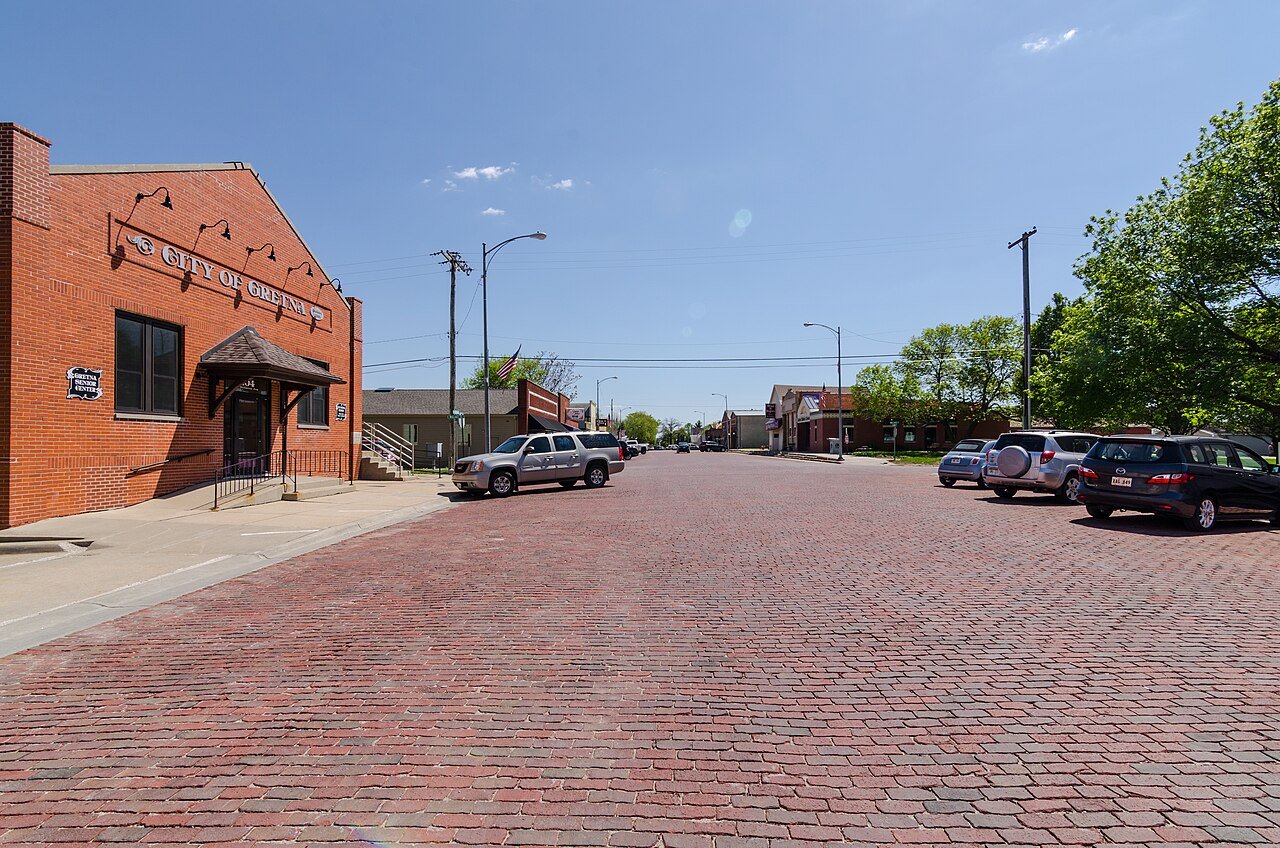
8 Gretna Gretna9,193 people 33 in June 36 in
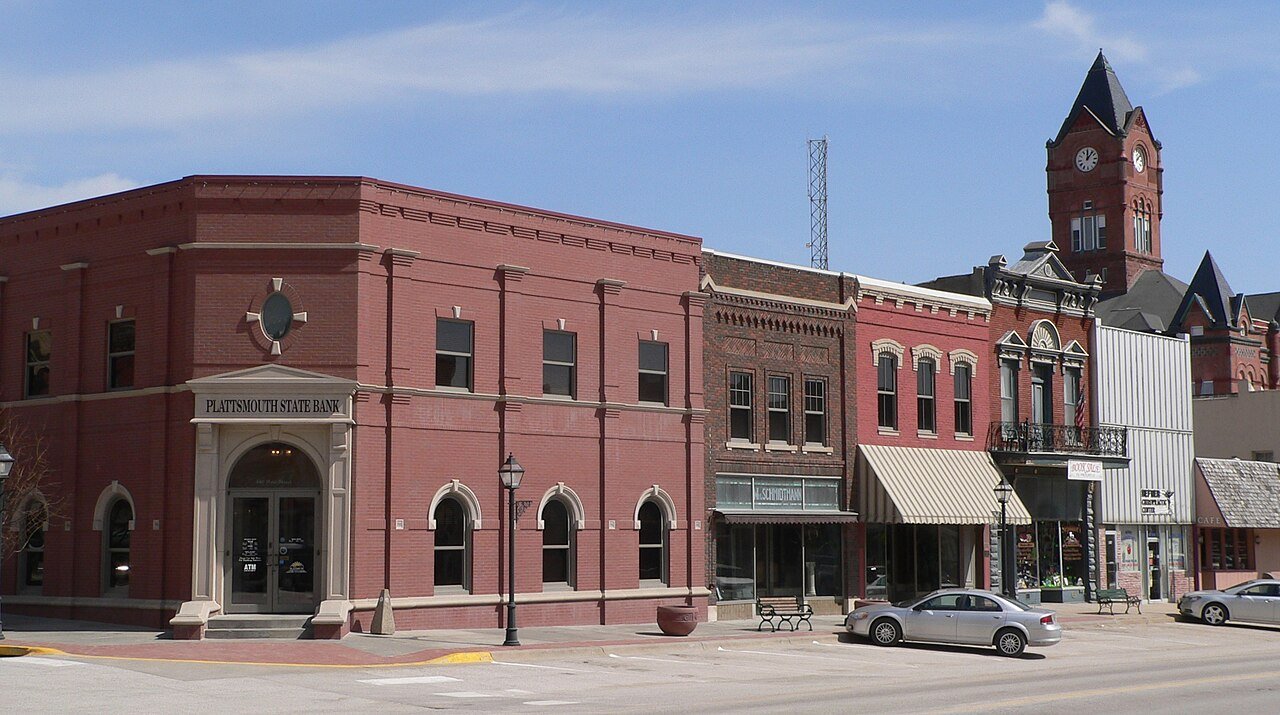
9 Plattsmouth Plattsmouth6,731 people 33 in May 25 in
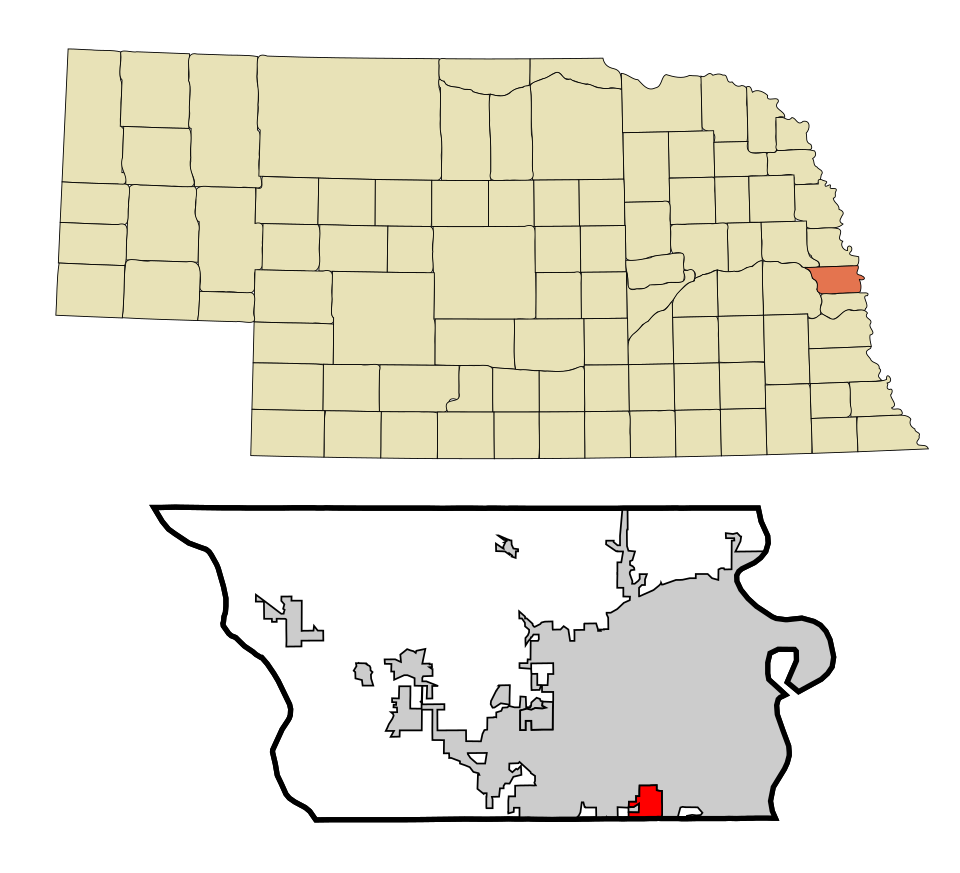
10 Map of Ralston Ralston6,472 people 33 in May 36 in
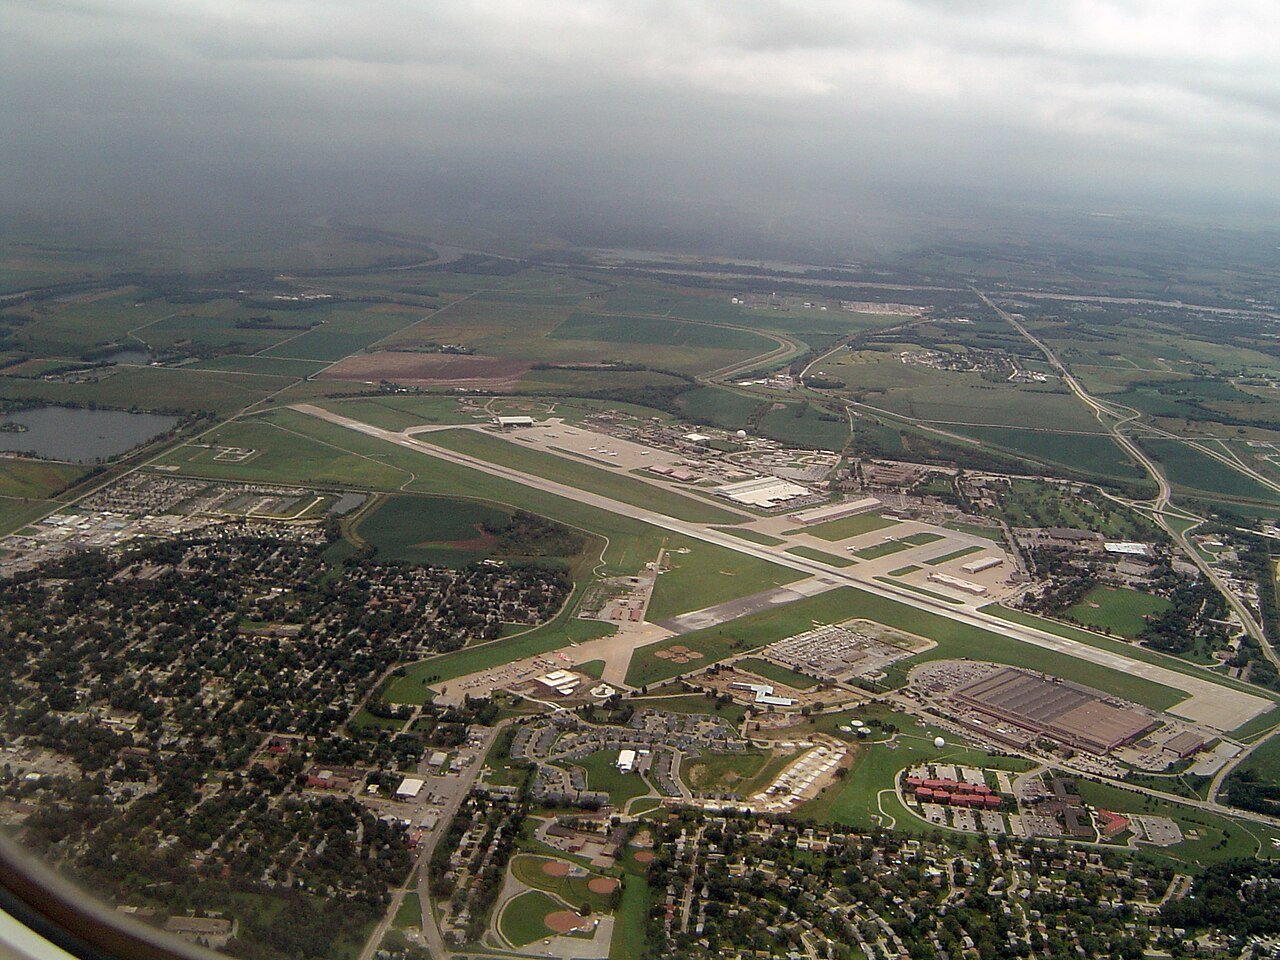
11 Map of Offutt AFB Offutt AFB6,074 people 33 in May 25 in
12 Map of Chalco Chalco10,595 people 33 in June 36 in
13 Township 1Washington County · 4,458 people 33 in June 34 in
14 Map of Ashland AshlandSaunders County · 3,071 people 32 in May 22 in
15 Township 7Washington County · 2,731 people 32 in June 34 in
16 Blair Blair7,914 people 32 in June 32 in
17 Township 2Washington County · 3,195 people 32 in June 34 in
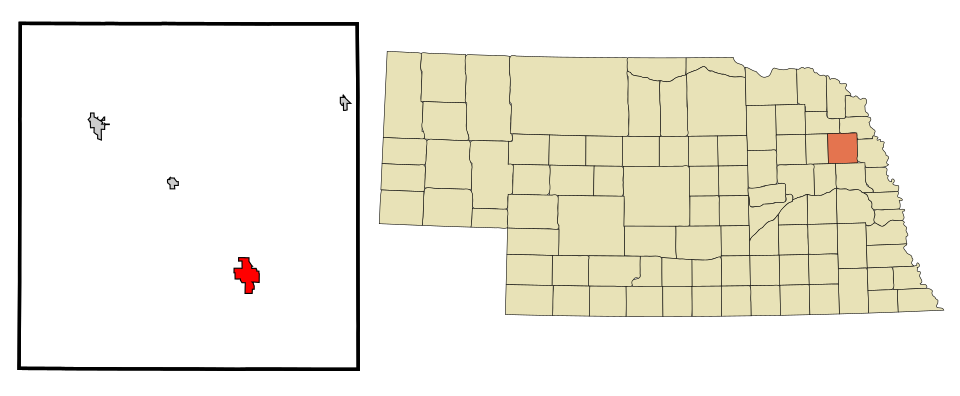
18 Map of Valley Valley3,174 people 32 in June 32 in
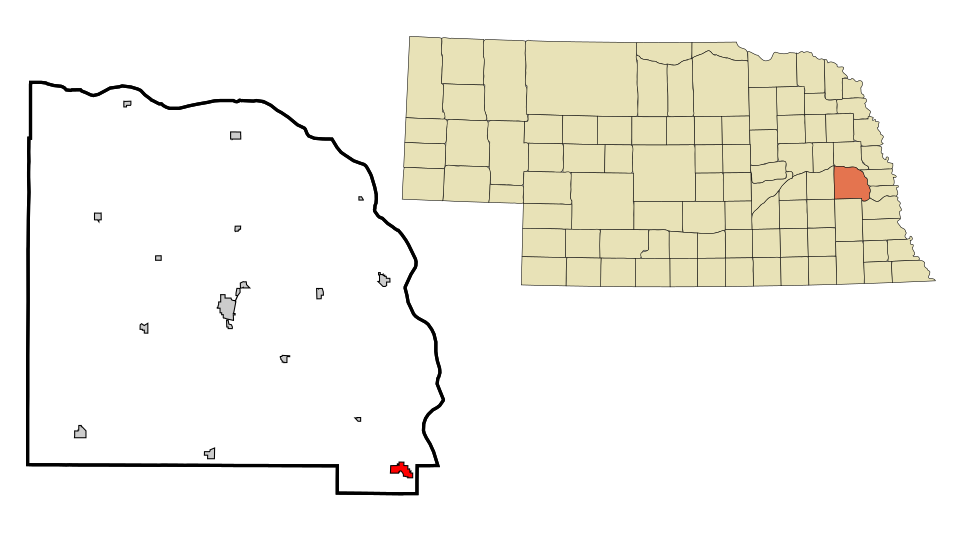
19 Map of Hickman Hickman3,004 people 32 in May 29 in
20 Map of Waverly Waverly4,440 people 32 in May 22 in
21 Map of Union UnionSaunders County · 2,563 people 32 in June 32 in
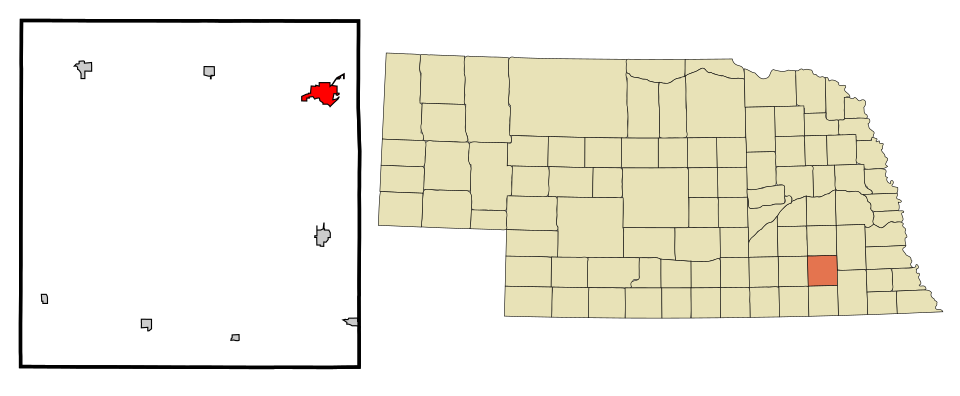
22 Map of Beatrice Beatrice12,225 people 31 in May 19 in
23 Lincoln Lincoln294,856 people 31 in May 26 in
24 Map of Fremont Fremont27,567 people 31 in June 32 in
25 Map of Wahoo Wahoo4,929 people 31 in June 20 in
26 Map of Crete Crete7,527 people 31 in May 25 in
27 Fairbury Fairbury3,888 people 31 in May 21 in
28 Map of West Point West Point3,471 people 30 in June 29 in
29 Map of Milford Milford2,565 people 30 in May 22 in
30 Seward Seward7,678 people 30 in May 22 in
31 David City David City3,017 people 30 in May 32 in
32 Map of Schuyler Schuyler6,578 people 29 in May 36 in
33 Map of Dakota City Dakota City2,675 people 29 in June 36 in
34 Map of South Sioux City South Sioux City13,907 people 29 in June 36 in
35 Wayne Wayne6,121 people 29 in June 32 in
36 Aurora Aurora4,664 people 29 in May 27 in
37 Columbus ColumbusPlatte County · 3,313 people 29 in May 26 in
38 Columbus Columbus24,488 people 28 in May 26 in
39 Map of York York8,141 people 28 in May 28 in
40 Map of Central City Central City3,061 people 28 in May 29 in
41 Norfolk Norfolk26,054 people 28 in June 30 in
42 Grand Island Grand Island52,884 people 27 in May 28 in
43 Map of Hastings Hastings25,008 people 27 in May 29 in
44 St. Paul St. Paul2,758 people 27 in May 22 in
45 O'Neill O'Neill3,570 people 26 in May 26 in
46 Minden Minden3,108 people 26 in May 25 in
47 Kearney Kearney34,246 people 26 in May 22 in
48 Holdrege Holdrege5,546 people 25 in May 25 in
49 Broken Bow Broken Bow3,502 people 24 in May 30 in
50 Map of Gothenburg Gothenburg3,452 people 23 in May 31 in
51 Lexington Lexington10,862 people 23 in June 20 in
52 Cozad Cozad3,937 people 23 in May 31 in
53 Map of Valentine Valentine2,633 people 22 in June 29 in
54 Map of North Platte North Platte22,831 people 21 in June 28 in
55 McCook McCook7,314 people 21 in July 20 in
56 Ogallala Ogallala4,777 people 19 in June 25 in
57 Map of Chadron Chadron5,160 people 18 in May 50 in
58 Map of Alliance Alliance8,075 people 17 in May 45 in
59 Sidney Sidney6,419 people 17 in June 29 in
60 Map of Gering Gering8,550 people 15 in May 43 in
61 Scottsbluff Scottsbluff14,376 people 15 in May 43 in

How this ranking works

We rank every town by rain and melted snow in a normal year, 1991–2020, from NOAA’s gridded climate normals for each town. The town with the highest figure ranks #1. Normals are 30-year averages, not a forecast, and each town’s Climate page shows its whole year month by month.

Temperatures and rainfall come from NOAA’s gridded normals, about 5 km (3 miles) square, read at each town’s center, so hills and coastlines are built in. Towns whose centers fall in the same square have the same numbers, so only the largest of them is listed.

Only towns with at least 2,500 residents are ranked; Census estimates for smaller places are too uncertain. Population and income: U.S. Census Bureau American Community Survey 5-year estimates. Climate: NOAA NCEI U.S. Climate Normals, 1991–2020. Town photos: Wikimedia Commons, credited on each town’s page.

Same ranking in other states