Towns with the coolest summers in North Dakota
Ranked by the typical afternoon high in July, 1991–2020, from NOAA’s gridded climate normals for each town. Neighboring towns on the same 5 km grid square have the same numbers, so each square is listed once, under its largest town. 24 towns with 2,500+ residents.
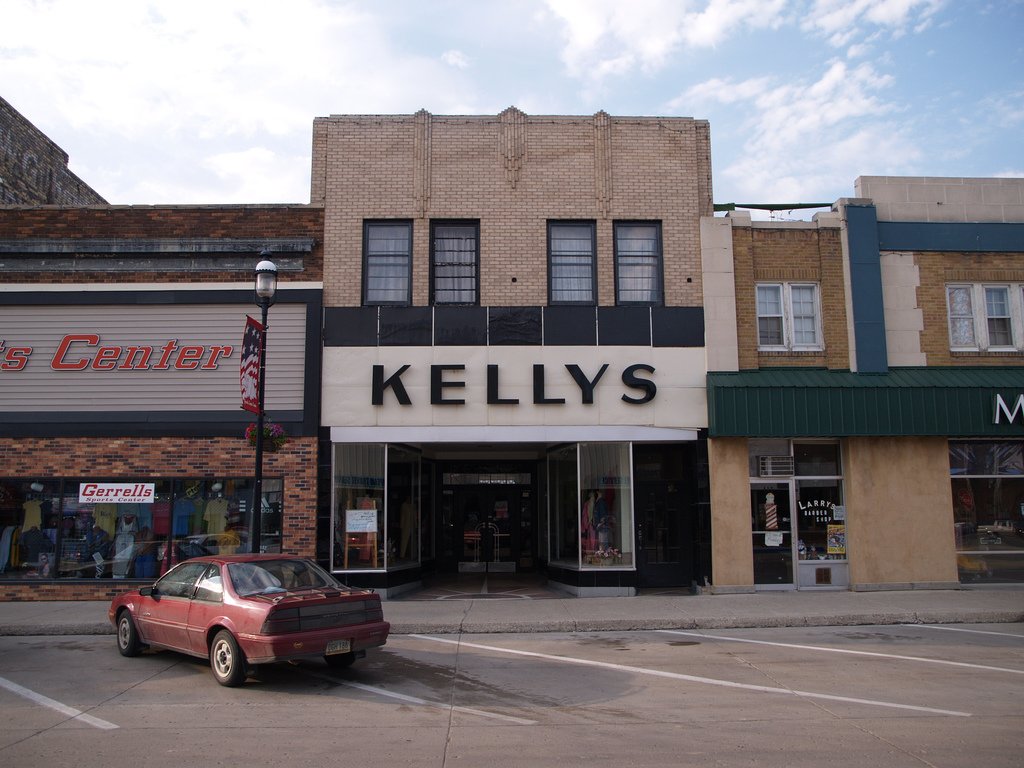 1
Devils Lake
79.6°
Days at 90°+ 6
1
Devils Lake
79.6°
Days at 90°+ 6
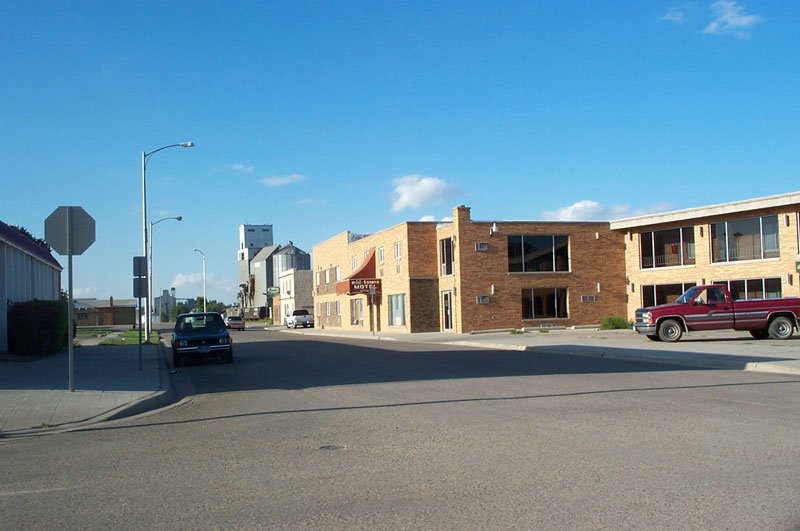 2
Grafton
80.9°
Days at 90°+ 10
2
Grafton
80.9°
Days at 90°+ 10
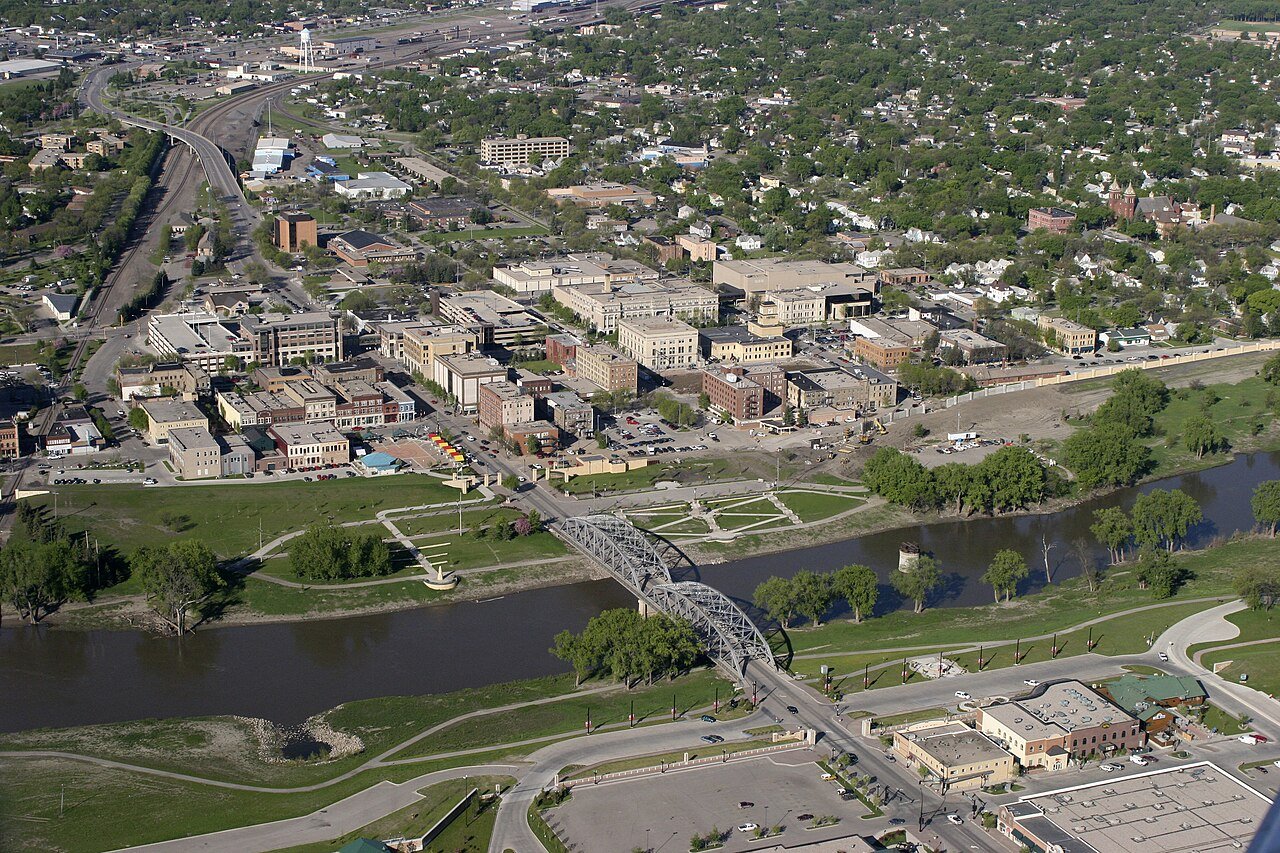 3
Grand Forks
81.1°
Days at 90°+ 7
3
Grand Forks
81.1°
Days at 90°+ 7

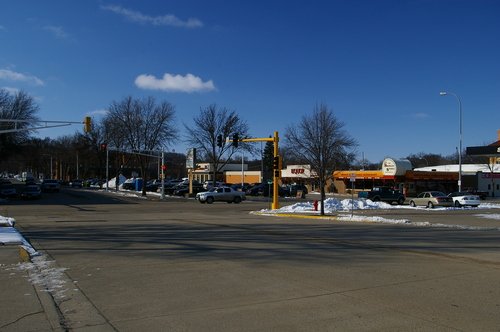
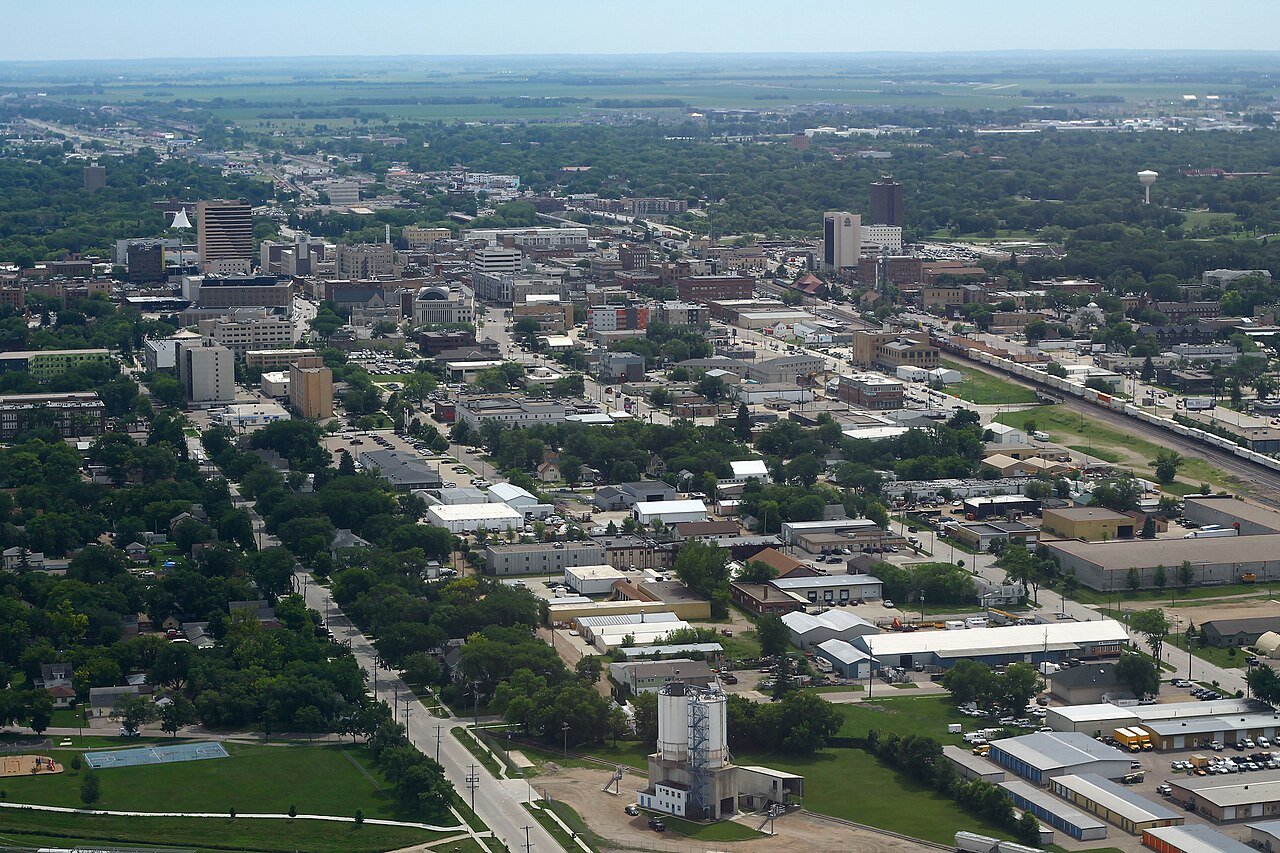
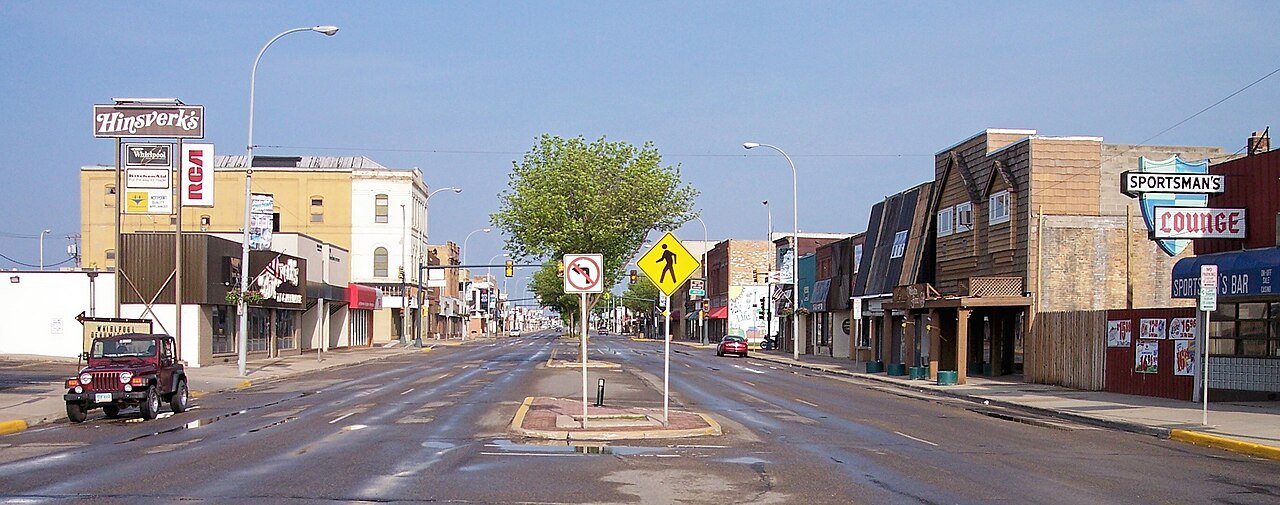
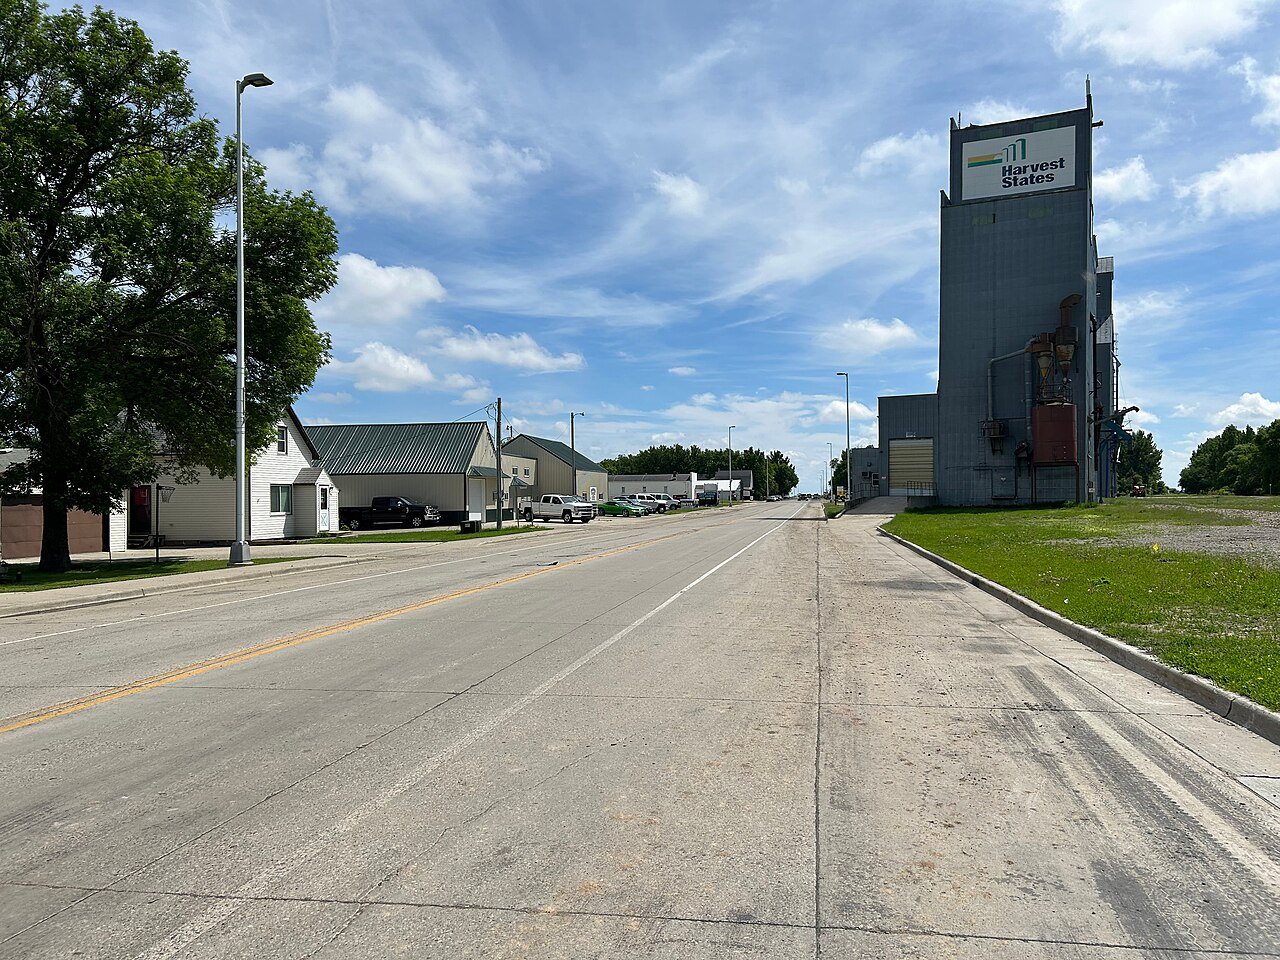
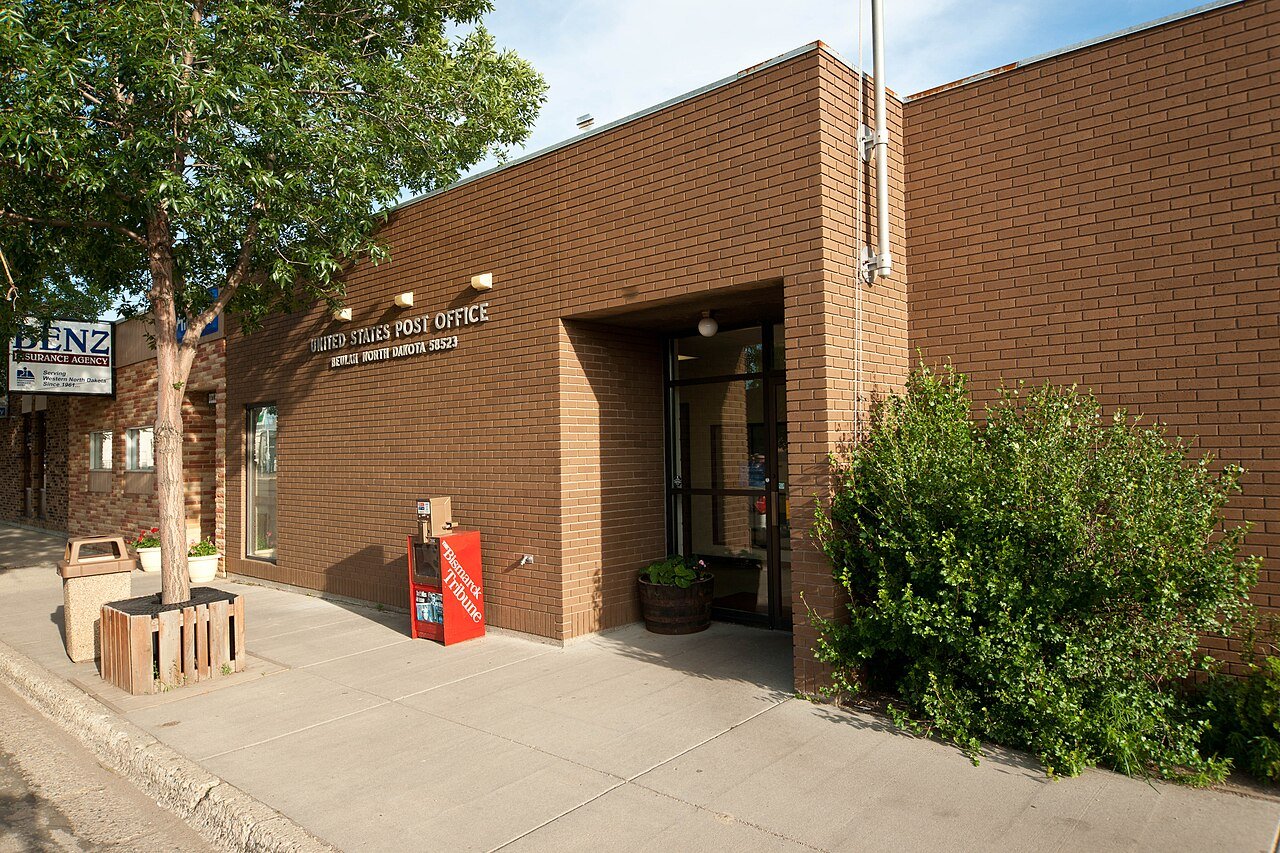
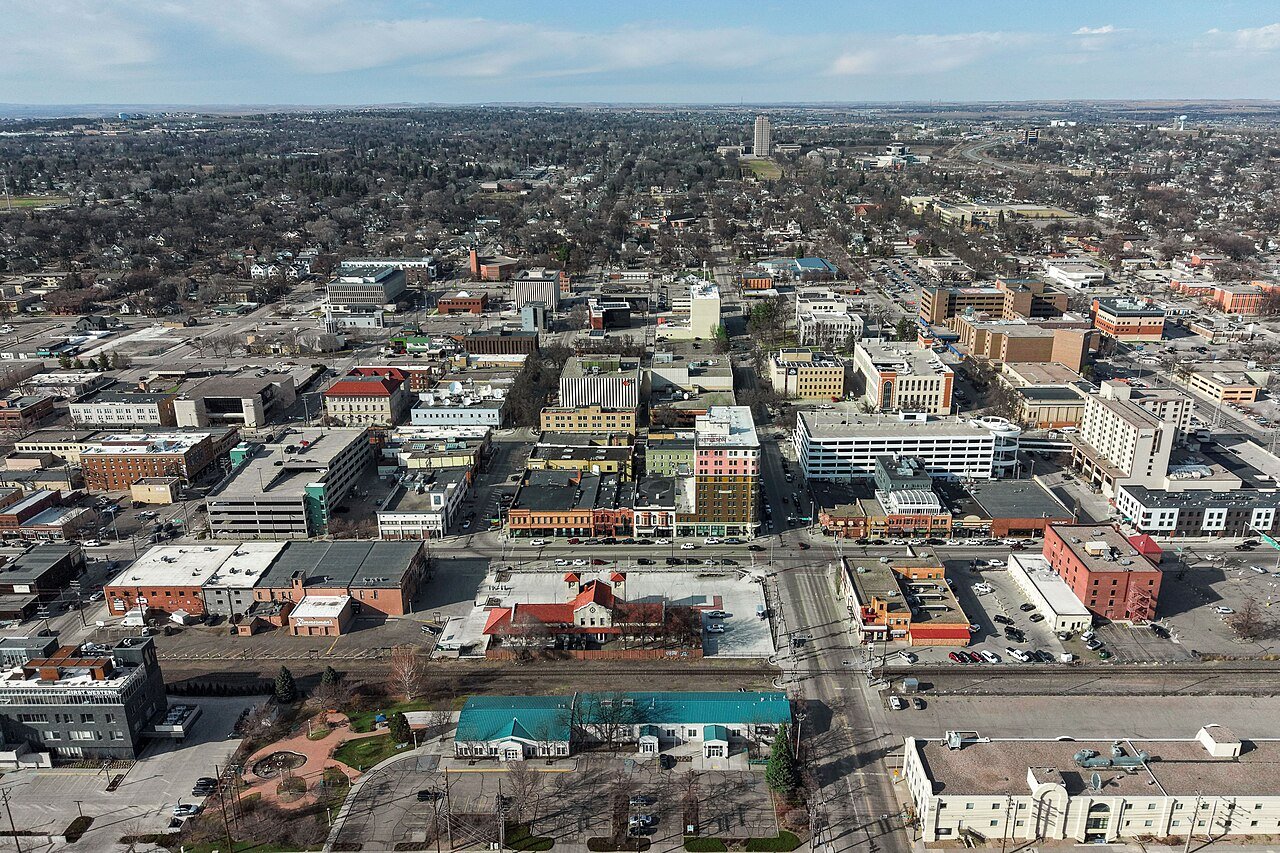
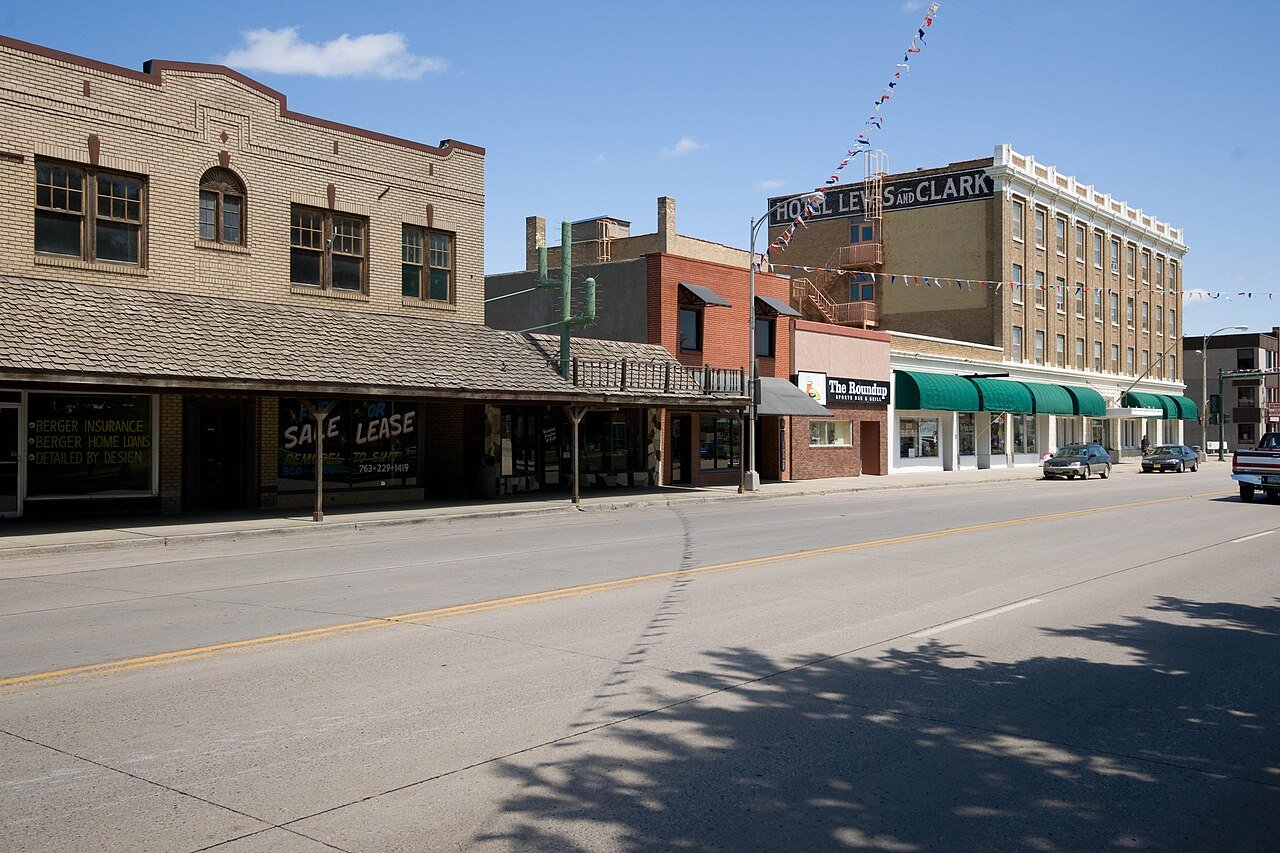
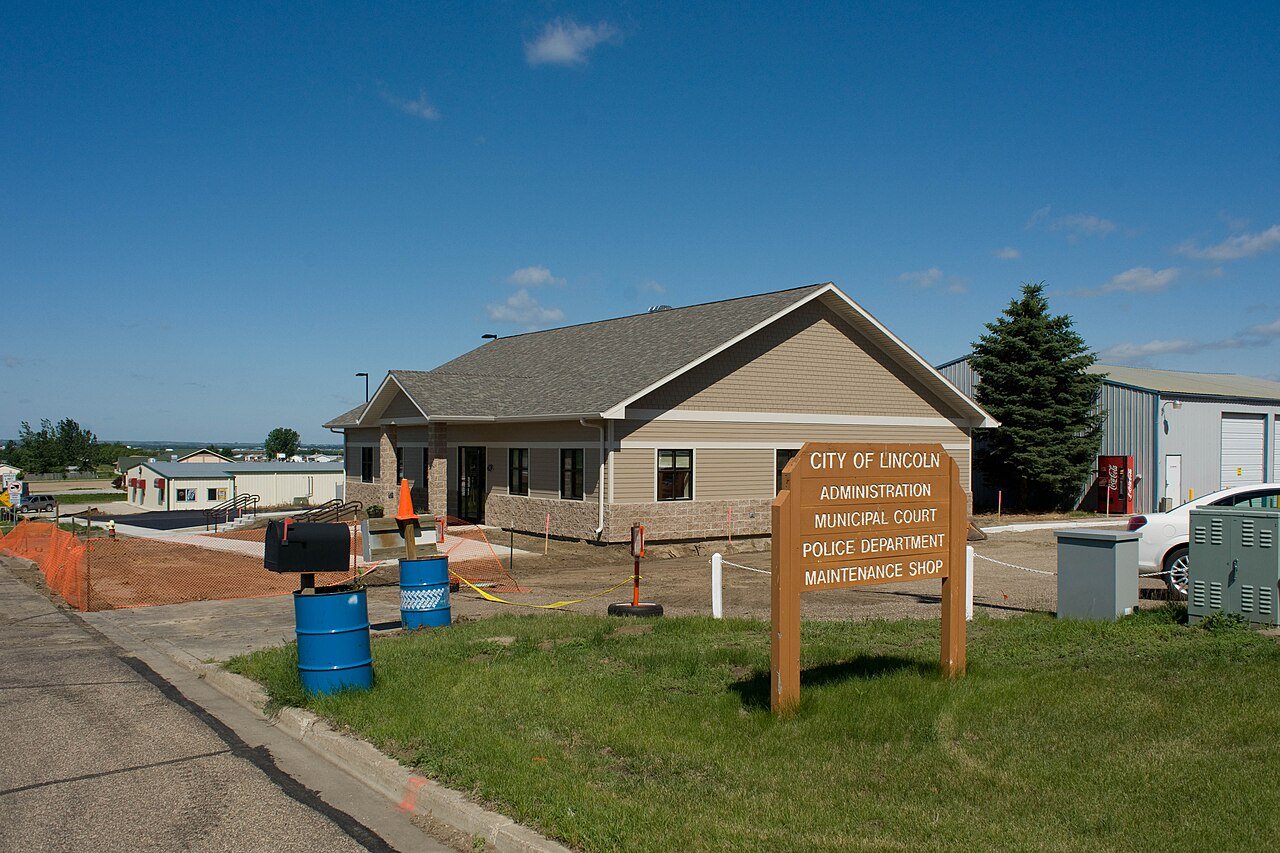
How this ranking works
We rank every town by the typical afternoon high in July, 1991–2020, from NOAA’s gridded climate normals for each town. The lowest ranks first. The town with the lowest figure ranks #1. Normals are 30-year averages, not a forecast, and each town’s Climate page shows its whole year month by month.
Temperatures and rainfall come from NOAA’s gridded normals, about 5 km (3 miles) square, read at each town’s center, so hills and coastlines are built in. Towns whose centers fall in the same square have the same numbers, so only the largest of them is listed.
Only towns with at least 2,500 residents are ranked; Census estimates for smaller places are too uncertain. Population and income: U.S. Census Bureau American Community Survey 5-year estimates. Climate: NOAA NCEI U.S. Climate Normals, 1991–2020. Town photos: Wikimedia Commons, credited on each town’s page.