Towns with the highest high school graduation rates in North Dakota
Ranked by the four-year high school graduation rate of each town's public school district, class of 2020. Towns that share a regional district share its rate and its rank (T = tied). The North Dakota rate is 86.6%. 19 towns with 2,500+ residents.
 1
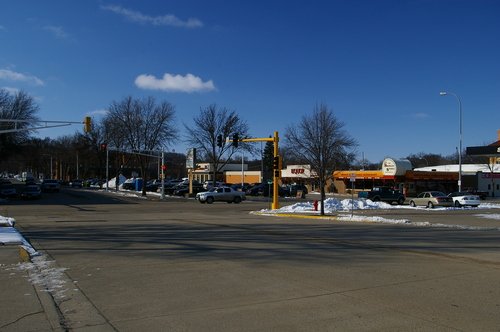
Valley City
92%
Valley City Public School District 2
1
Valley City
92%
Valley City Public School District 2
 2
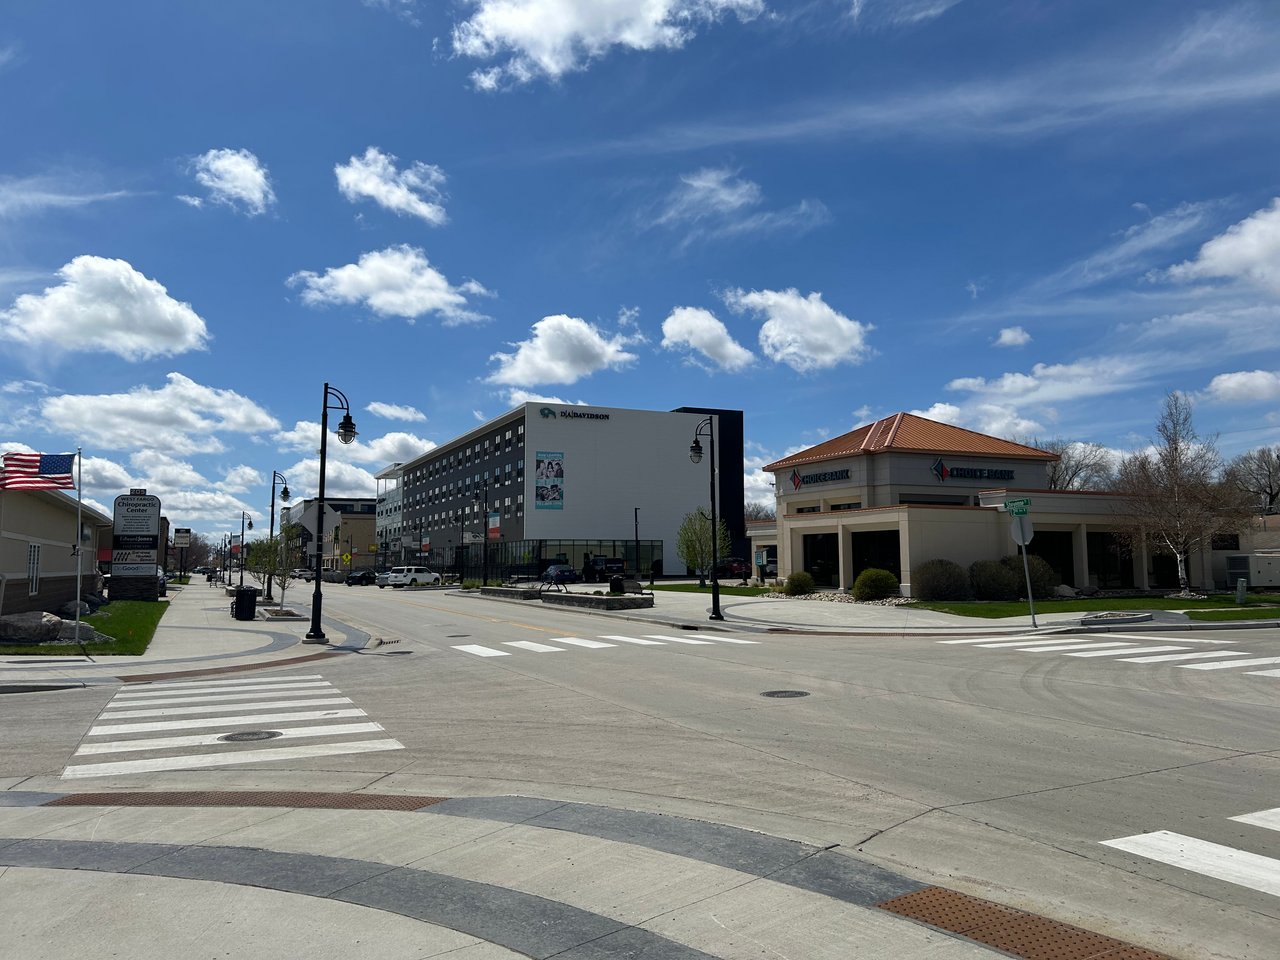
West Fargo
91%
West Fargo Public School District 6 · tied
2
West Fargo
91%
West Fargo Public School District 6 · tied
 2
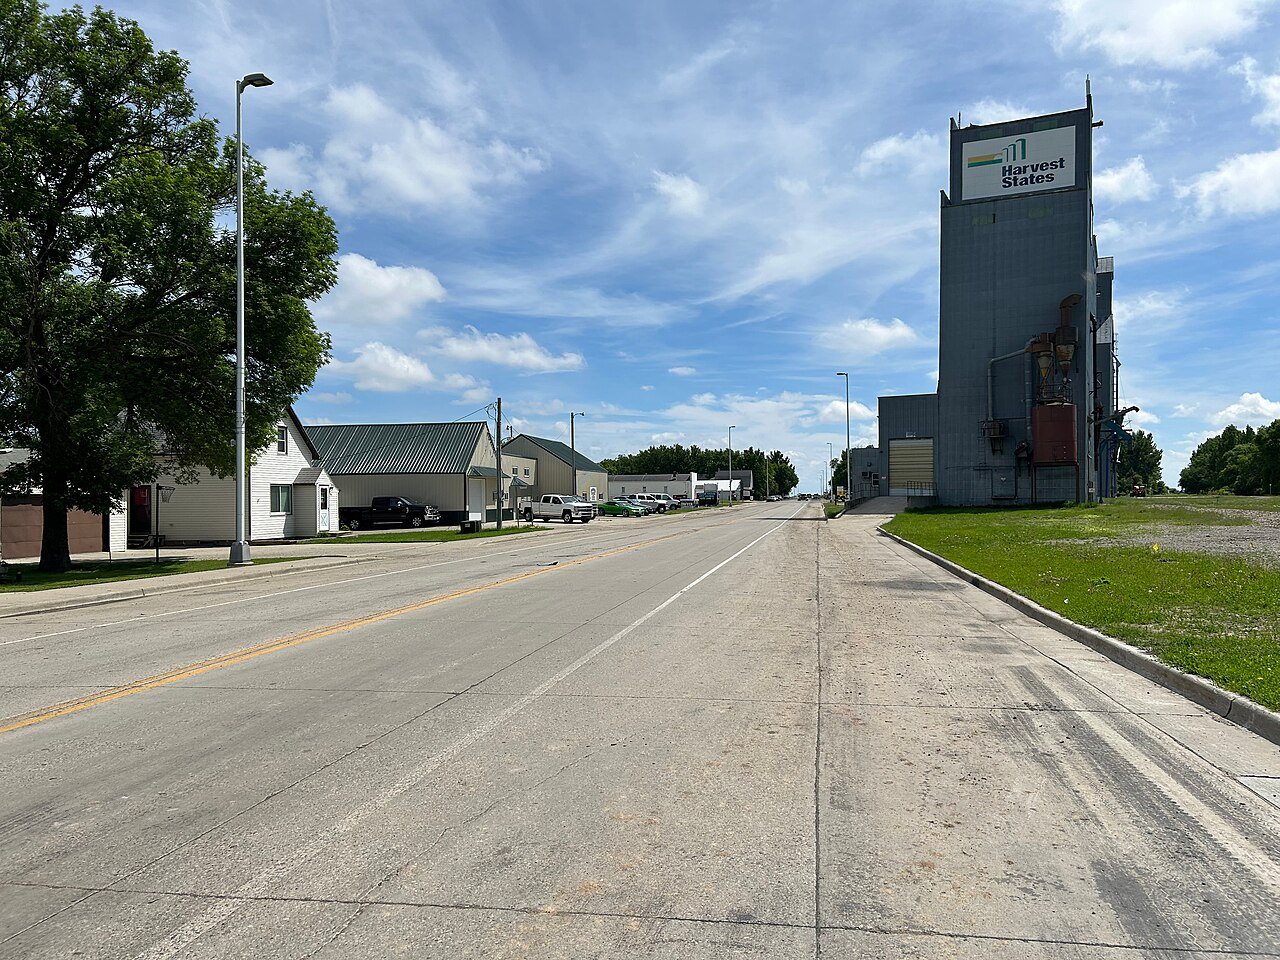
Horace
91%
West Fargo Public School District 6 · tied
2
Horace
91%
West Fargo Public School District 6 · tied

How this ranking works
Each town gets the four-year graduation rate of the public school district that runs its high school for the class of 2020: the share of students who started ninth grade together and earned a regular diploma within four years, counting students who transferred in and out. Every state computes it the same federal way. Where a regional district serves several towns, they all share its rate and its rank.
We leave out a town split between high school districts, a district whose class had fewer than 20 students, and one the Department of Education reports only as a wide range (such as 50–100%). Those numbers are too uncertain to rank. The Department also publishes most rates in bands rather than exact figures (a rate between 95% and 99% is shown as 97%), which is why many towns tie. Graduation data: EDFacts via the Urban Institute Education Data Portal. Each district's page shows its rate against the state.
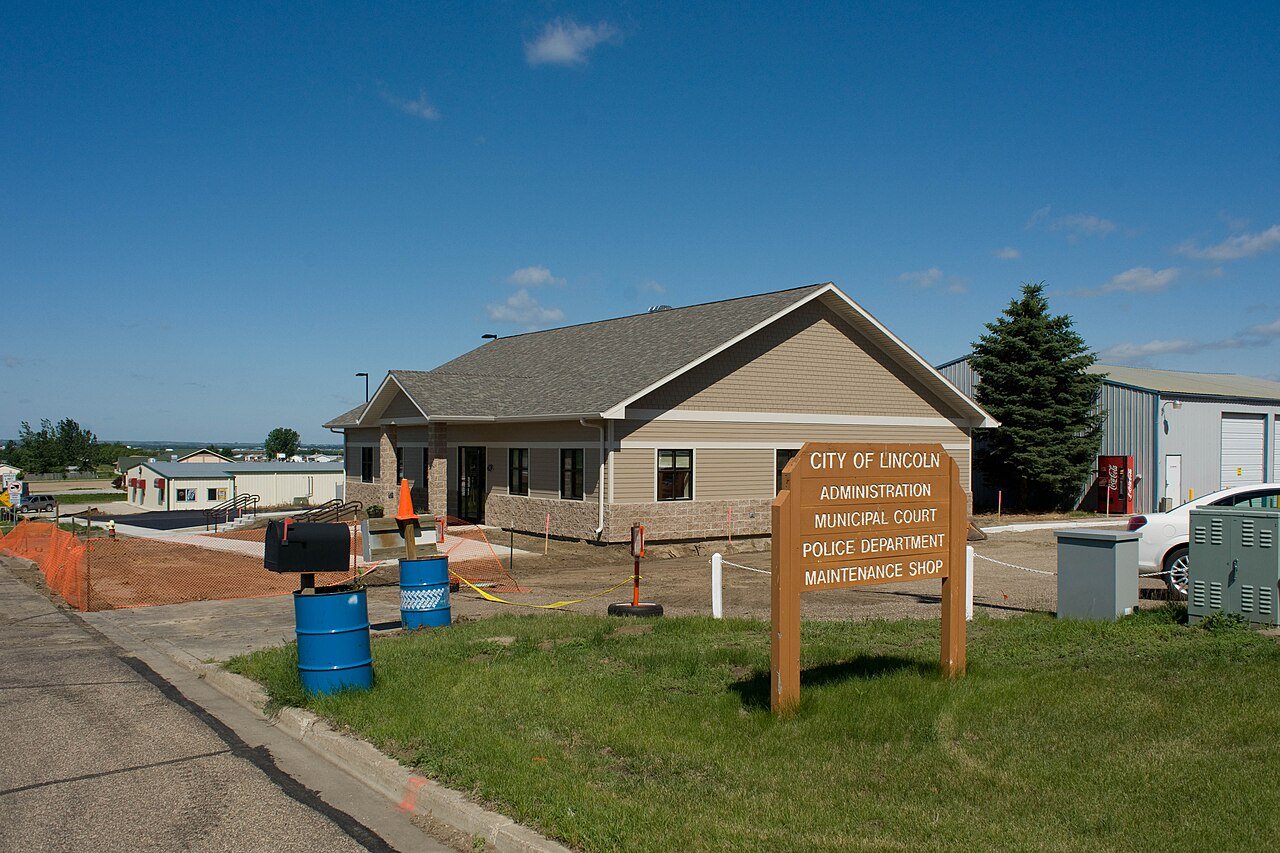
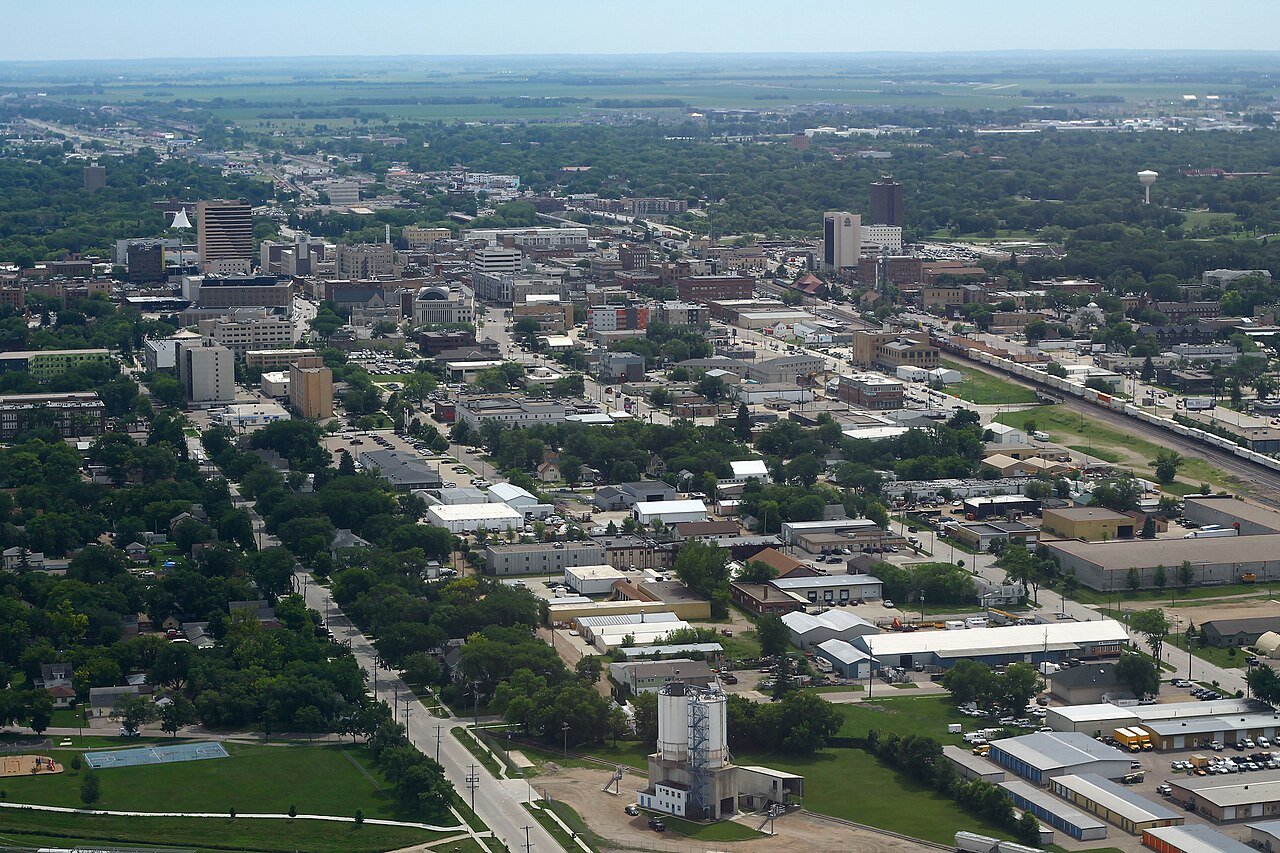
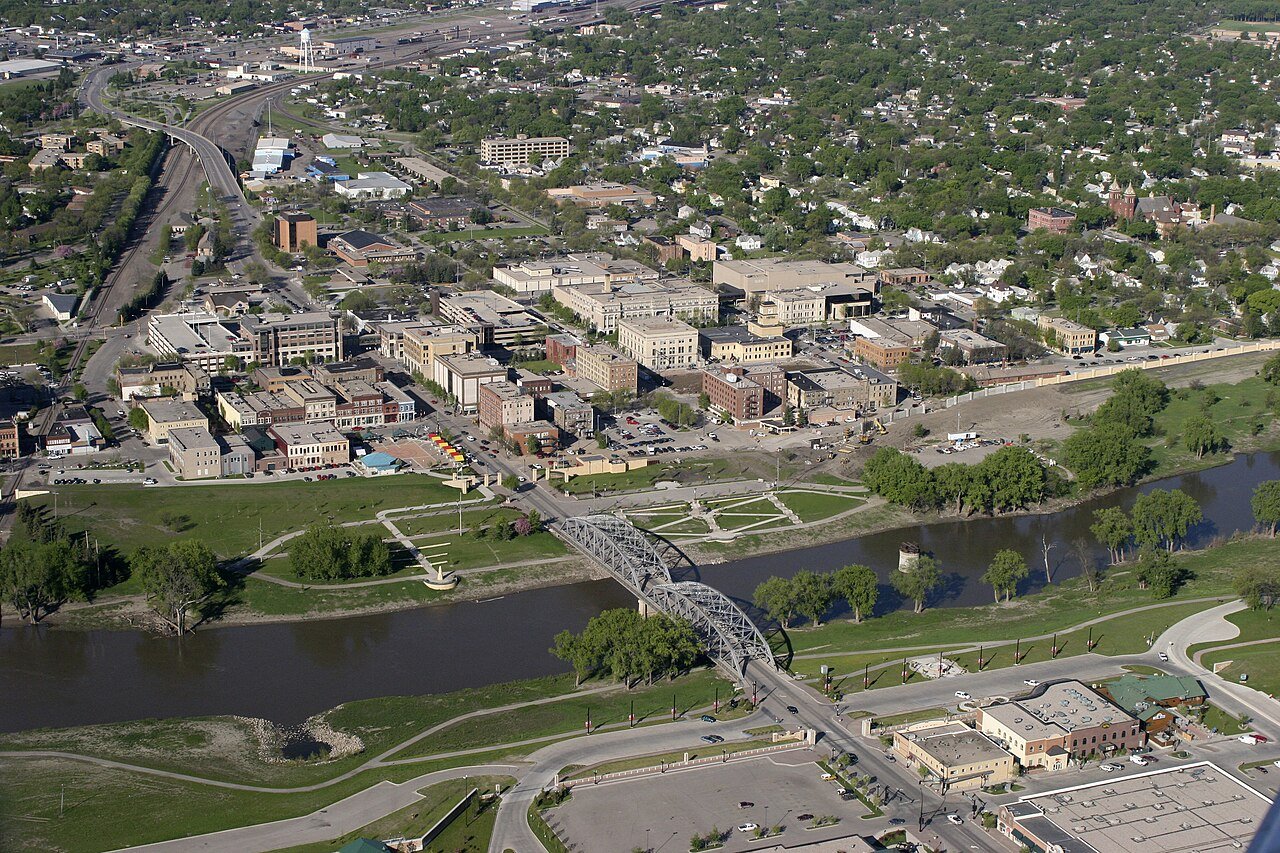
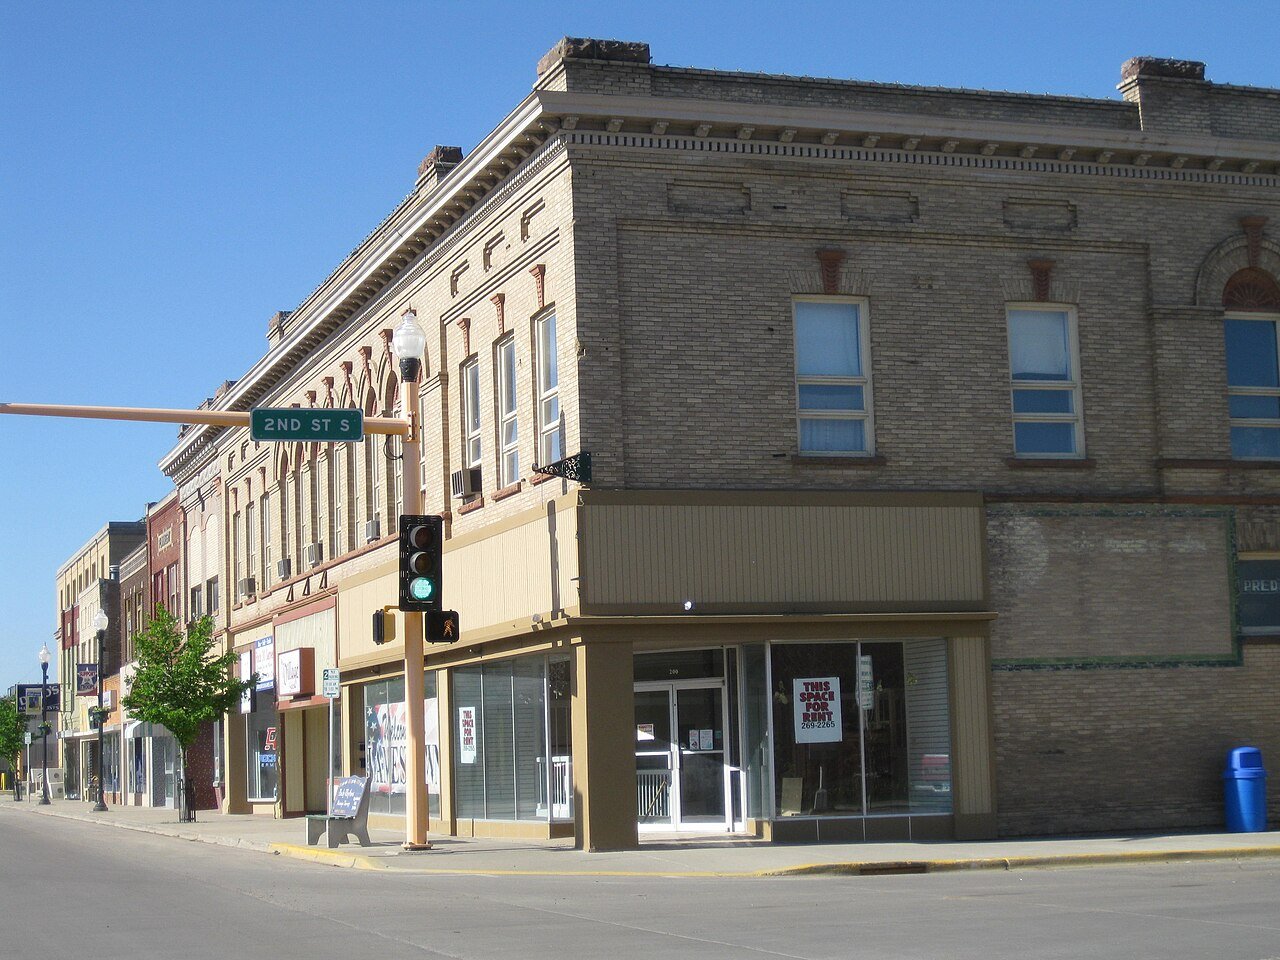
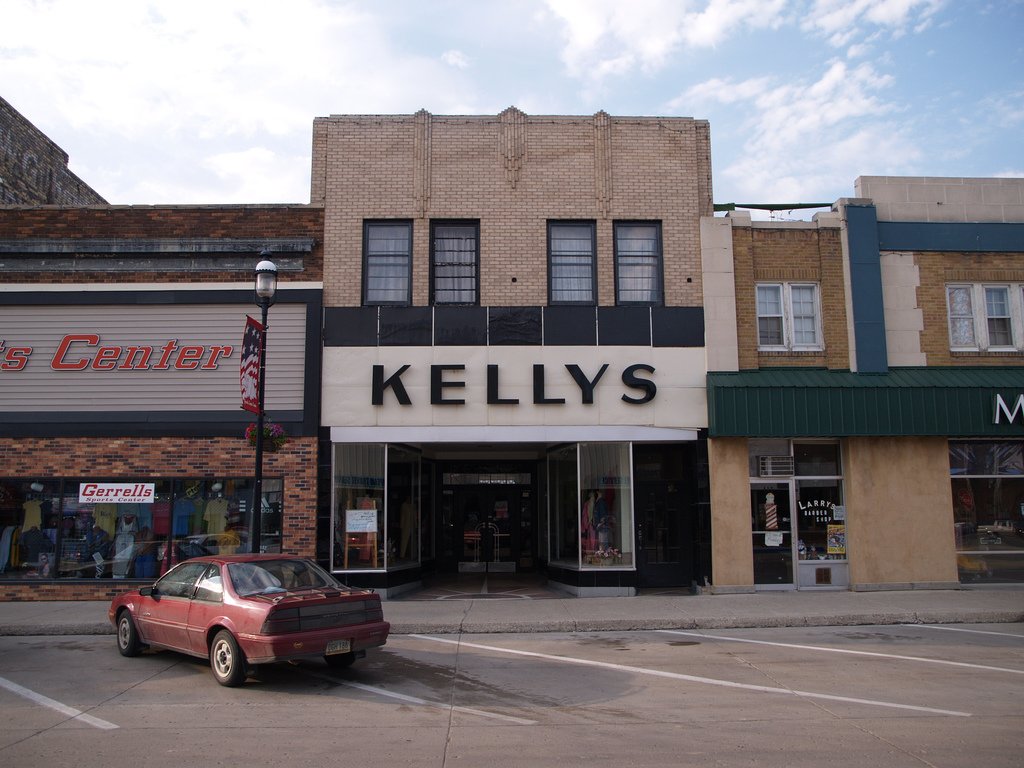
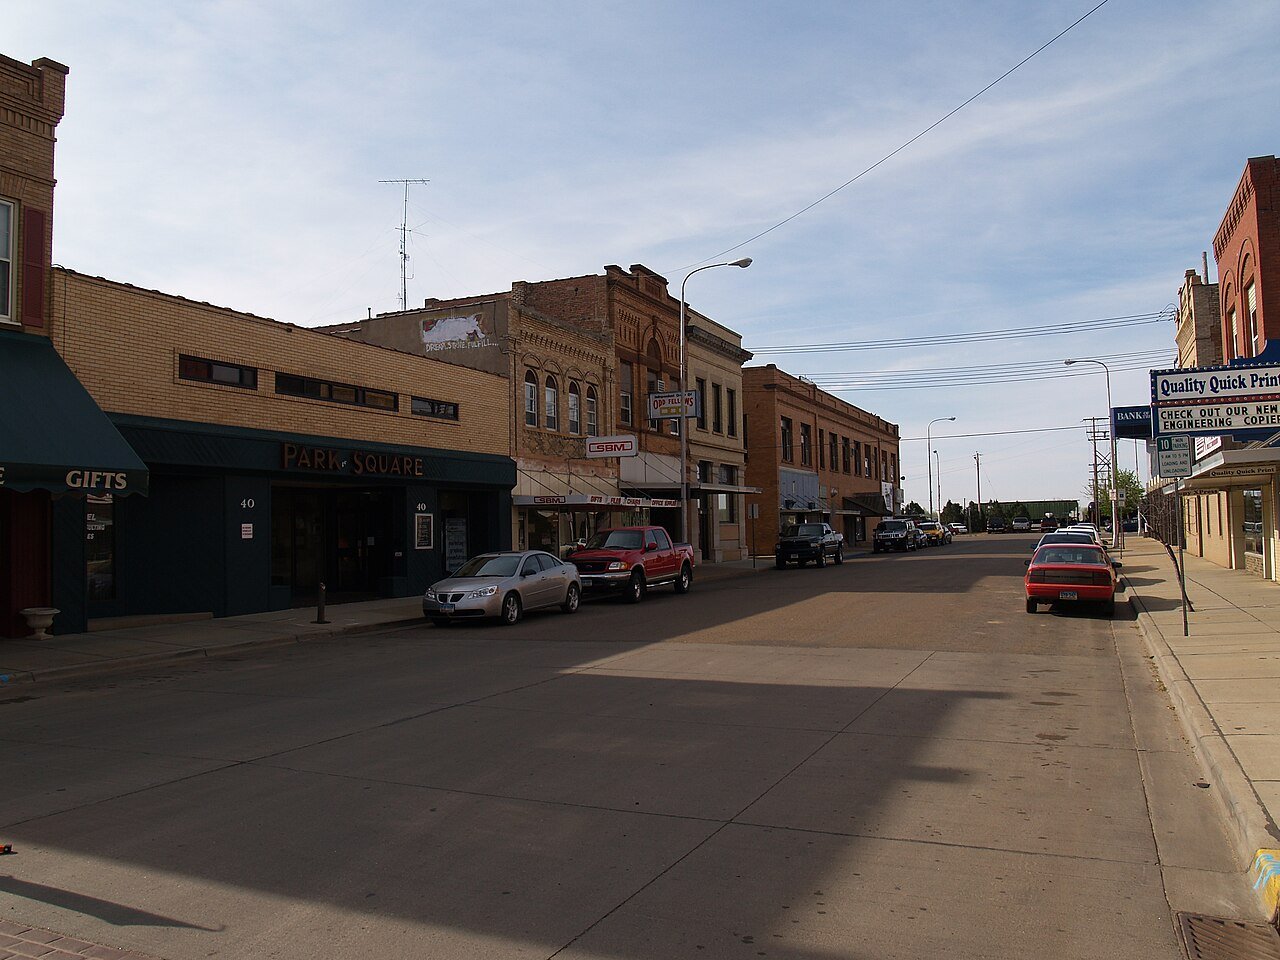
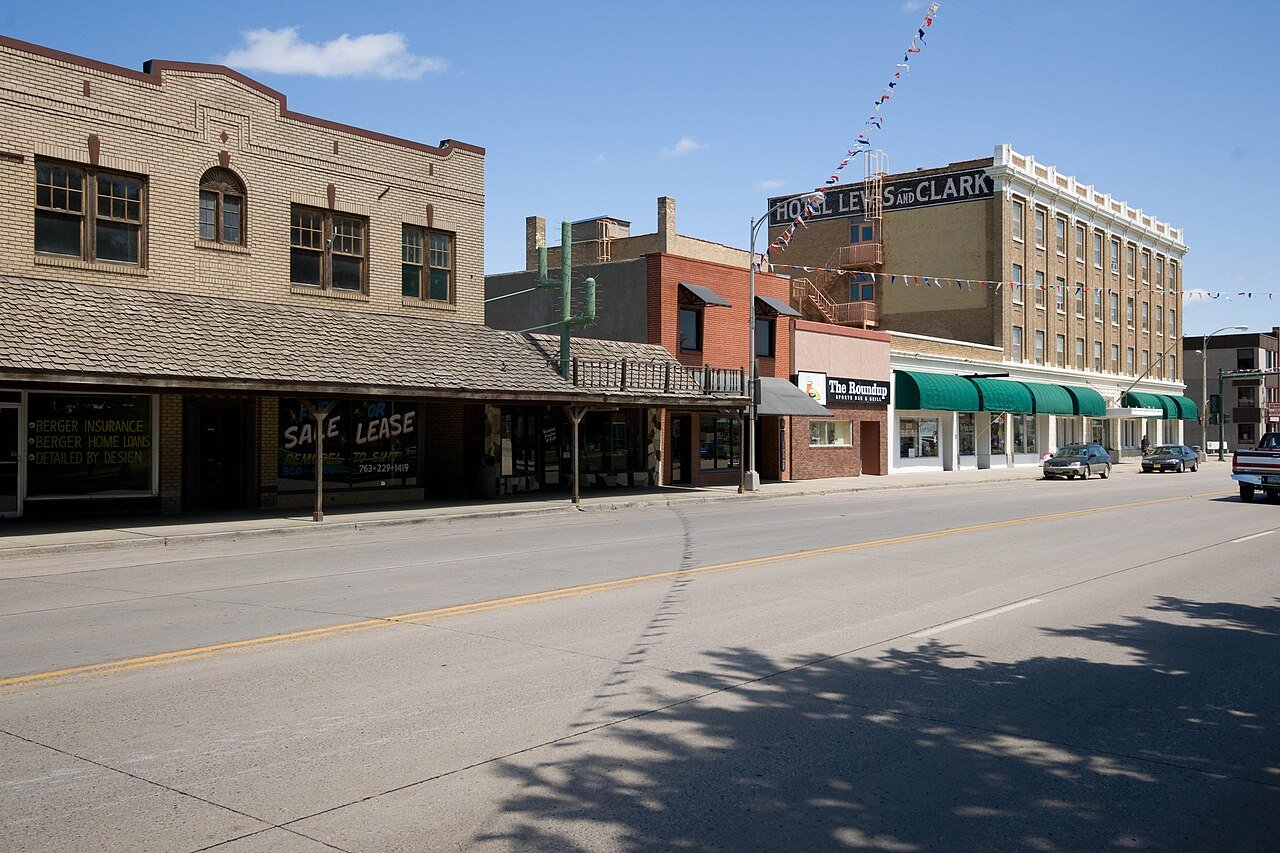
Only towns with at least 2,500 residents are ranked; Census estimates for smaller places are too uncertain. Population and income: U.S. Census Bureau American Community Survey 5-year estimates. Town photos: Wikimedia Commons, credited on each town’s page.