How Mount Pleasant compares across Missouri
Mount Pleasant is ranked on 33 lists against the 256 Missouri towns with 2,500+ residents.
Faster-rising prices than 92% of Missouri
Not better or worse, just Mount Pleasant’s character, from the lists where neither end is the “good” one. The most distinctive come first.
Mount Pleasant lands in the top half on 3 of 19 lists
Each dot is Mount Pleasant’s spot on one list: the left end is #1 in MO, the right end is last. Areas where Mount Pleasant does best come first.
The lists Mount Pleasant does best on
Each list ranks every MO town with 2,500+ residents. Tap one to see the whole list with Mount Pleasant marked.
Every MO list, and where Mount Pleasant lands
41 lists from Census, school, health, library, crime, climate and land data. Tap any list to see every town on it.
Cost of living
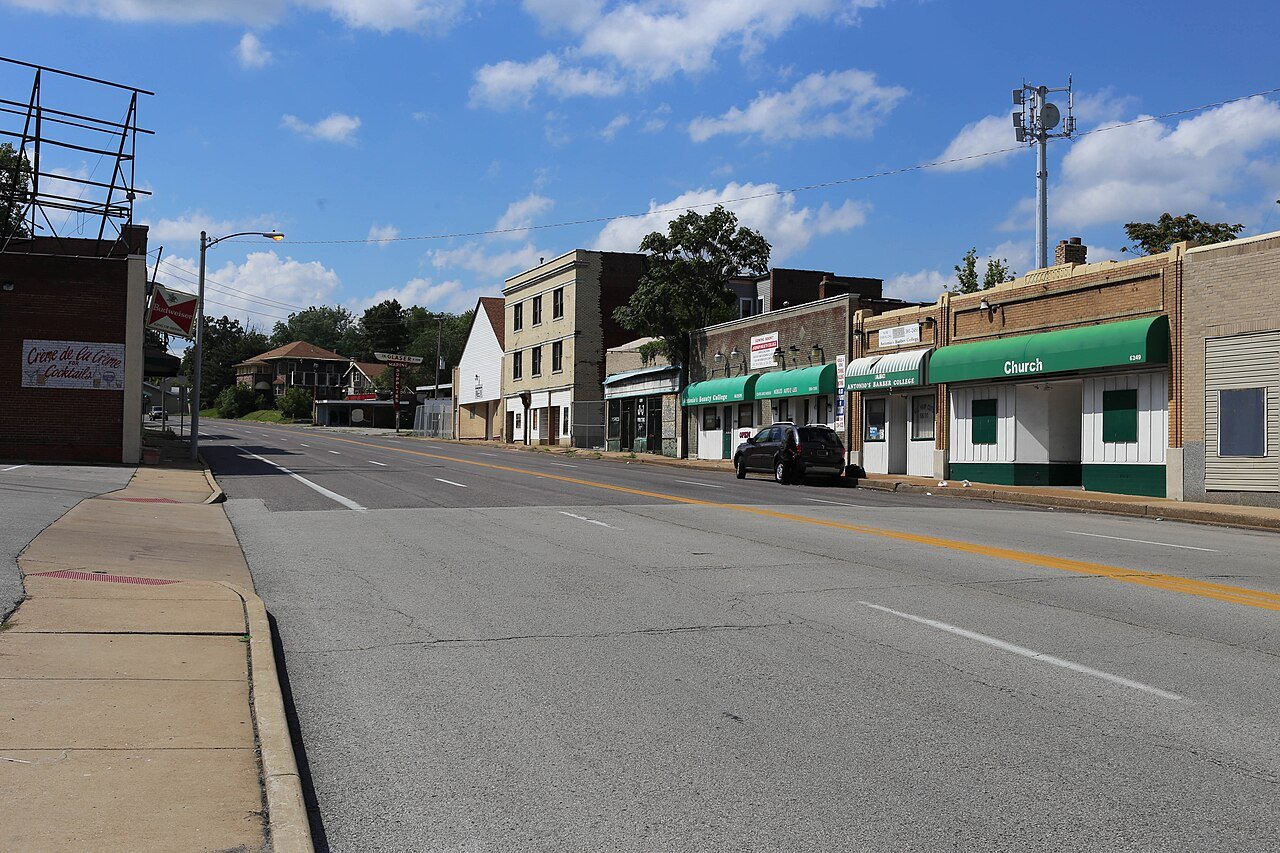 Most affordable#1 Pine Lawn · 0.9 yrs
#85
Most affordable#1 Pine Lawn · 0.9 yrs
#85
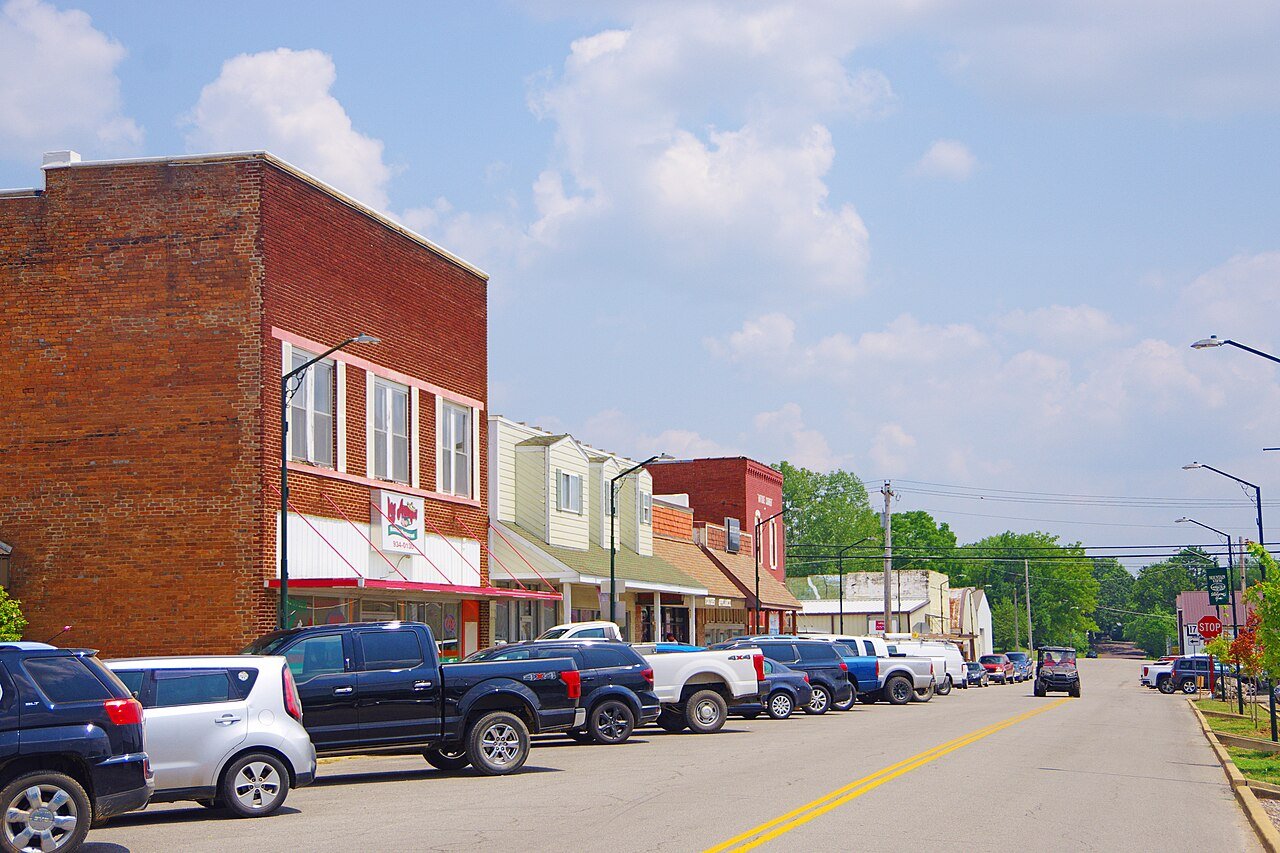 Cheapest rent#1 Mountain View · $424/mo
#106
Cheapest rent#1 Mountain View · $424/mo
#106
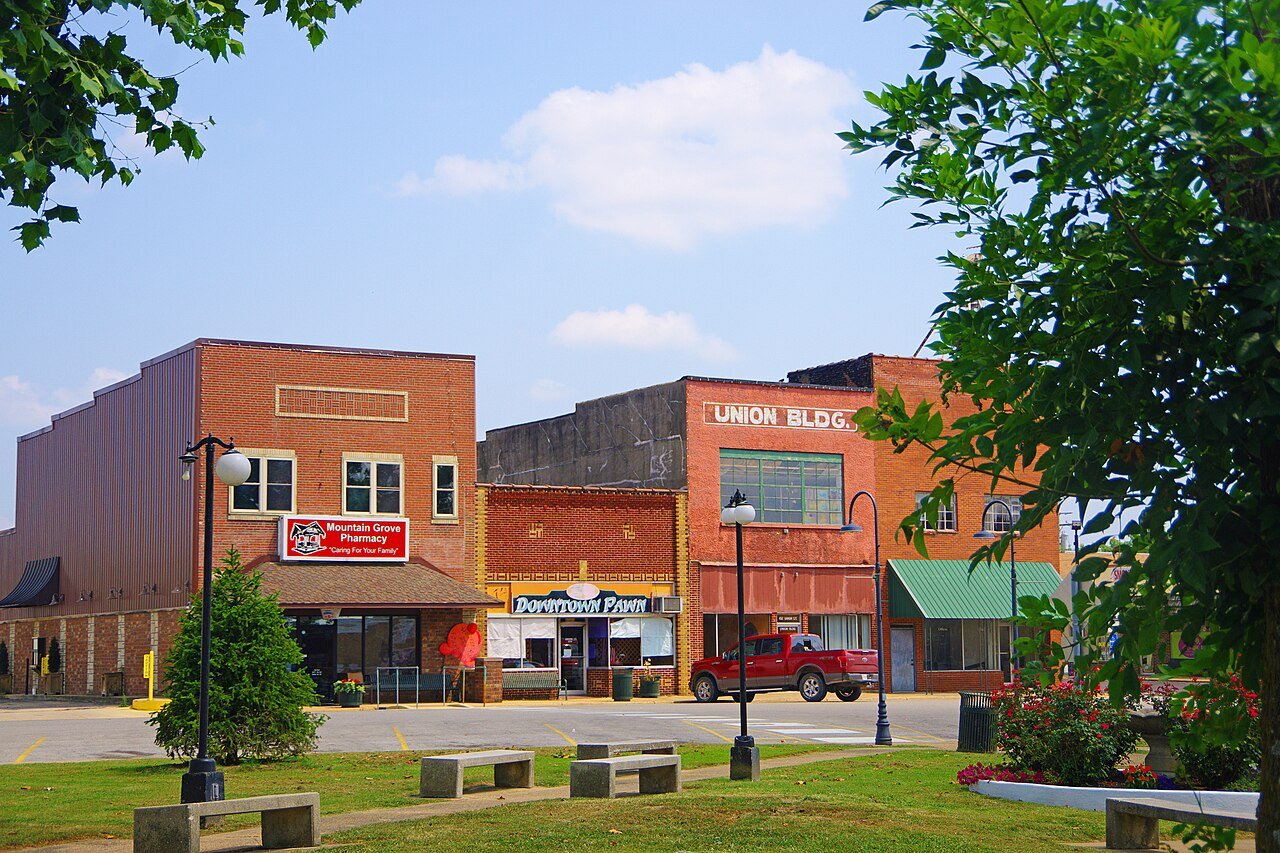 Lowest property tax#1 Mountain Grove · $438/yr
#78
Lowest property tax#1 Mountain Grove · $438/yr
#78
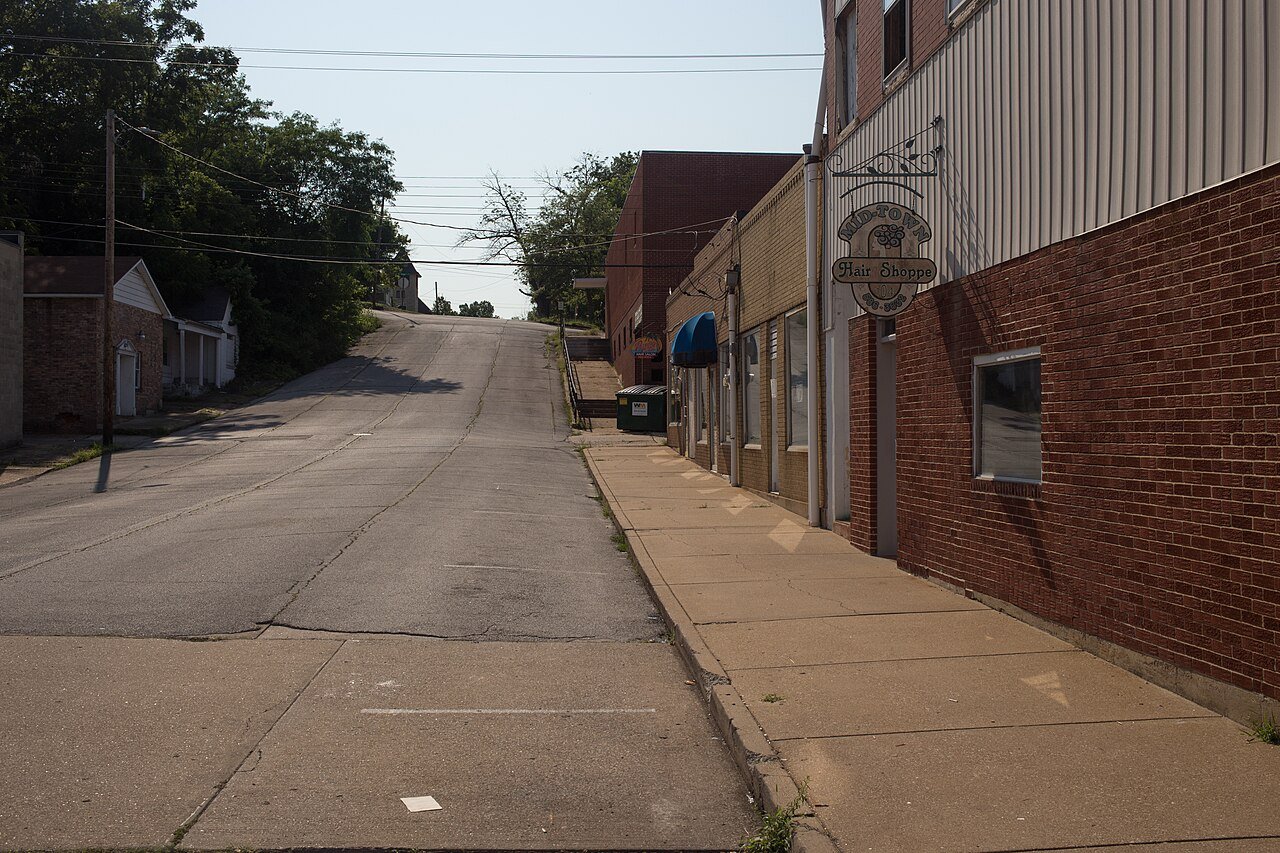 Rent easiest to afford#1 De Soto · 20.3%
Health
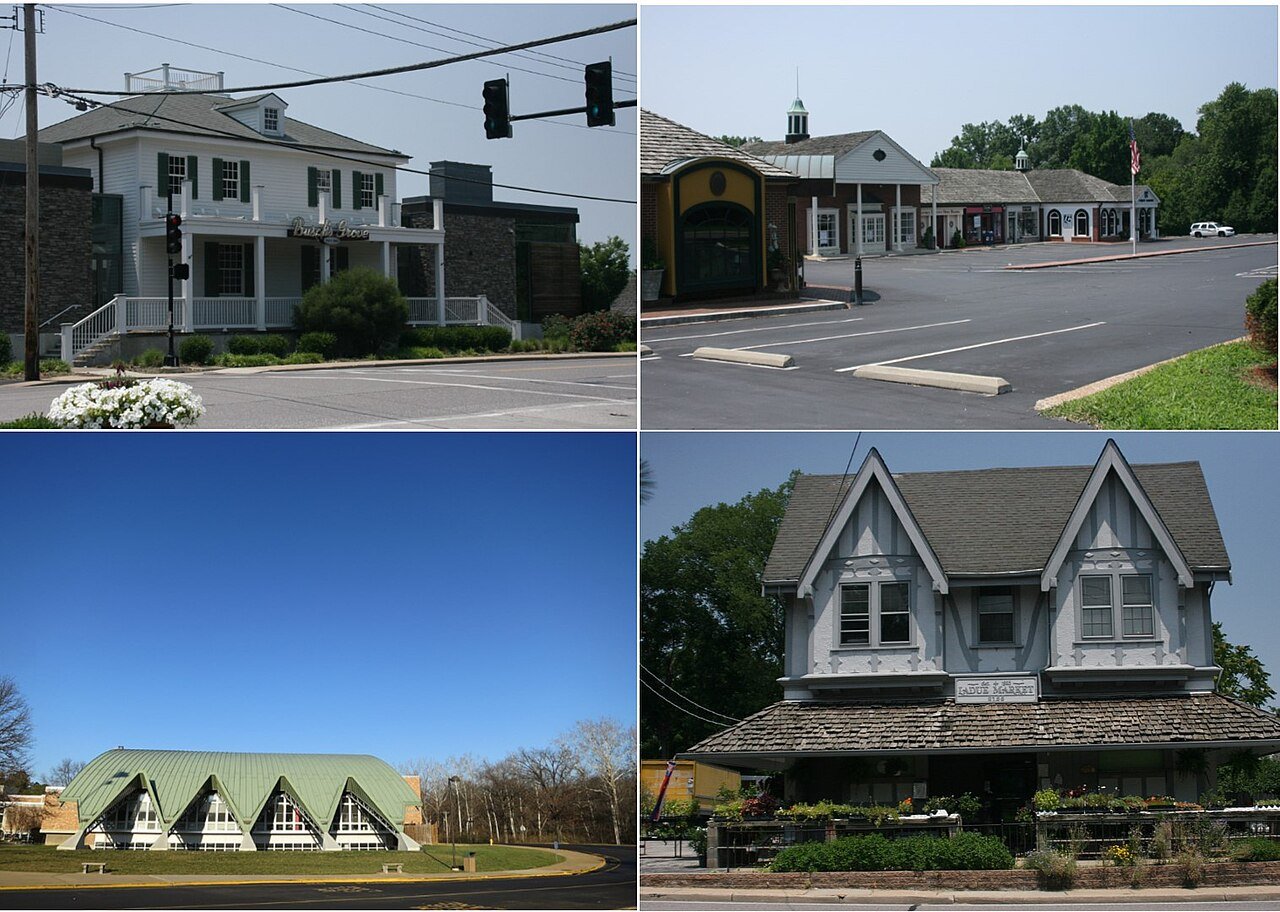 Healthiest#1 Ladue · 99 / 100
#228
Healthiest#1 Ladue · 99 / 100
#228
 Lowest obesity#1 Town and Country · 23%
#223
Fewest smokers#1 Town and Country · 7%
#226
Lowest obesity#1 Town and Country · 23%
#223
Fewest smokers#1 Town and Country · 7%
#226
 Most active#1 Glendale · 16%
#220
Fewest uninsured#1 Ladue · 3%
#174
Most active#1 Glendale · 16%
#220
Fewest uninsured#1 Ladue · 3%
#174
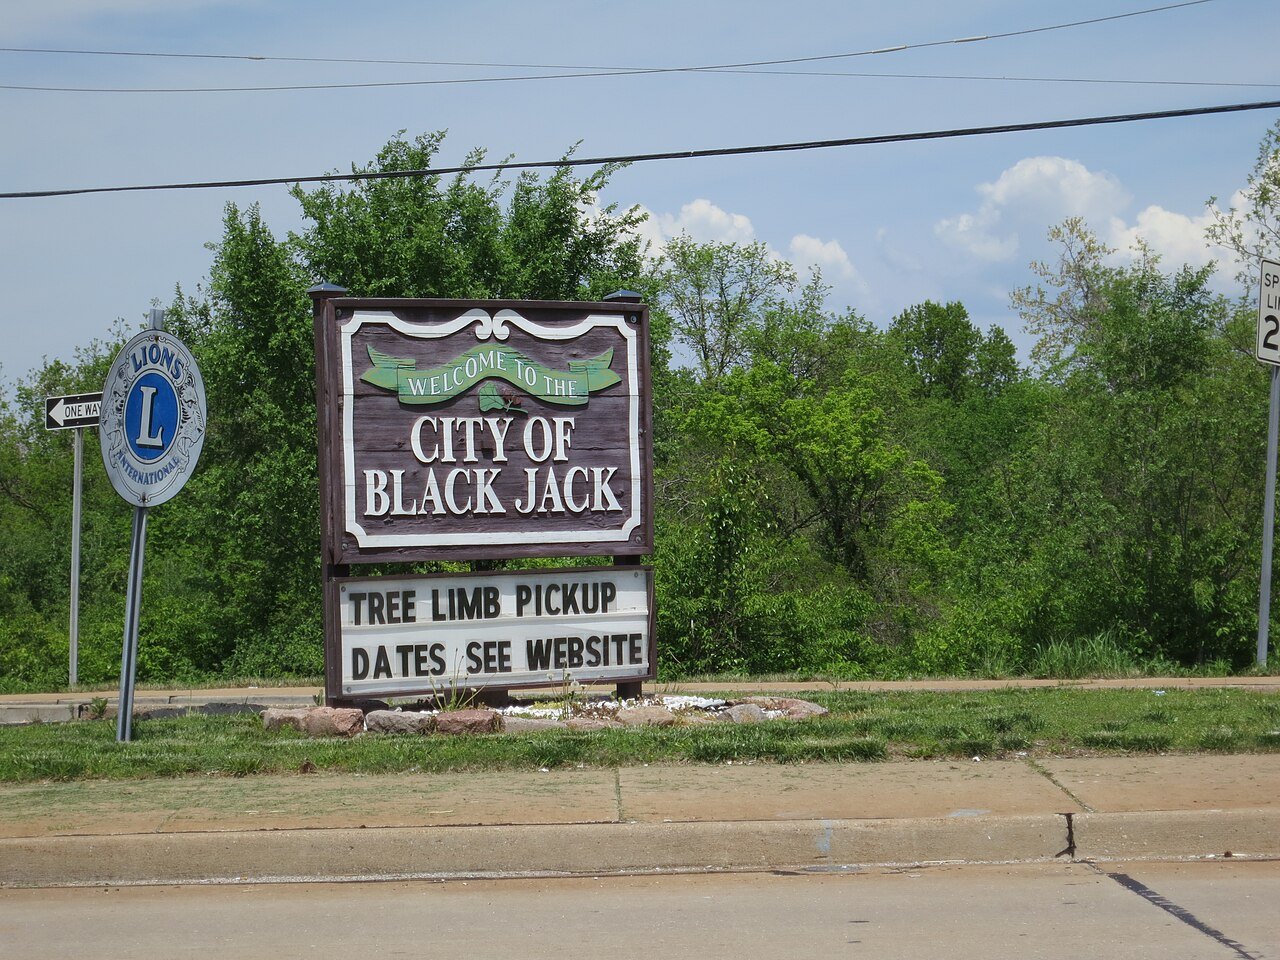 Lowest depression#1 Black Jack · 19%
#199
Lowest depression#1 Black Jack · 19%
#199
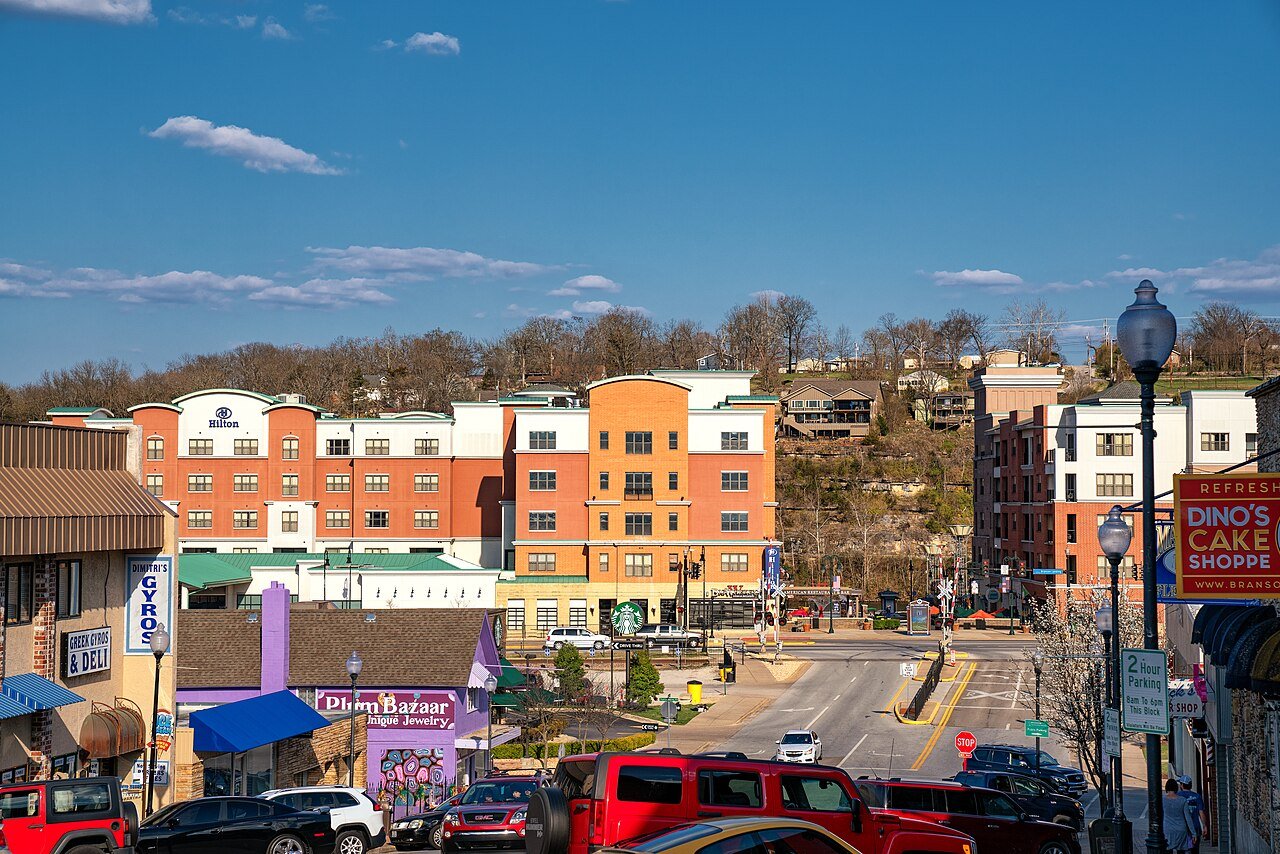 Closest to a top hospital#1 Branson · 0.0 mi
#181
Closest to a top hospital#1 Branson · 0.0 mi
#181 
People
Most educated#1 Glendale · 90.1%
#193
F
Youngest#1 Fort Leonard Wood · 20.5
#100
 Oldest#1 Osage Beach · 59.4
#158
Oldest#1 Osage Beach · 59.4
#158
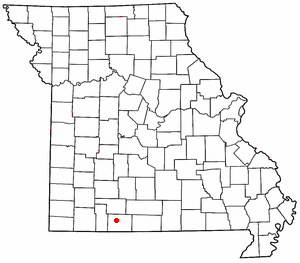 Most residents 65+#1 Forsyth · 36.4%
#53
Most residents 65+#1 Forsyth · 36.4%
#53
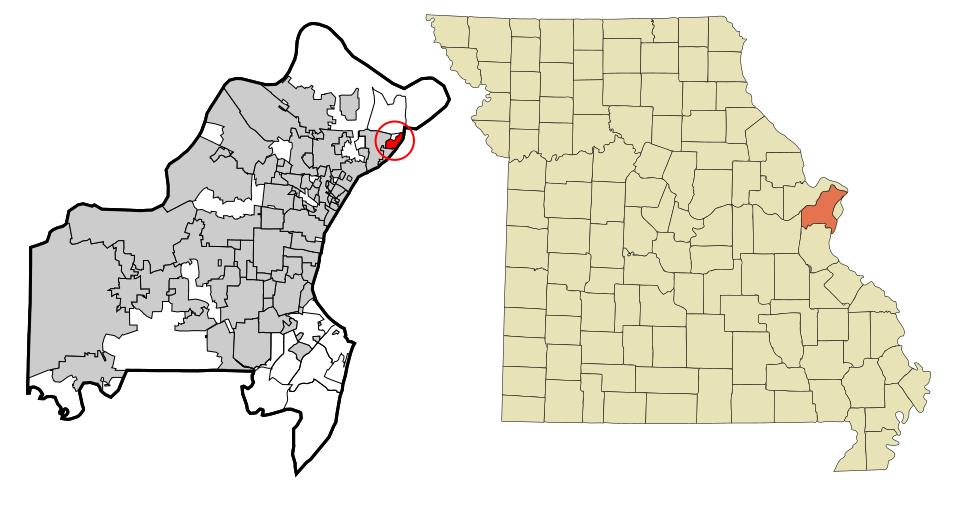 Most kids#1 Glasgow Village · 40%
#122
Most kids#1 Glasgow Village · 40%
#122 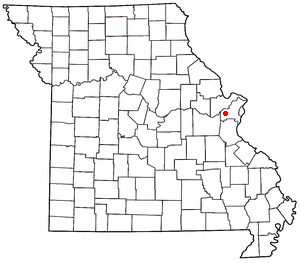
Outdoors
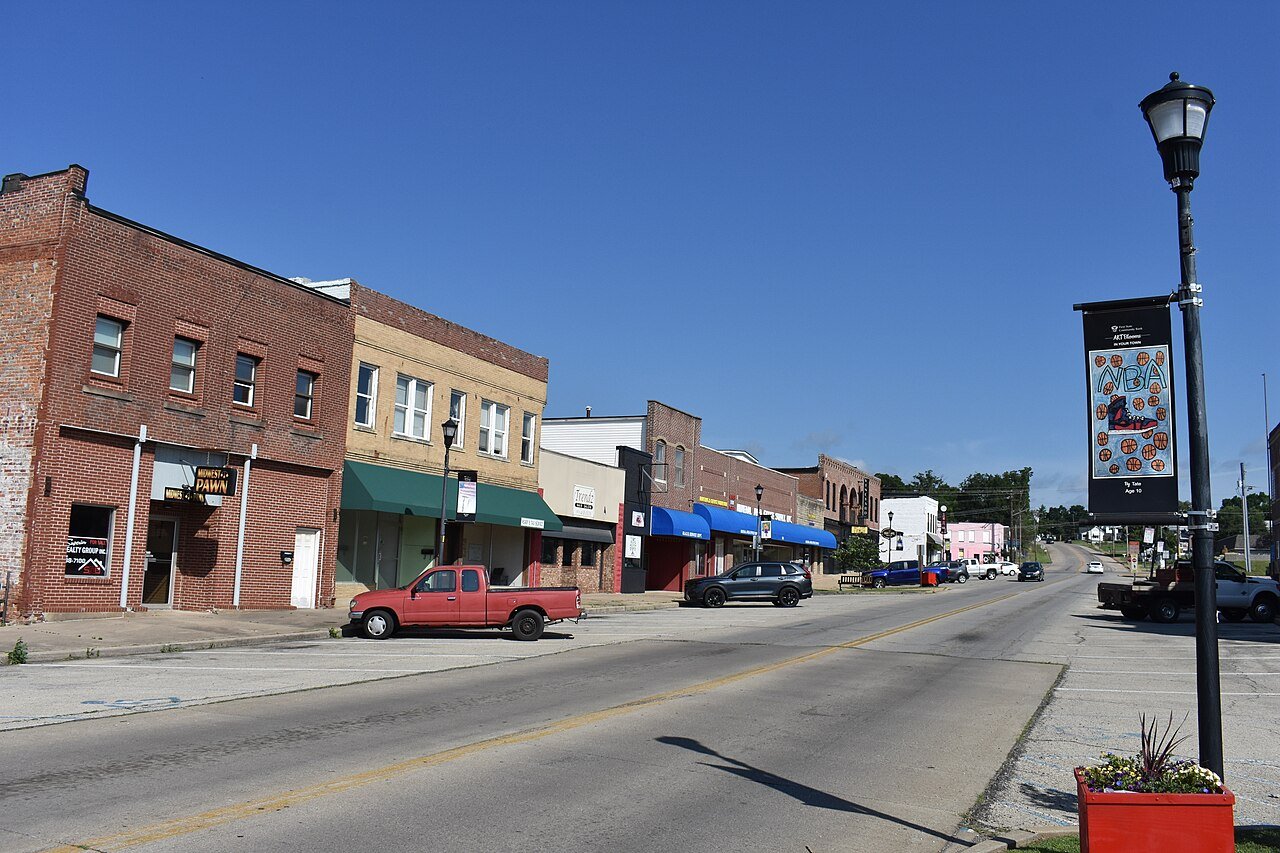 Most conserved land#1 Park Hills · 63%
#157
Most trails#1 Park Hills · 3.3 mi / sq mi
#140
Most walkable#1 Pine Lawn · 213 / sq mi
#241
Most conserved land#1 Park Hills · 63%
#157
Most trails#1 Park Hills · 3.3 mi / sq mi
#140
Most walkable#1 Pine Lawn · 213 / sq mi
#241 Getting around
F Shortest commute#1 Fort Leonard Wood · 9 min #234Climate
U Snowiest#1 Union · 29 in #158 Least snow#1 Salem · 1.3 in
#96
Least snow#1 Salem · 1.3 in
#96
 Mildest winters#1 Caruthersville · 29.5°
#136
Mildest winters#1 Caruthersville · 29.5°
#136
 Hottest summers#1 Carl Junction · 90.4°
#40
U
Coolest summers#1 Union · 85.4°
#195
Longest growing season#1 Caruthersville · 230 days
#192
Hottest summers#1 Carl Junction · 90.4°
#40
U
Coolest summers#1 Union · 85.4°
#195
Longest growing season#1 Caruthersville · 230 days
#192
 Wettest#1 Kennett · 51 in
#85
Wettest#1 Kennett · 51 in
#85 Housing
Vacation-home towns#1 Osage Beach · 57.2%
#182
N
Most new homes#1 North Kansas City · 27.0 per 1,000
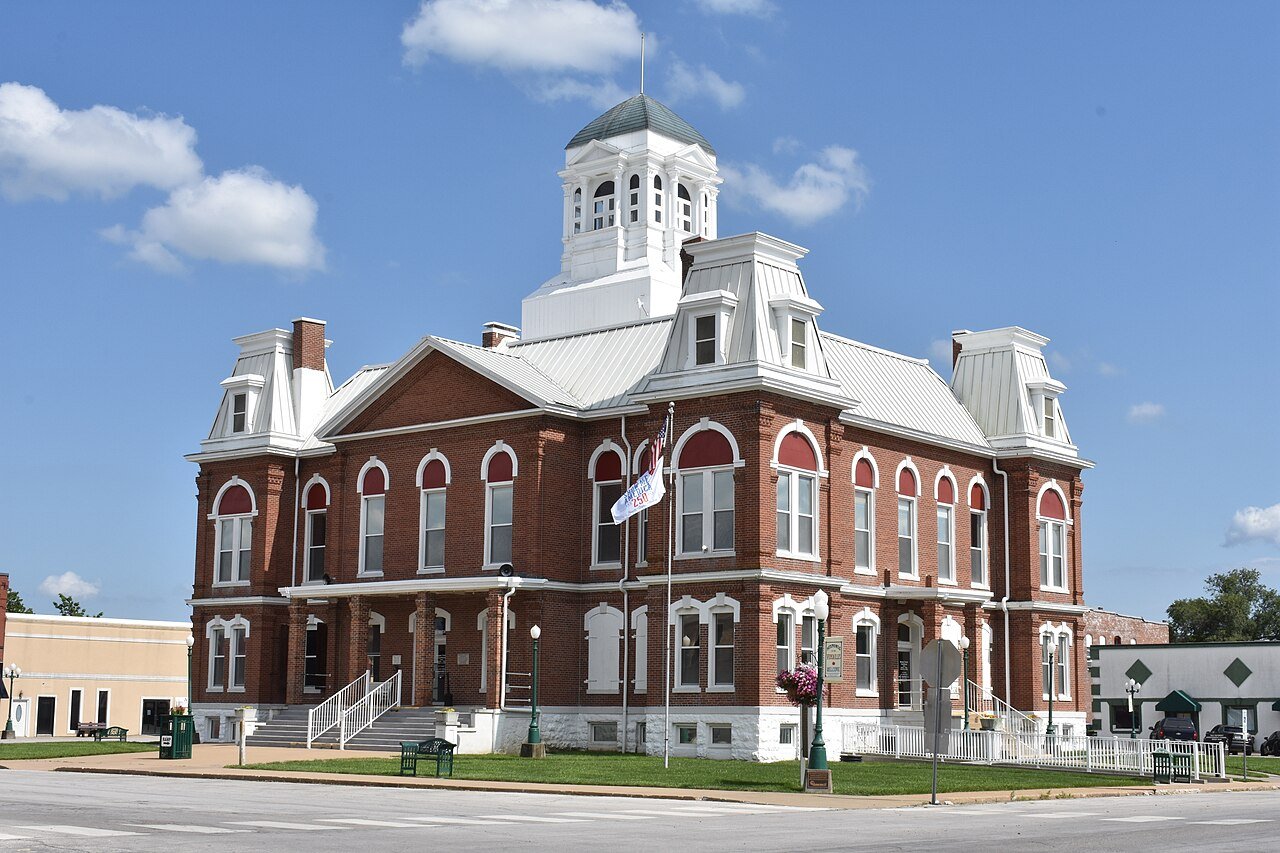 Fastest-rising home prices#1 Versailles · +110.5%
#18
Housing hasn't kept up#1 Forsyth · 13.6 per home
Fastest-rising home prices#1 Versailles · +110.5%
#18
Housing hasn't kept up#1 Forsyth · 13.6 per home
Libraries
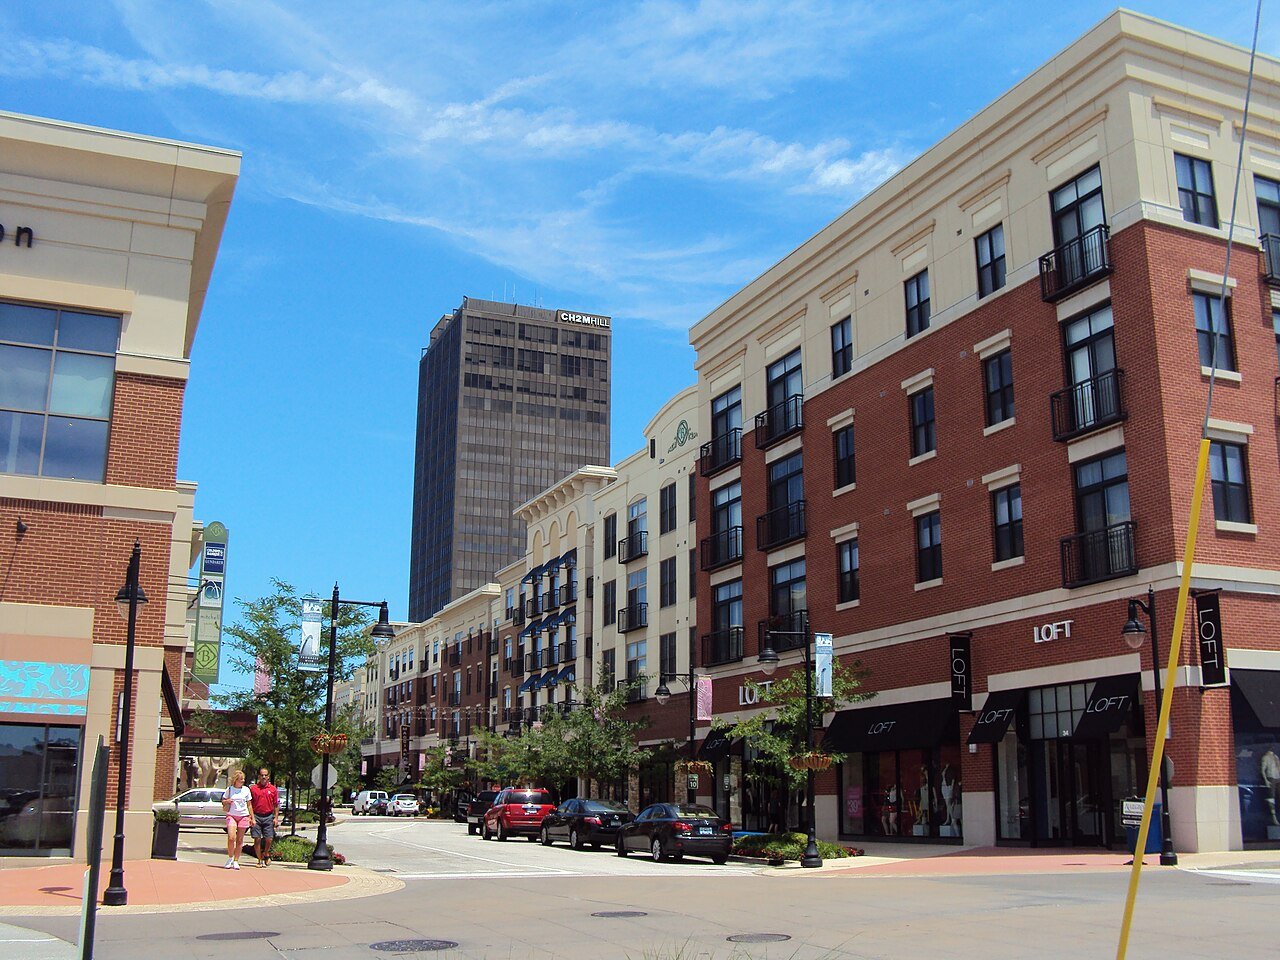 Most-used libraries#1 Richmond Heights · 16.6 per resident
N
Most library borrowing#1 North Kansas City · 30.2 per resident
N
Best libraries for kids#1 North Kansas City · 61.4 per child
Most-used libraries#1 Richmond Heights · 16.6 per resident
N
Most library borrowing#1 North Kansas City · 30.2 per resident
N
Best libraries for kids#1 North Kansas City · 61.4 per child
Safety
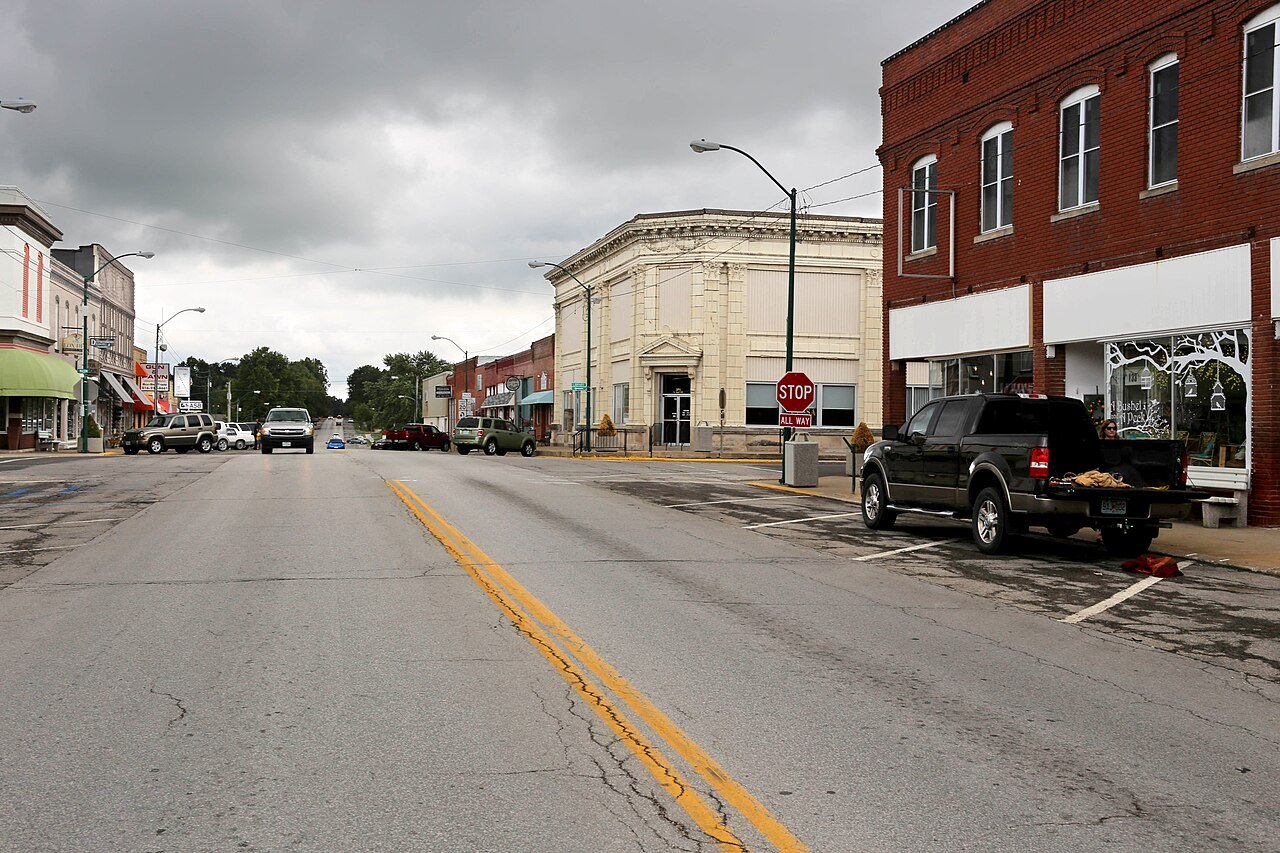 Safest#1 Odessa · 4.4
The number on the right is Mount Pleasant’s spot. All of Missouri’s rankings, with the map → · National lists and other states: all rankings.
Do the numbers ring true?
The lists count what can be counted. Neighbors know the rest.
Your answer becomes a post in Town Square.
- 2,500+ residents. Census estimates for smaller towns carry margins of error too wide to rank fairly, so they sit out every MO list.
- One town, one row. A city that is both a city and a town in Census data, or a village inside a town, is counted once.
- Ties share a rank. Towns on one weather station, one school district or one CDC estimate share a figure, so they share a spot (T).
- No “worst” lists. Lists rank toward the good end, and share cards are made only for the top half. Age, snow and the like are character, not grades.
U.S. Census Bureau (American Community Survey 5-year, 2010 and 2020 censuses, Building Permits Survey), U.S. Department of Education, FBI Uniform Crime Reporting, CDC PLACES, Medicare Care Compare, IMLS Public Libraries Survey, FHFA House Price Index, NOAA U.S. Climate Normals 1991–2020, USGS PAD-US and OpenStreetMap. Each list explains its own method.