AZArizona rankings

Towns where housing hasn't kept up with growth in Arizona

Ranked by how many new residents each town gained for every new home it permitted between the 2010 and 2020 censuses. 49 towns with 2,500+ residents.
U.S. Census ACS 2020–2024 5-year

#TownNew residents per new homeResidents gainedHomes permitted
1 Clifton Clifton3,822 people 22.2 per home 622 28
2 El Mirage El Mirage36,088 people 12.5 per home 4,008 322
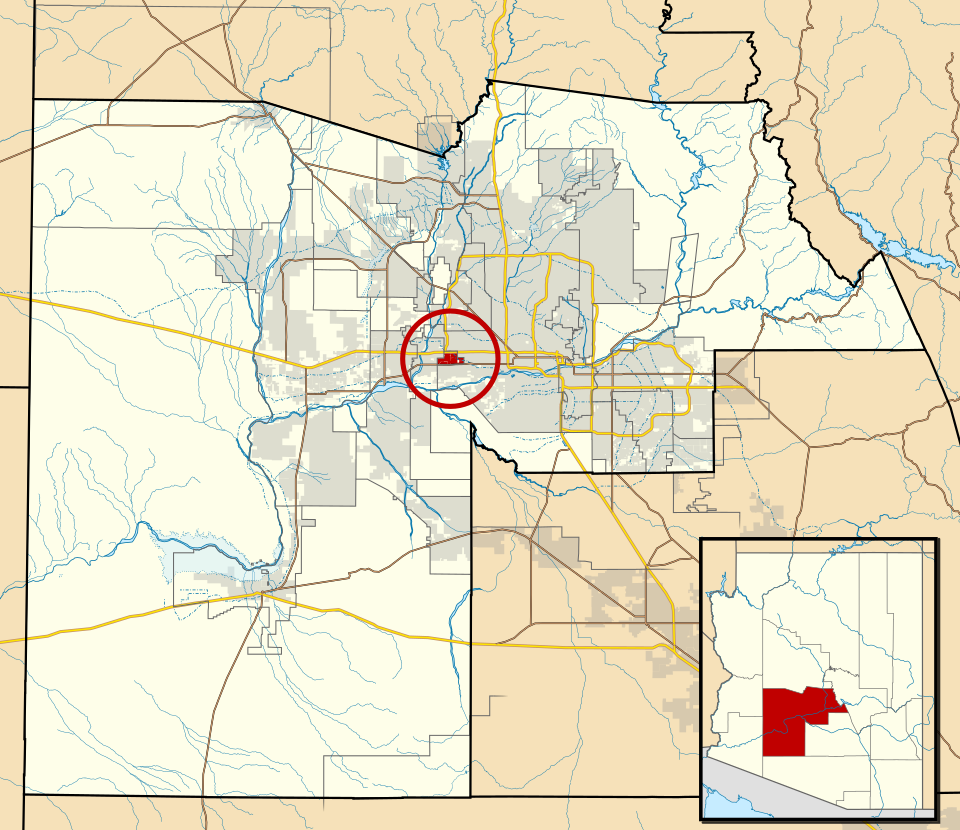
3 Map of Avondale Avondale92,477 people 10.4 per home 13,096 1,260
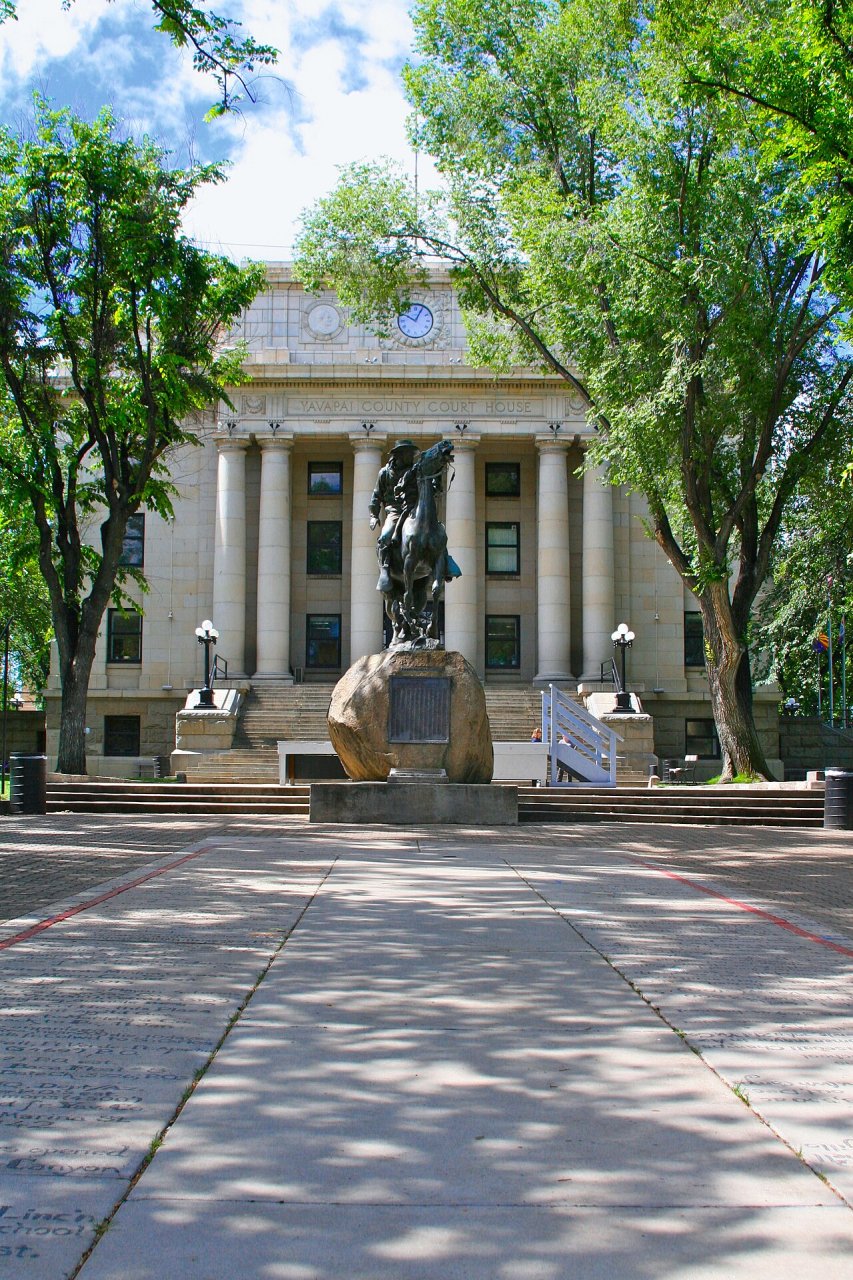
4 Camp Verde Camp Verde12,521 people 8.4 per home 1,274 152
5 Glendale Glendale252,833 people 7.6 per home 21,604 2,859
6 Parker Parker3,388 people 6.1 per home 334 55
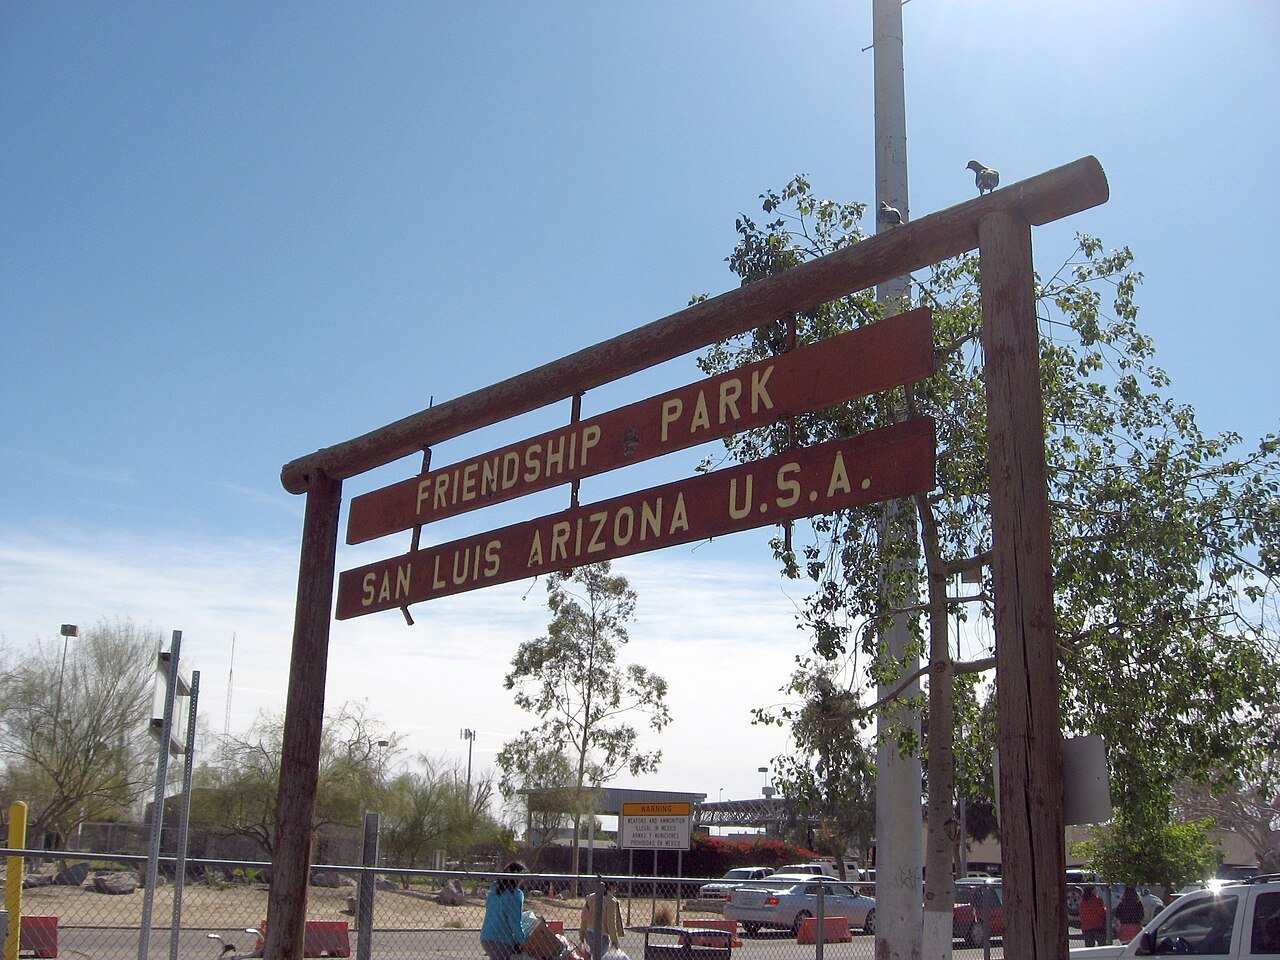
7 San Luis San Luis37,337 people 5.6 per home 9,752 1,741
8 Map of Tolleson Tolleson7,668 people 5.1 per home 671 133
9 Coolidge Coolidge16,636 people 4.2 per home 1,393 333
10 Queen Creek Queen Creek71,867 people 4.1 per home 33,158 8,033
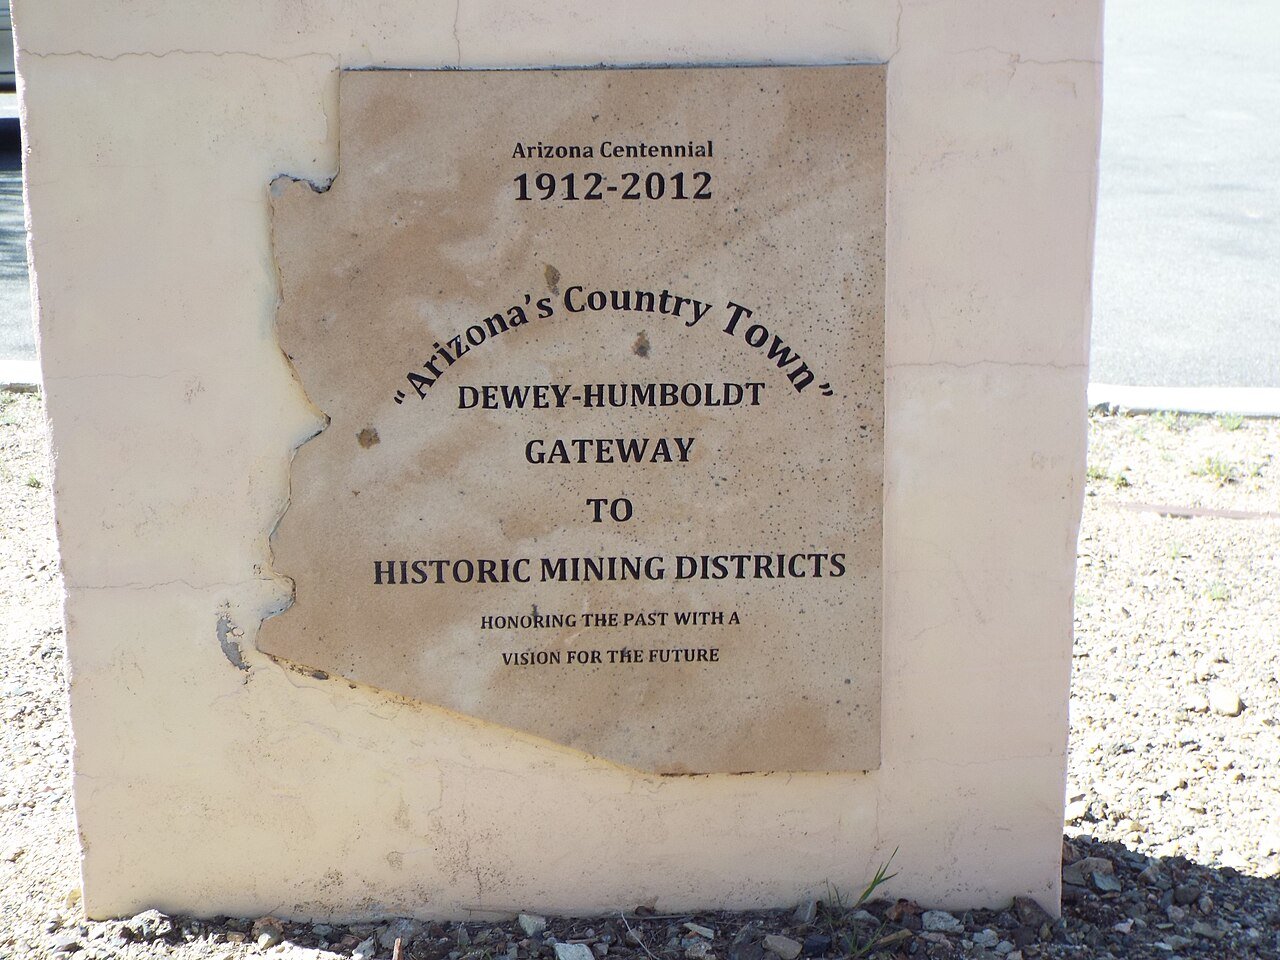
11 Dewey-Humboldt Dewey-Humboldt4,501 people 4.1 per home 432 105
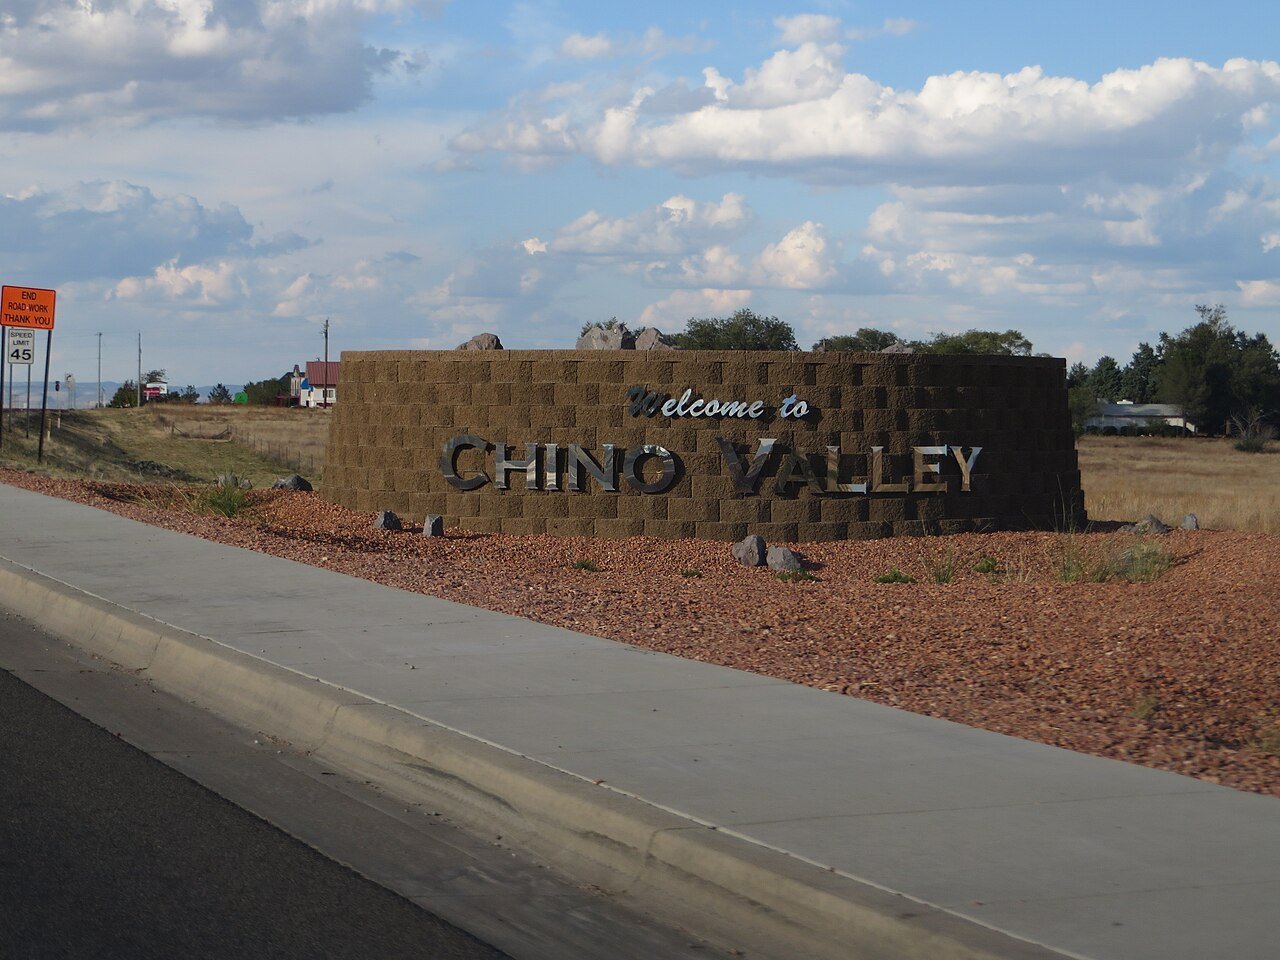
12 Chino Valley Chino Valley13,602 people 3.8 per home 2,203 582
13 Mesa Mesa511,764 people 3.7 per home 65,217 17,416
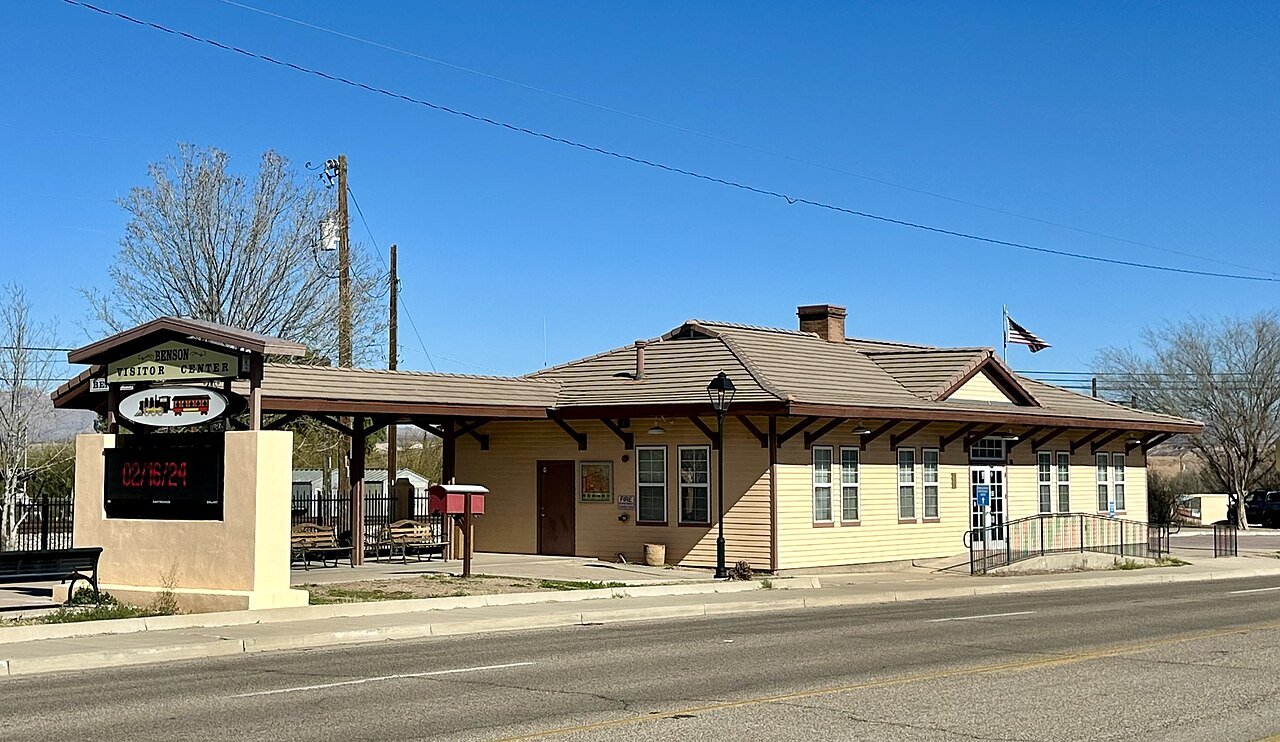
14 Benson Benson5,417 people 3.6 per home 250 69
15 Map of Snowflake Snowflake6,444 people 3.5 per home 514 148
16 Surprise Surprise154,948 people 3.4 per home 25,631 7,454
17 Oro Valley Oro Valley48,162 people 3.4 per home 6,059 1,796
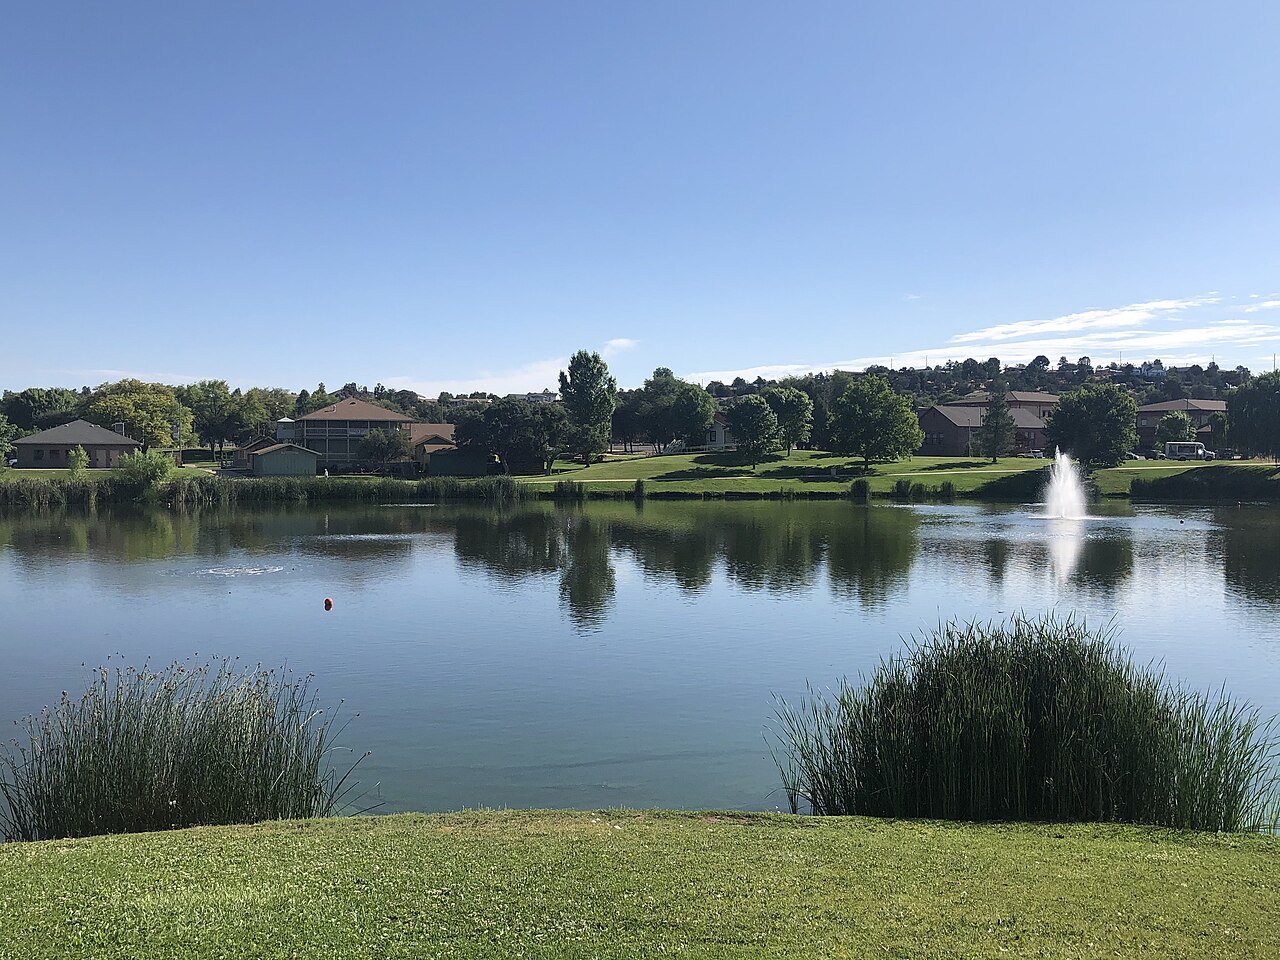
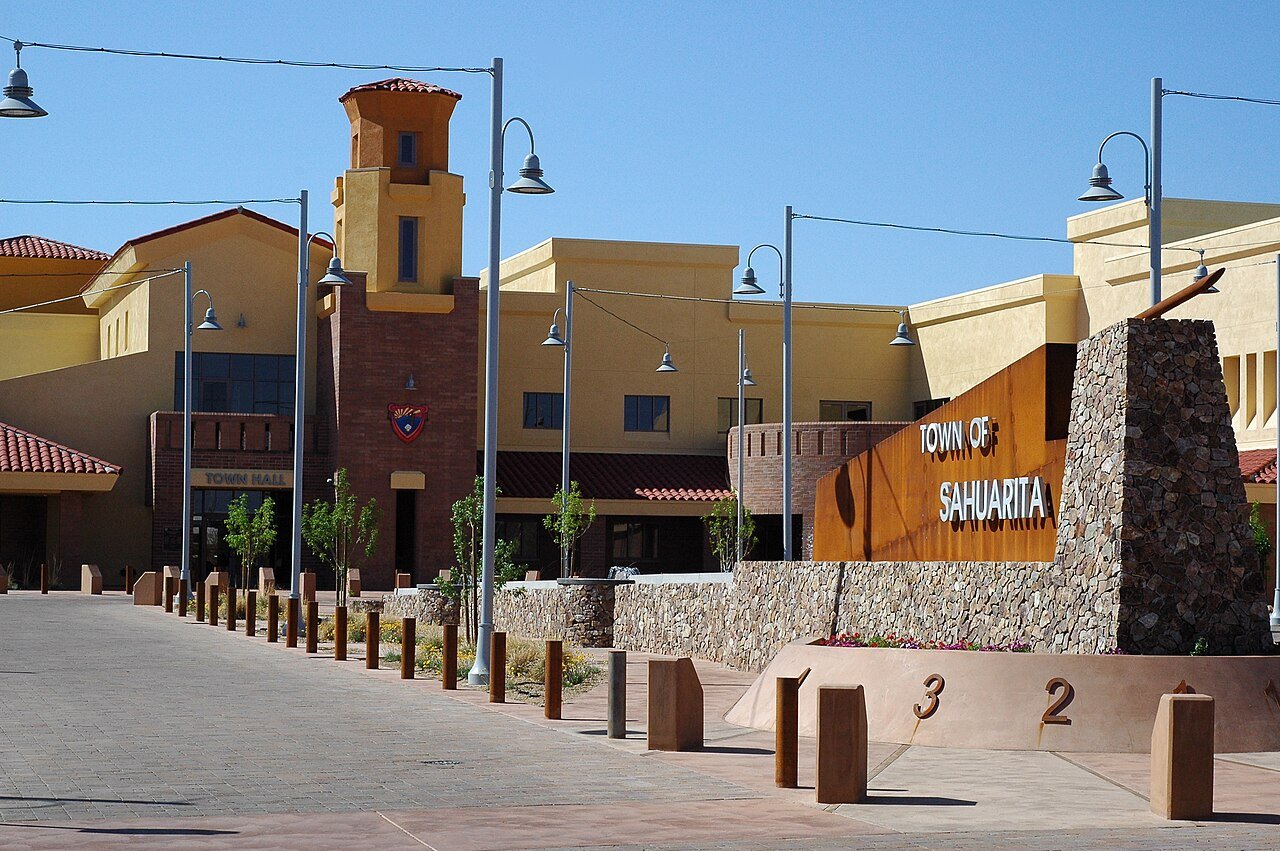
18 Sahuarita Sahuarita35,862 people 3.3 per home 8,875 2,715
19 Gilbert Gilbert280,262 people 3.2 per home 59,465 18,401
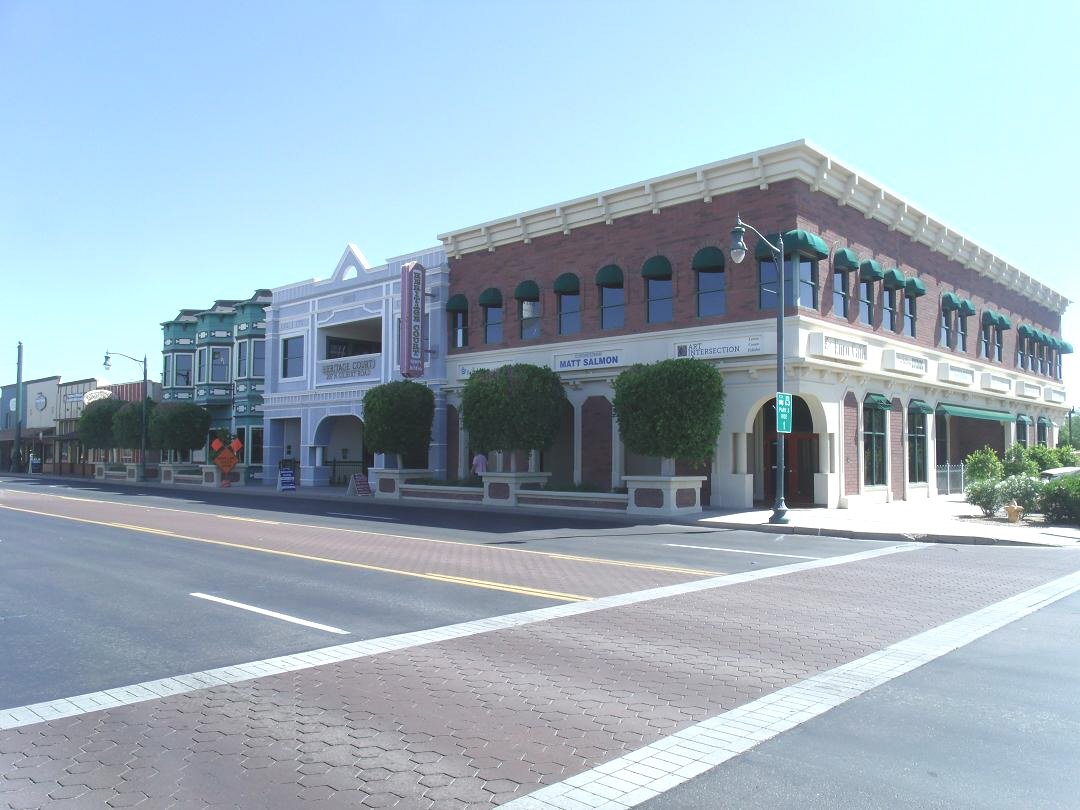
20 Buckeye Buckeye104,923 people 3.2 per home 40,626 12,756
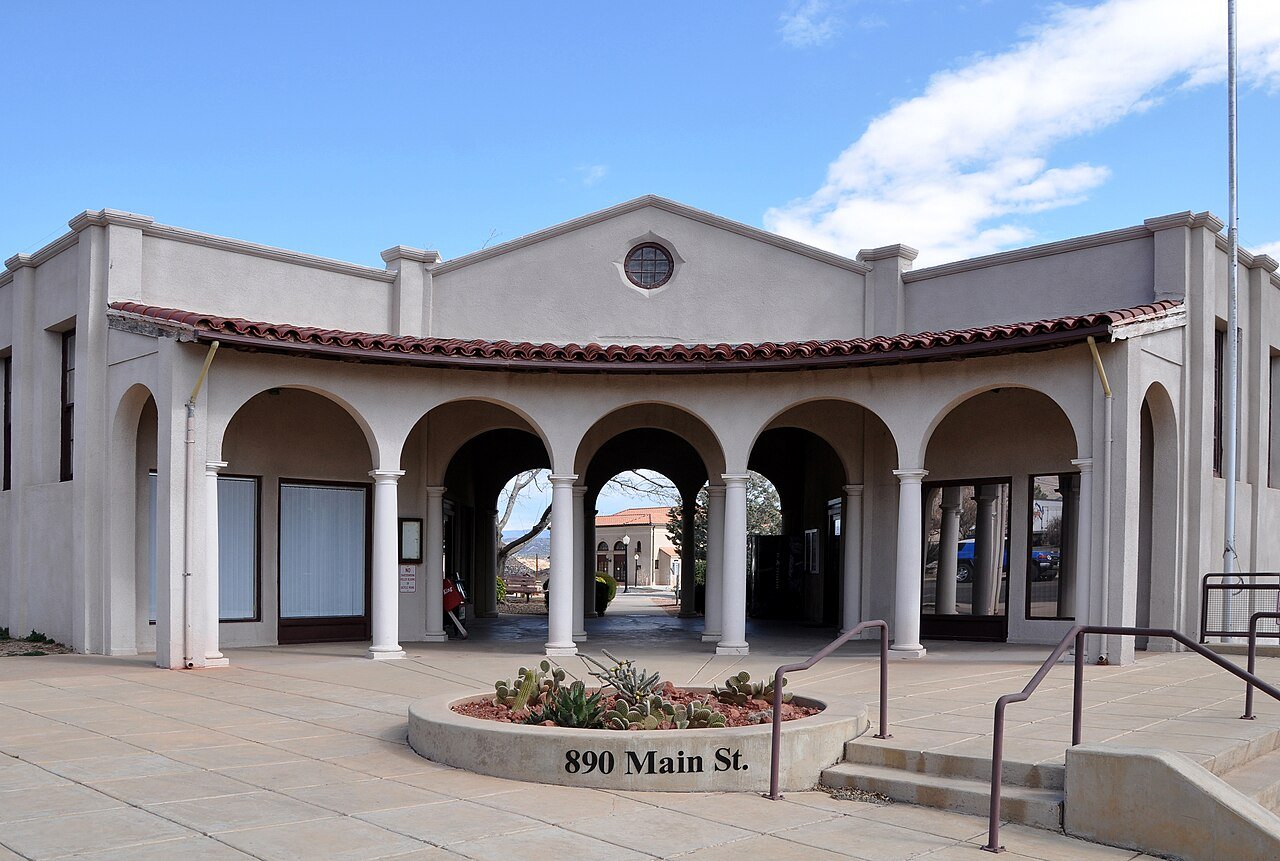
21 Phoenix Phoenix1,642,323 people 3.2 per home 162,507 51,601
22 Map of Fountain Hills Fountain Hills23,789 people 3.1 per home 1,331 436
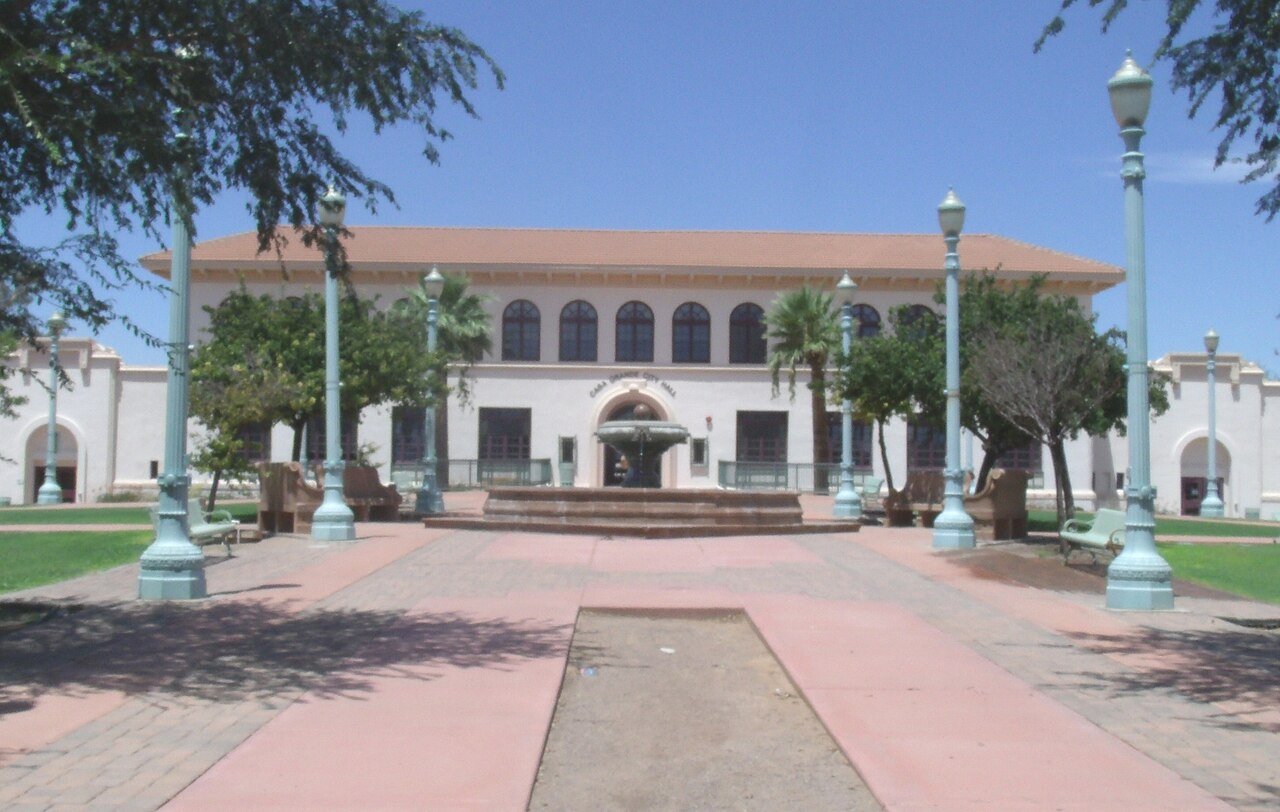
23 Casa Grande Casa Grande60,905 people 3.0 per home 5,087 1,682
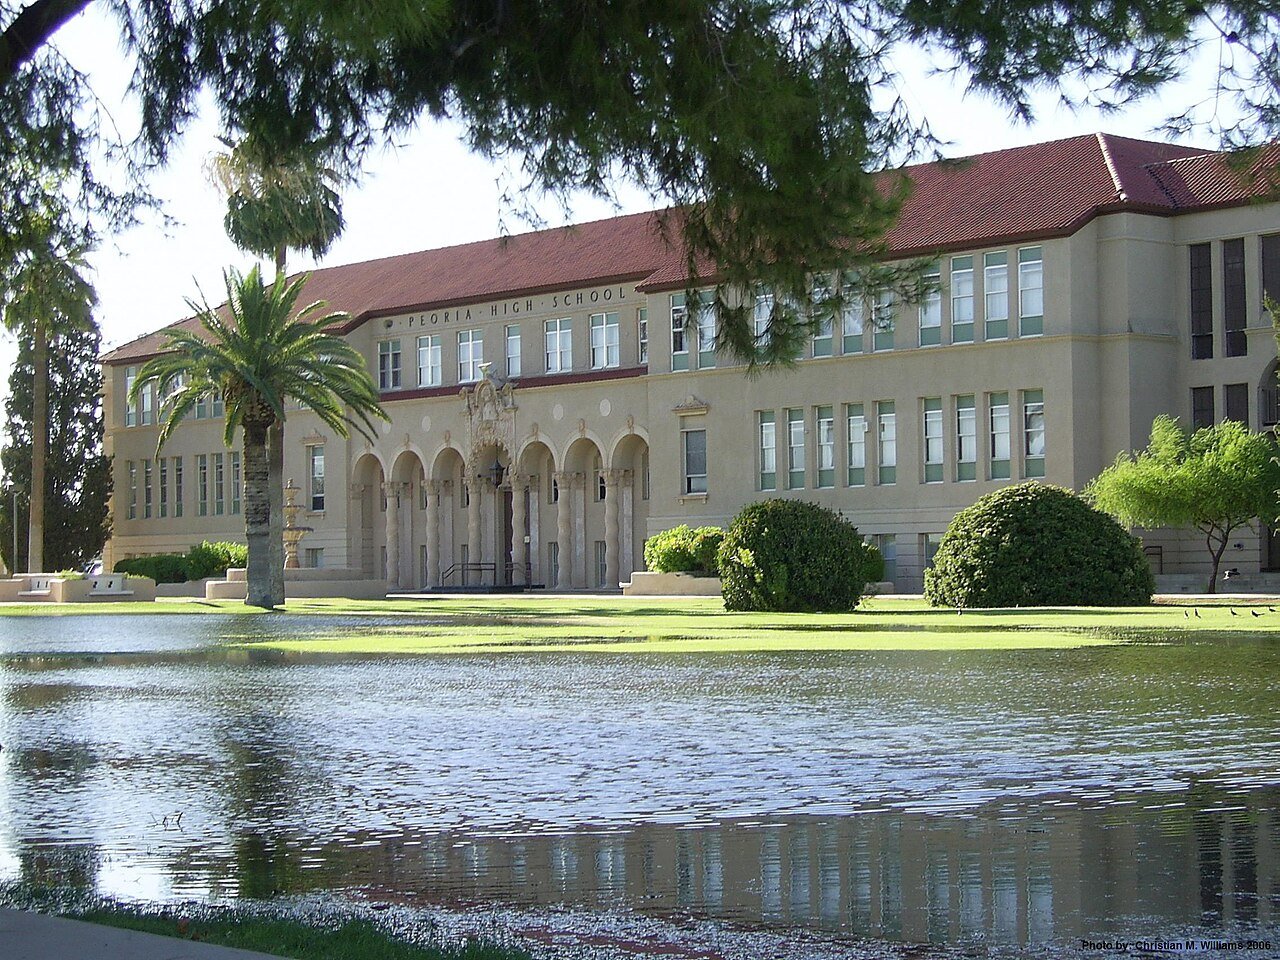
24 Peoria Peoria196,906 people 3.0 per home 36,920 12,507
25 Maricopa Maricopa67,163 people 2.9 per home 14,643 5,008
26 Chandler Chandler280,136 people 2.8 per home 39,864 14,109
27 Kingman Kingman34,375 people 2.8 per home 4,621 1,652
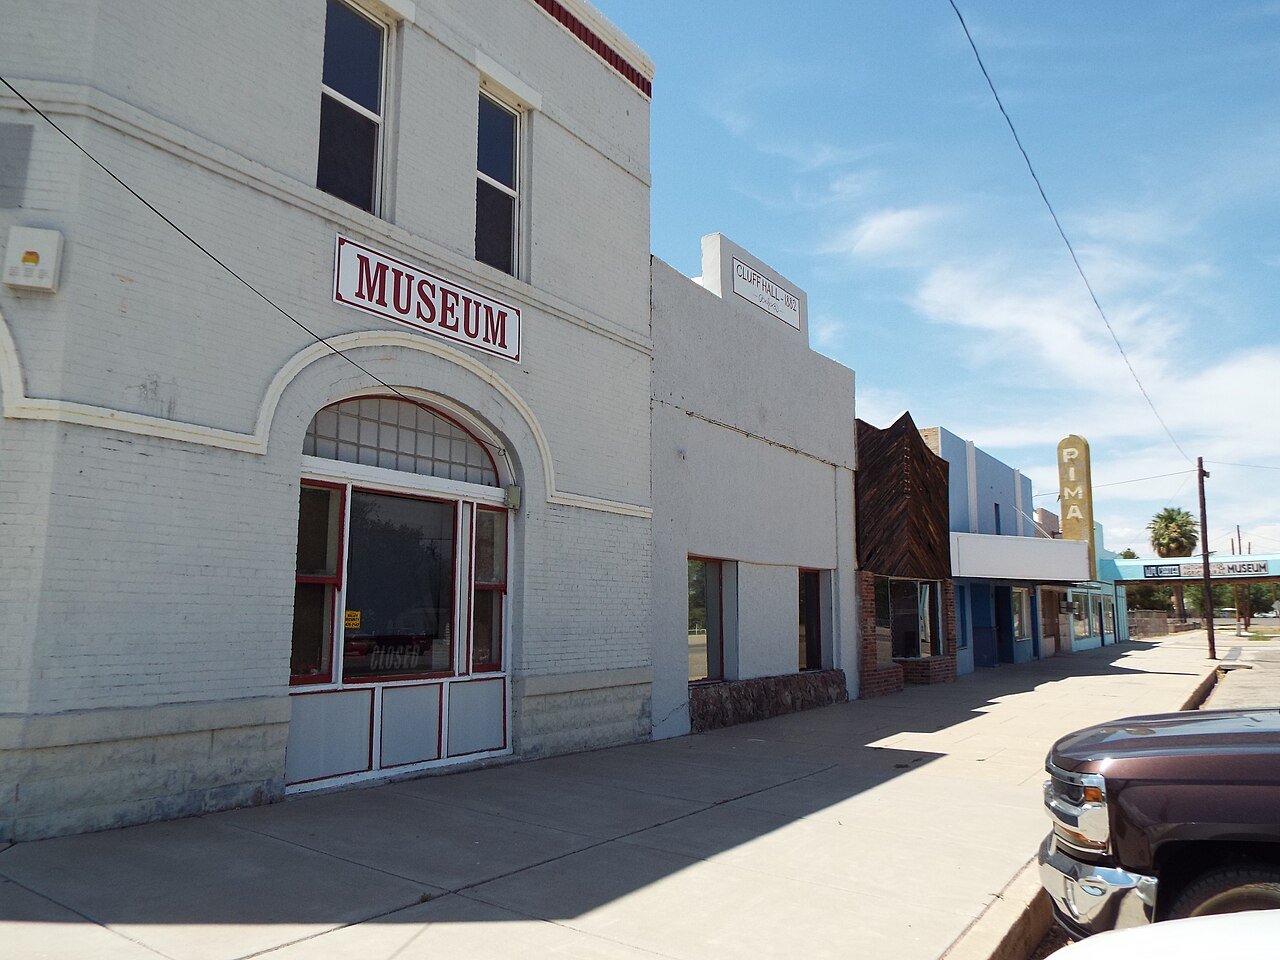
28 Pima Pima2,995 people 2.8 per home 460 165
29 Apache Junction Apache Junction41,058 people 2.8 per home 2,659 965
30 Goodyear Goodyear107,645 people 2.7 per home 30,019 10,993
31 Marana Marana56,938 people 2.5 per home 16,947 6,828
32 Litchfield Park Litchfield Park6,916 people 2.3 per home 1,371 594
33 Safford Safford10,239 people 2.1 per home 563 269
34 Bullhead City Bullhead City42,496 people 2.0 per home 1,808 909
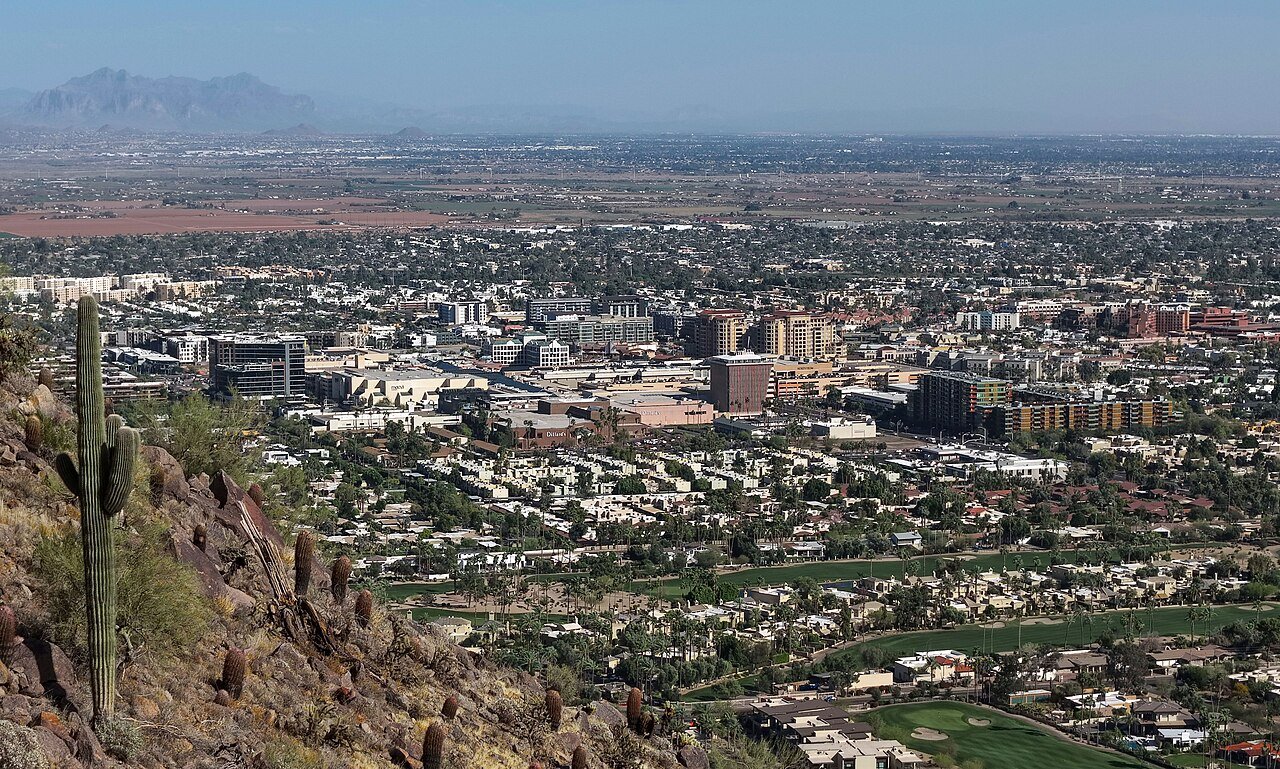
35 Scottsdale Scottsdale243,821 people 2.0 per home 23,976 12,126
36 Prescott Prescott47,400 people 1.9 per home 5,984 3,126
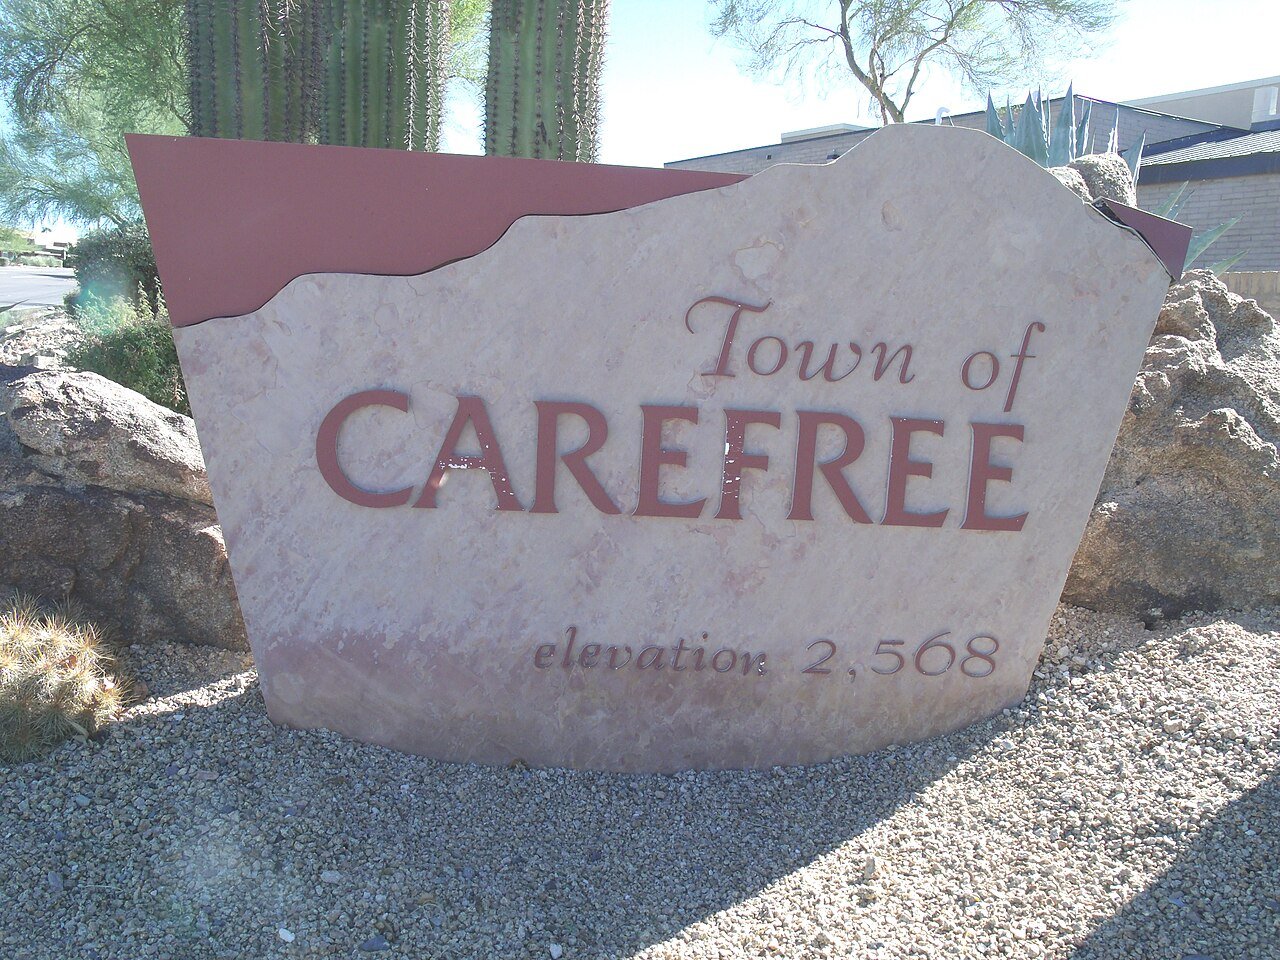
37 Carefree Carefree3,683 people 1.9 per home 327 171
38 Prescott Valley Prescott Valley49,179 people 1.9 per home 7,963 4,196
39 Tucson Tucson547,073 people 1.9 per home 22,513 11,932
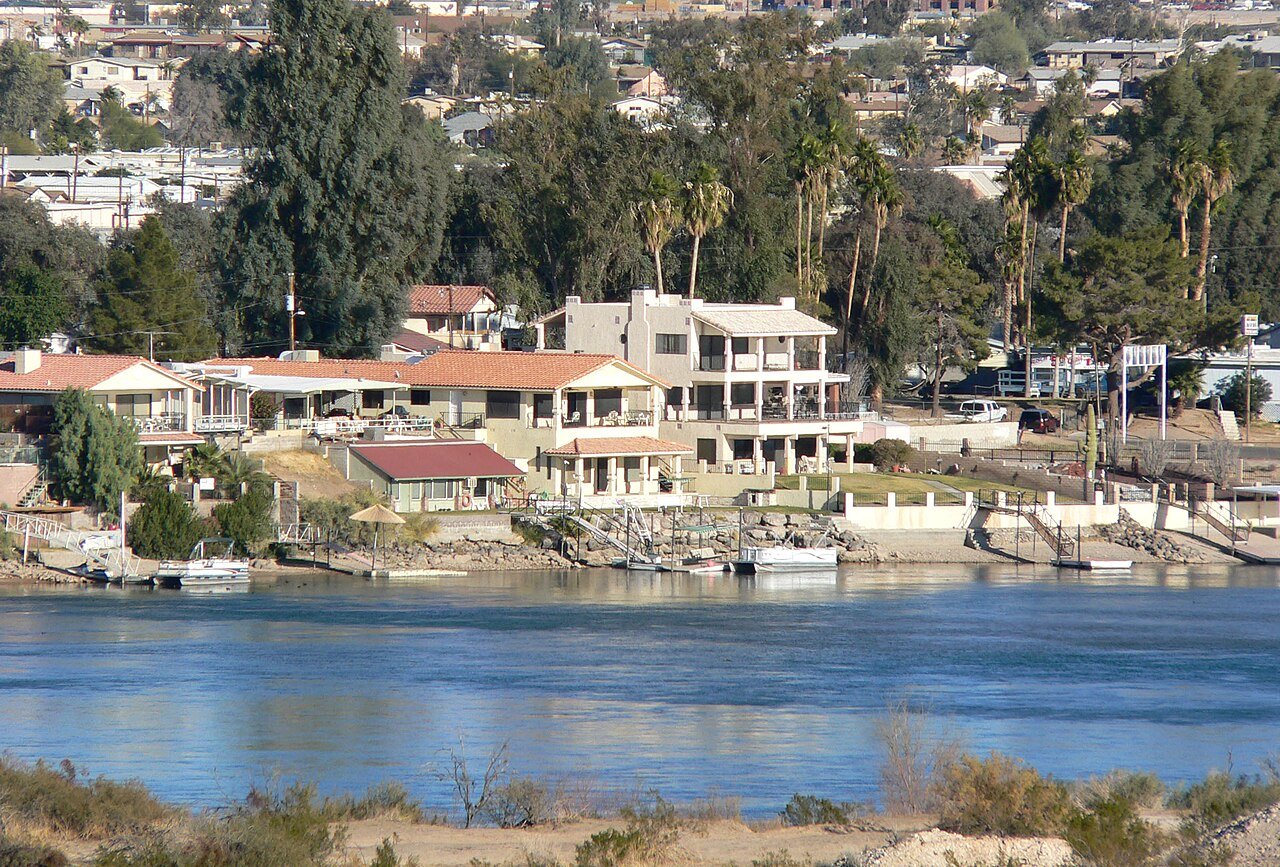
40 Map of Lake Havasu City Lake Havasu City58,359 people 1.8 per home 4,617 2,567
41 Payson Payson16,622 people 1.8 per home 1,050 583
42 Clarkdale Clarkdale4,758 people 1.7 per home 327 189
43 Show Low Show Low12,102 people 1.7 per home 1,072 644
44 Thatcher Thatcher5,439 people 1.5 per home 366 246
45 Wickenburg Wickenburg8,059 people 1.5 per home 1,111 756
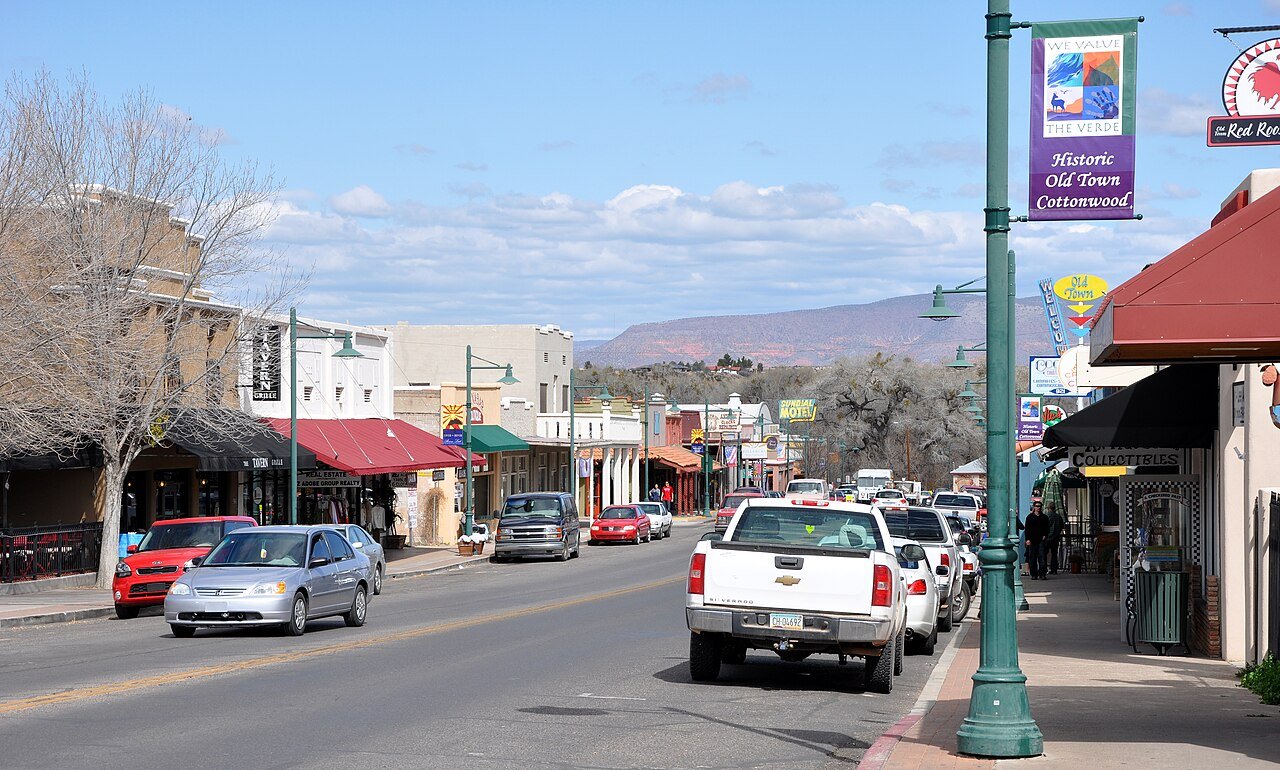
46 Cottonwood Cottonwood12,580 people 1.3 per home 764 572
47 Map of Sierra Vista Sierra Vista45,155 people 1.3 per home 1,420 1,114
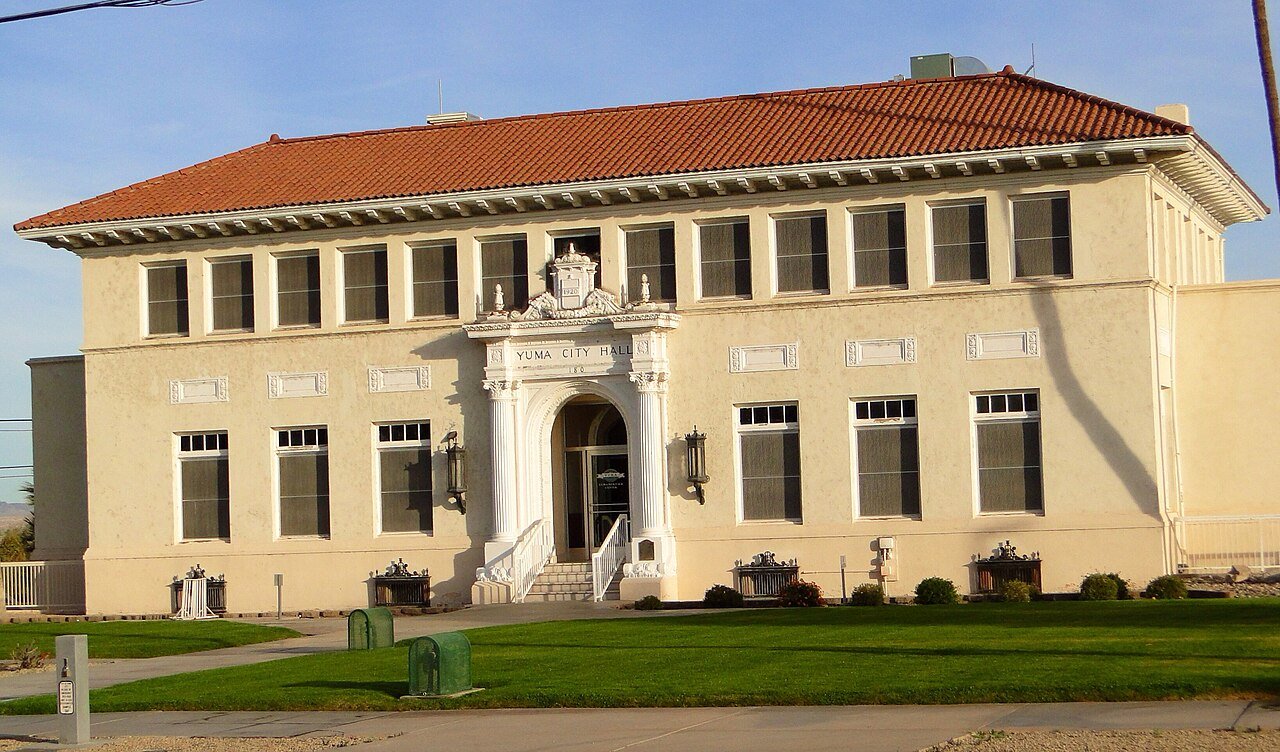
48 Yuma Yuma100,139 people 0.7 per home 2,484 3,714
49 Florence Florence25,570 people 0.6 per home 1,249 1,951

How this ranking works

We take each town’s population change between the 2010 and 2020 censuses and divide it by the new homes its building permits authorized over 2010–2019. The result is how many new residents arrived for every new home. A high number means people came faster than homes were built, so existing homes filled up: larger households, fewer vacancies and tighter supply. The highest ratio ranks #1. Across Arizona it’s 2.6 per home.

Only towns that gained at least 250 residents and permitted at least 10 homes are ranked, because a ratio built on a handful of either is noise. College towns, where 20% or more of residents are enrolled in college, are left out: a growing college adds dorm students as residents, but dorms never show up as permitted homes.

Only towns with at least 2,500 residents are ranked; Census estimates for smaller places are too uncertain. Population and income: U.S. Census Bureau American Community Survey 5-year estimates. New homes: U.S. Census Bureau Building Permits Survey. Residents: 2010 and 2020 decennial censuses. Town photos: Wikimedia Commons, credited on each town’s page.

Same ranking in other states