RIRhode Island rankings

Towns with the highest high school graduation rates in Rhode Island

Ranked by the four-year high school graduation rate of each town's public school district, class of 2020. Towns that share a regional district share its rate and its rank (T = tied). The Rhode Island rate is 83.4%. 36 towns with 2,500+ residents.
U.S. Census ACS 2020–2024 5-yearClass of 2020

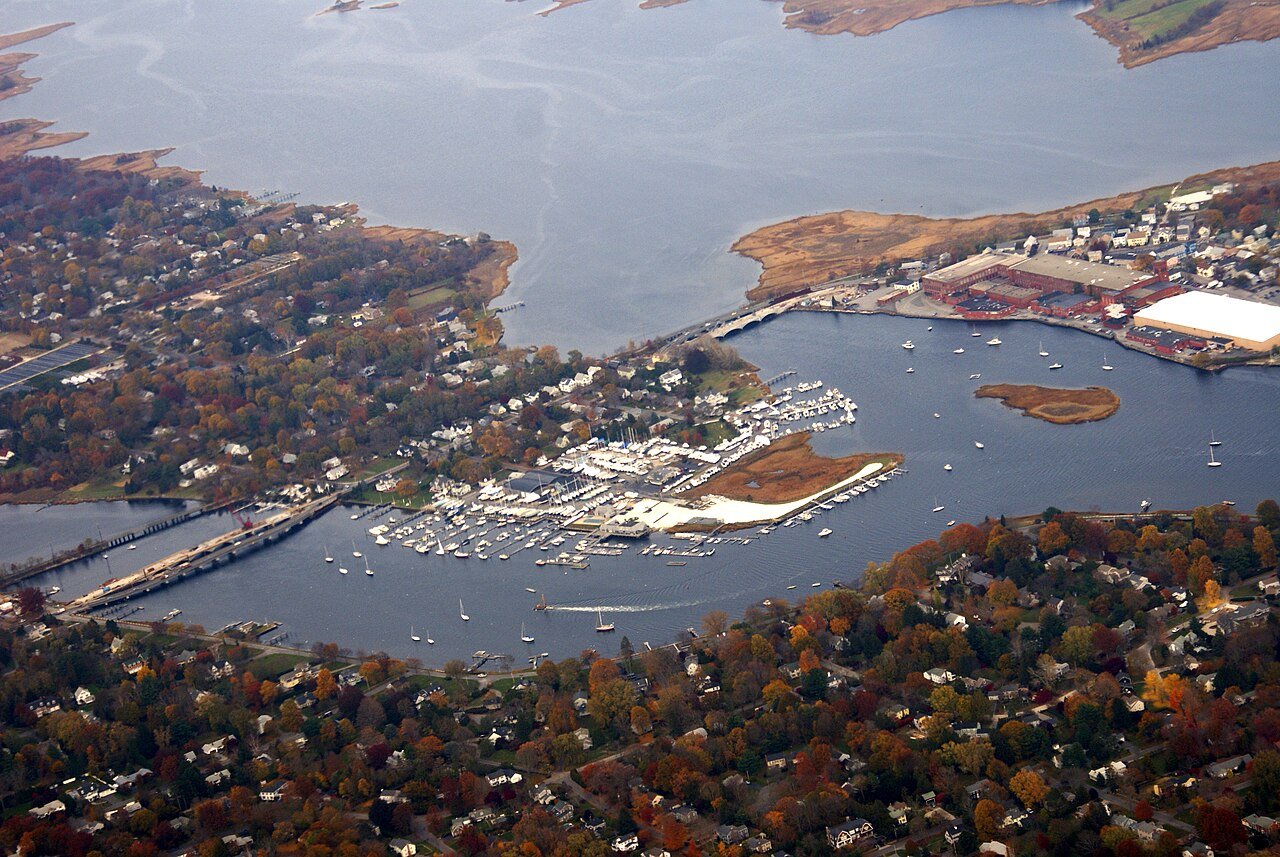
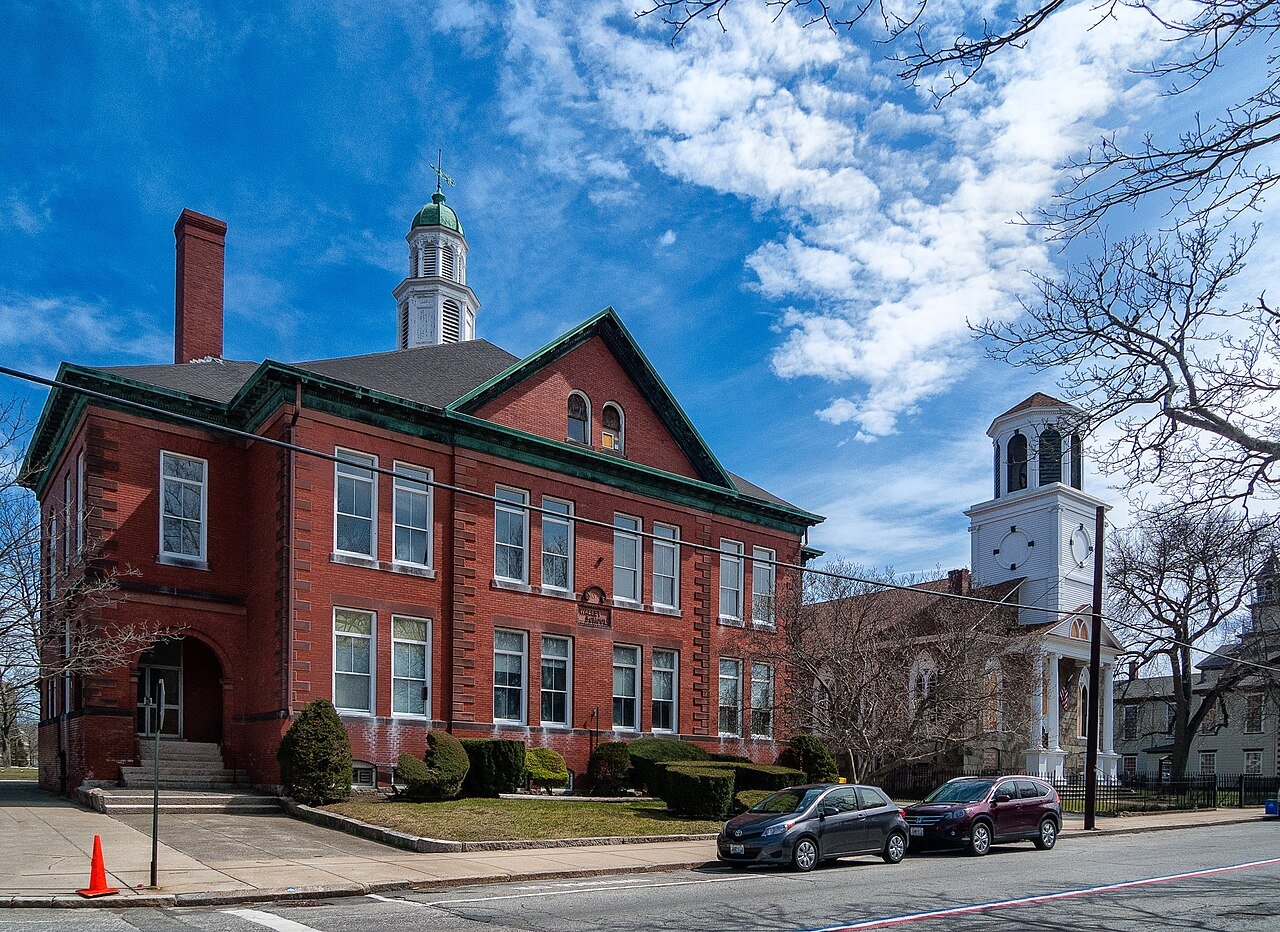
Bristol
Rhode Island · Highest graduation rate

Where Bristol lands: #13 of 36

90% of high schoolers graduate in four years · Visit Bristol →
#TownGraduation rateClass sizePopulation
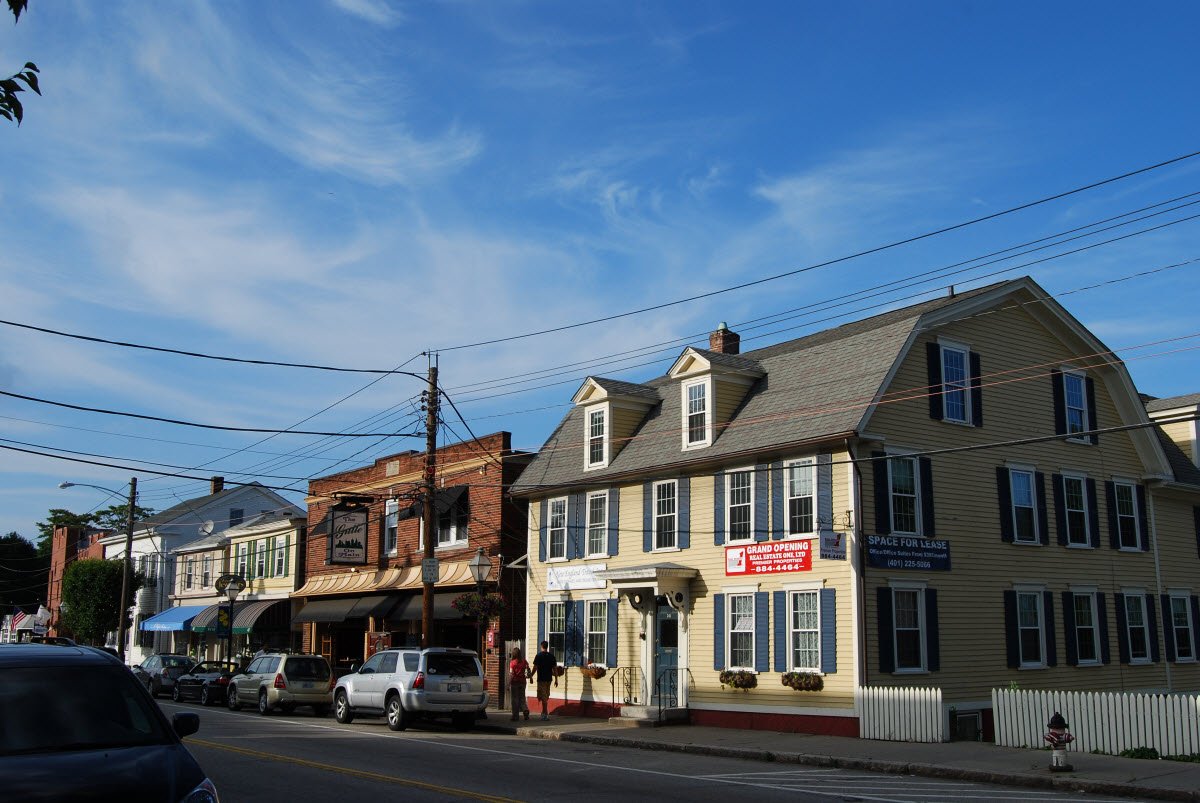
T1 East Greenwich East GreenwichKent County · East Greenwich School District 97% 167 14,554
T1 Narragansett NarragansettWashington County · Narragansett School District 97% 95 14,494
3 Barrington BarringtonBristol County · Barrington School District 96% 313 17,126
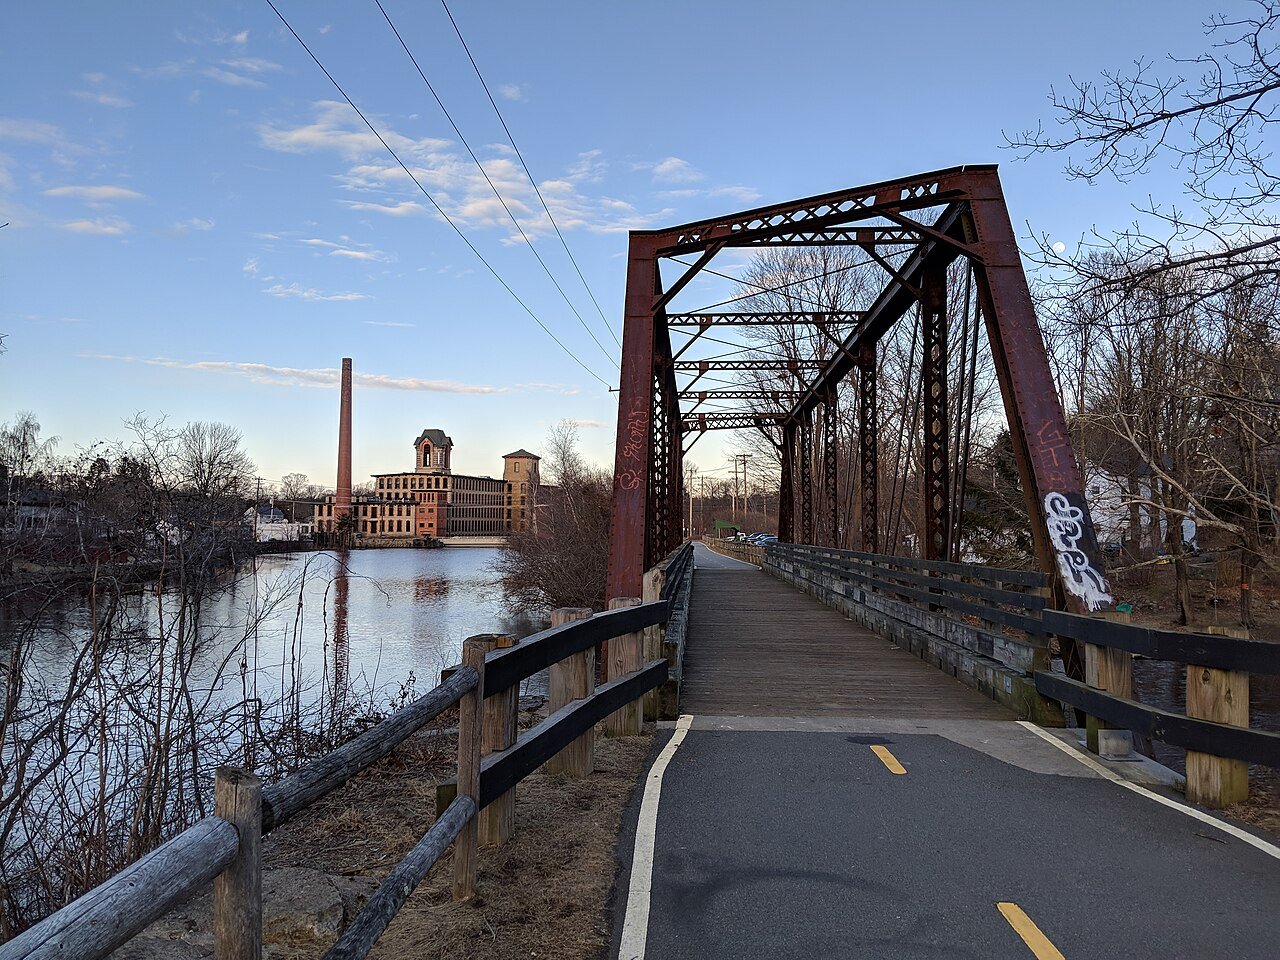
4 South Kingstown South KingstownWashington County · South Kingstown School District 95% 227 32,073
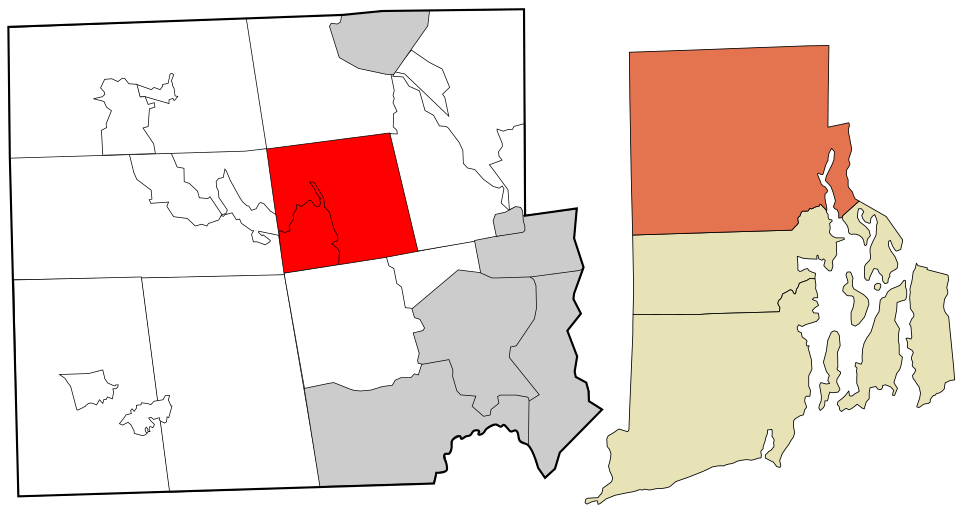
T5 Map of Smithfield SmithfieldProvidence County · Smithfield School District 92% 198 22,233
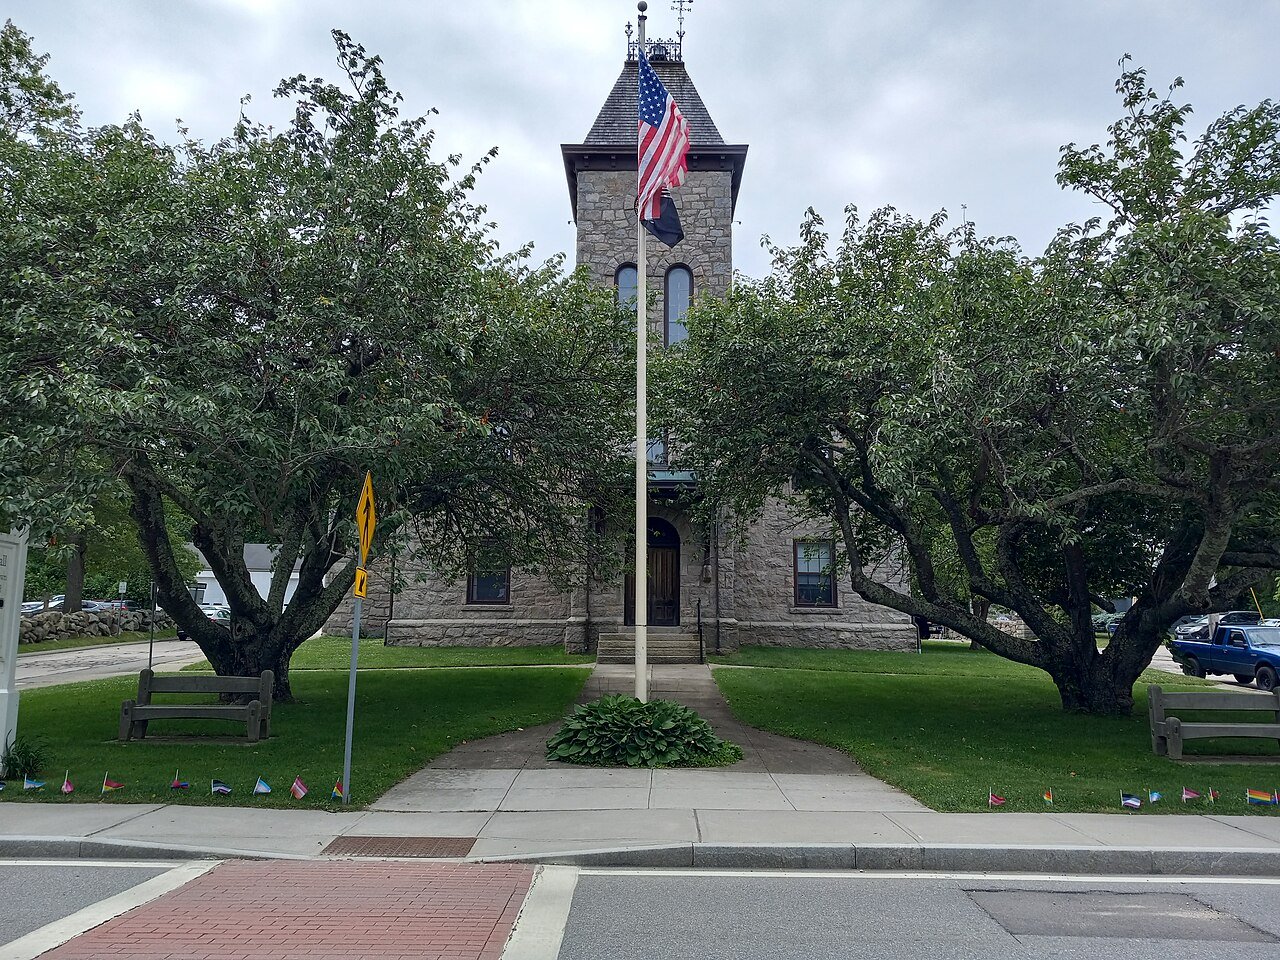
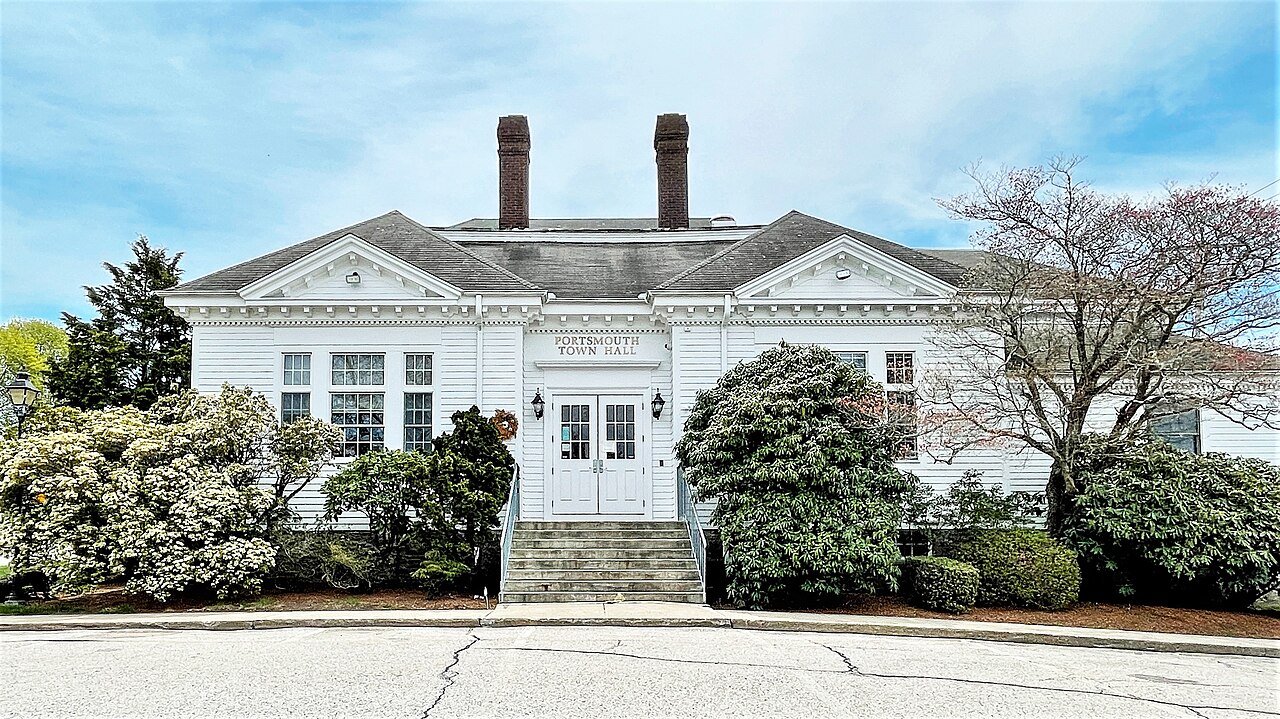
T5 Portsmouth PortsmouthNewport County · Portsmouth School District 92% 250 17,644
T5 Map of Scituate ScituateProvidence County · Scituate School District 92% 96 10,517
T5 Map of Glocester GlocesterProvidence County · Foster-Glocester Regional School District 92% 170 10,221
T5 Exeter ExeterWashington County · Exeter-West Greenwich Regional School District 92% 132 7,195
T5 West Greenwich West GreenwichKent County · Exeter-West Greenwich Regional School District 92% 132 6,647
T5 Foster FosterProvidence County · Foster-Glocester Regional School District 92% 170 4,523
12 North Kingstown North KingstownWashington County · North Kingstown School District 91% 369 27,859
T13 Lincoln LincolnProvidence County · Lincoln School District 90% 228 22,864
T13 Bristol BristolBristol County · Bristol-Warren Regional School District 90% 227 22,220
T13 Warren WarrenBristol County · Bristol-Warren Regional School District 90% 227 11,144
16 North Providence North ProvidenceProvidence County · North Providence School District 89% 288 34,293
17 Coventry CoventryKent County · Coventry School District 88% 396 35,907
T18 Cumberland CumberlandProvidence County · Cumberland School District 87% 365 36,820
T18 Westerly WesterlyWashington County · Westerly School District 87% 196 23,333
T18 Middletown MiddletownNewport County · Middletown School District 87% 176 16,832
T18 Burrillville BurrillvilleProvidence County · Burrillville School District 87% 190 16,427
T18 Tiverton TivertonNewport County · Tiverton School District 87% 146 16,189
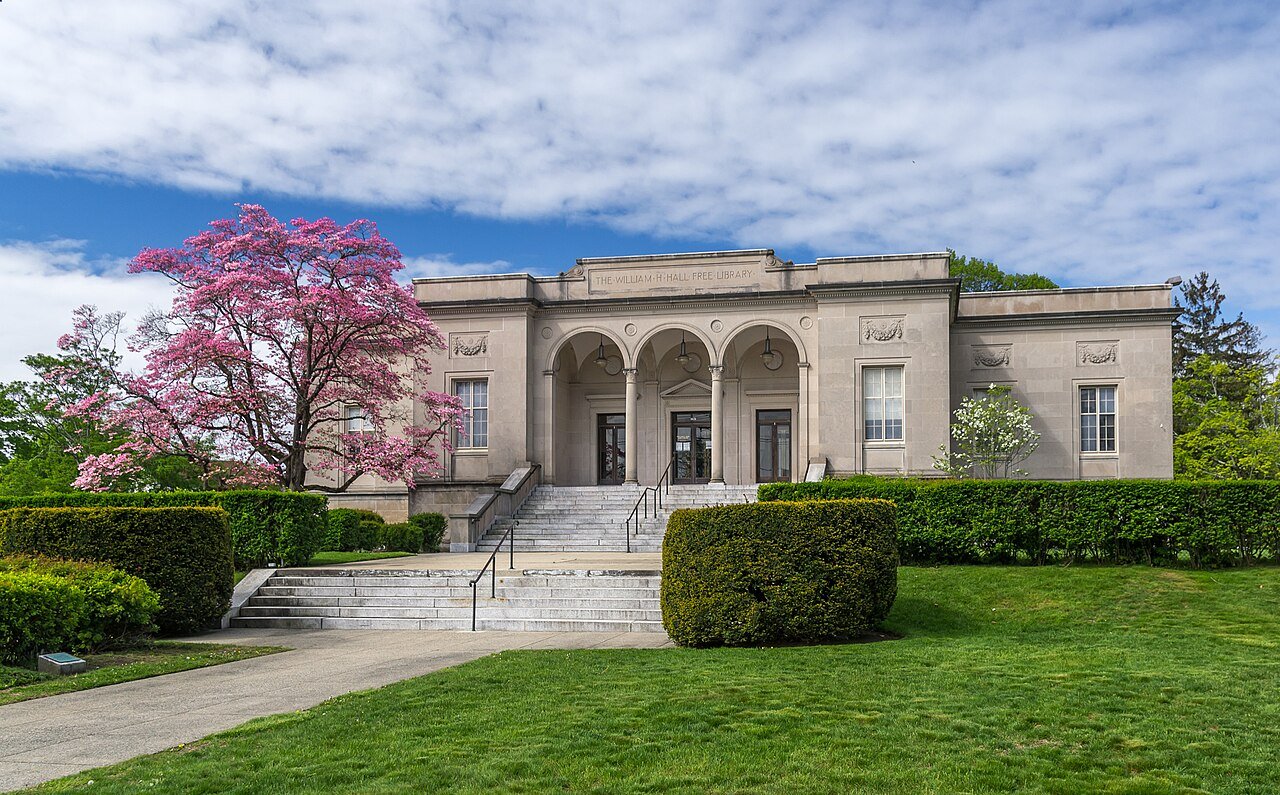
T18 North Smithfield North SmithfieldProvidence County · North Smithfield School District 87% 134 12,708
24 Warwick WarwickWarwick School District 86% 691 83,175
T25 Cranston CranstonCranston School District 85% 856 83,250
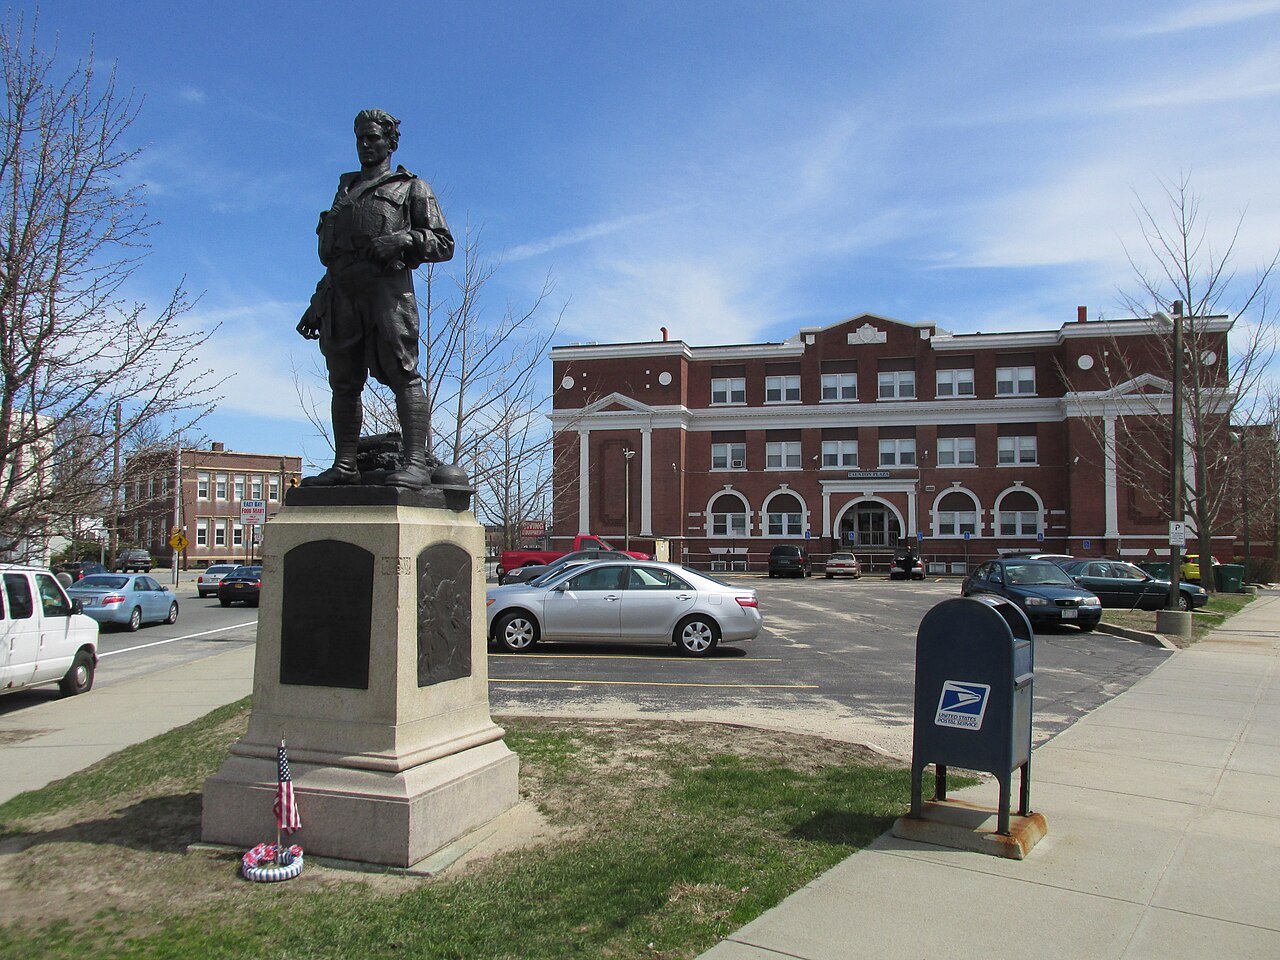
T25 East Providence East ProvidenceEast Providence School District 85% 358 47,281
T25 West Warwick West WarwickKent County · West Warwick School District 85% 238 31,173
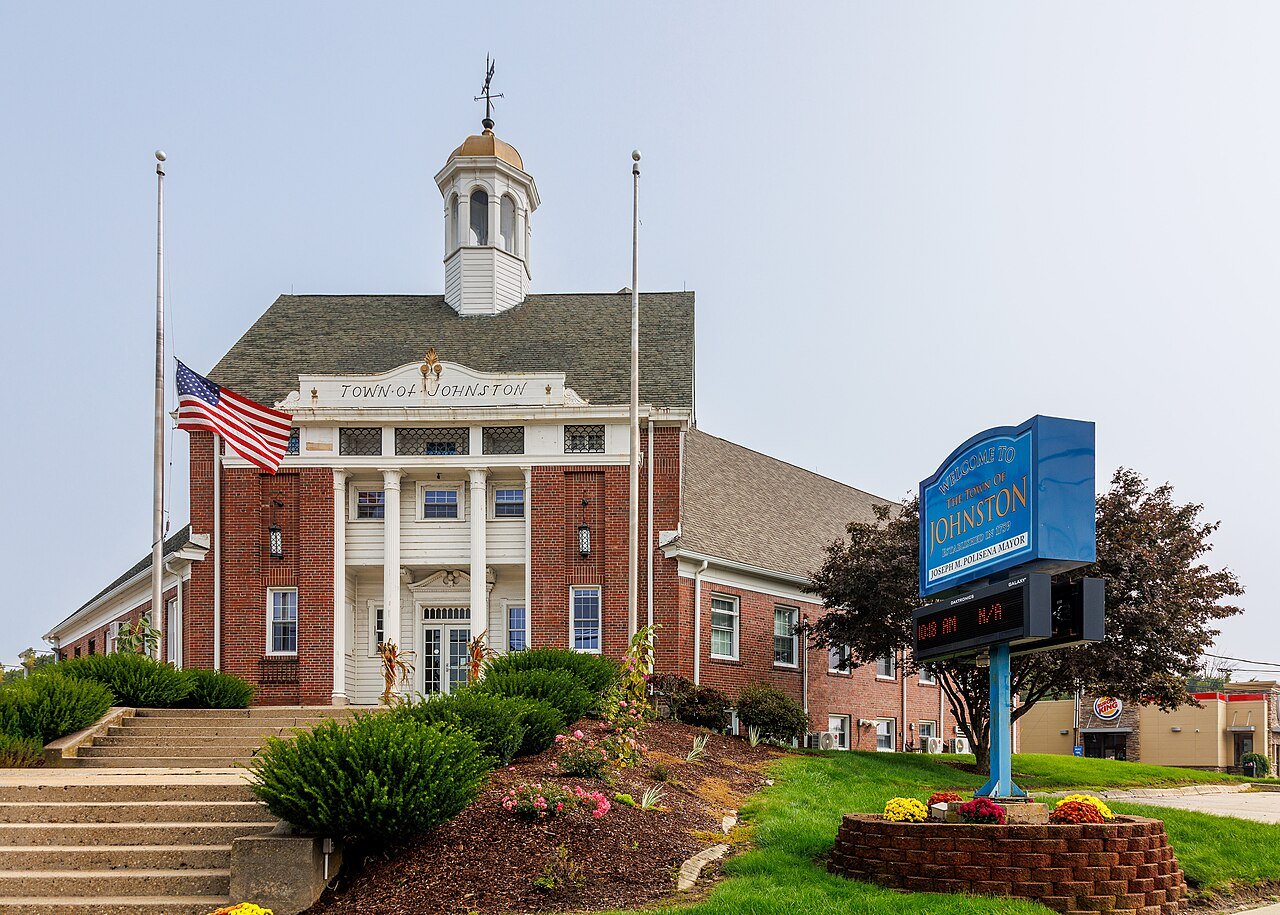
T25 Johnston JohnstonProvidence County · Johnston School District 85% 240 29,835

T29 Hopkinton HopkintonWashington County · Chariho Regional School District 84% 262 8,420
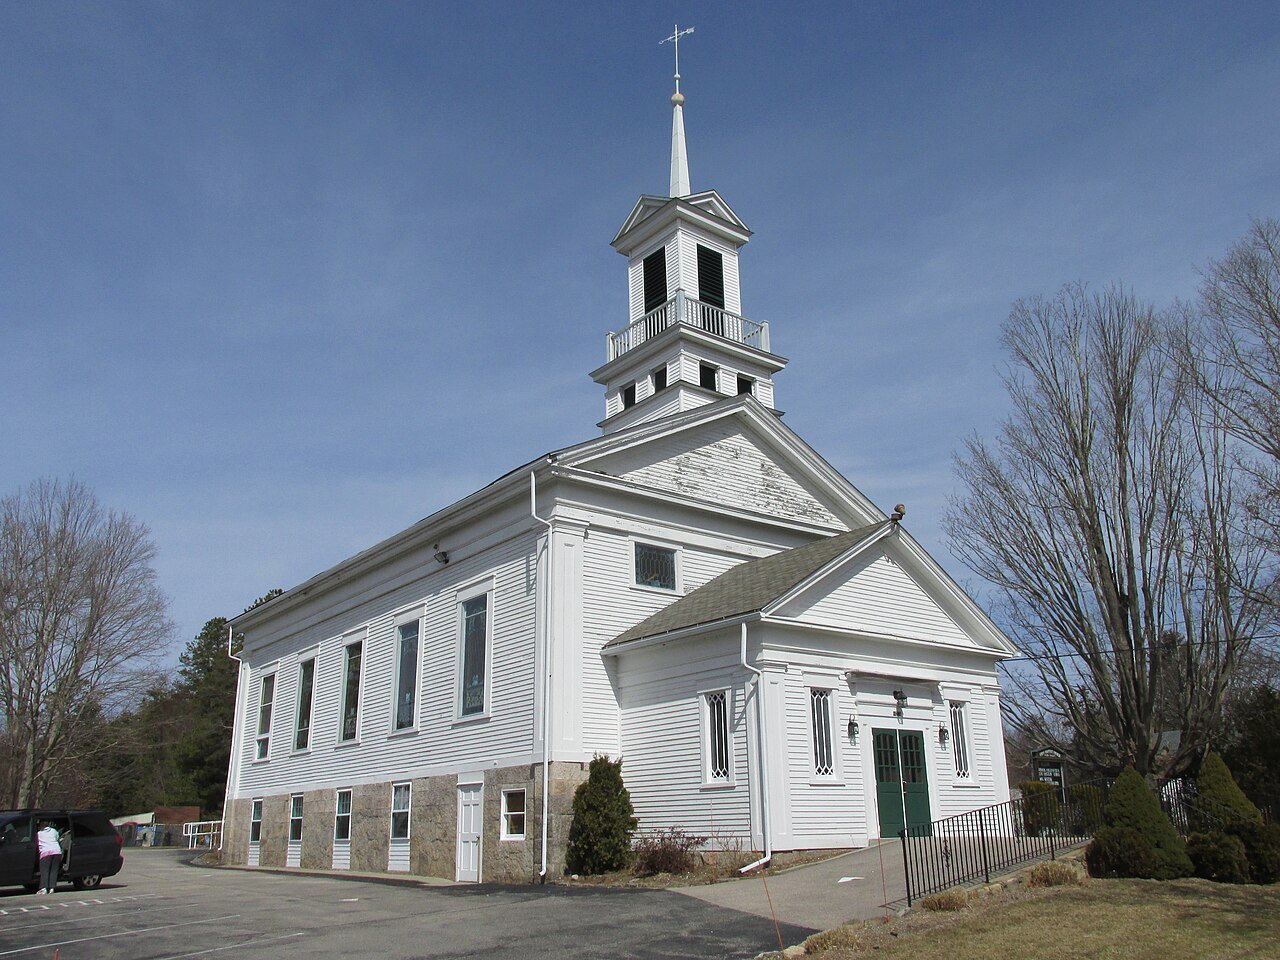
T29 Richmond RichmondWashington County · Chariho Regional School District 84% 262 8,142
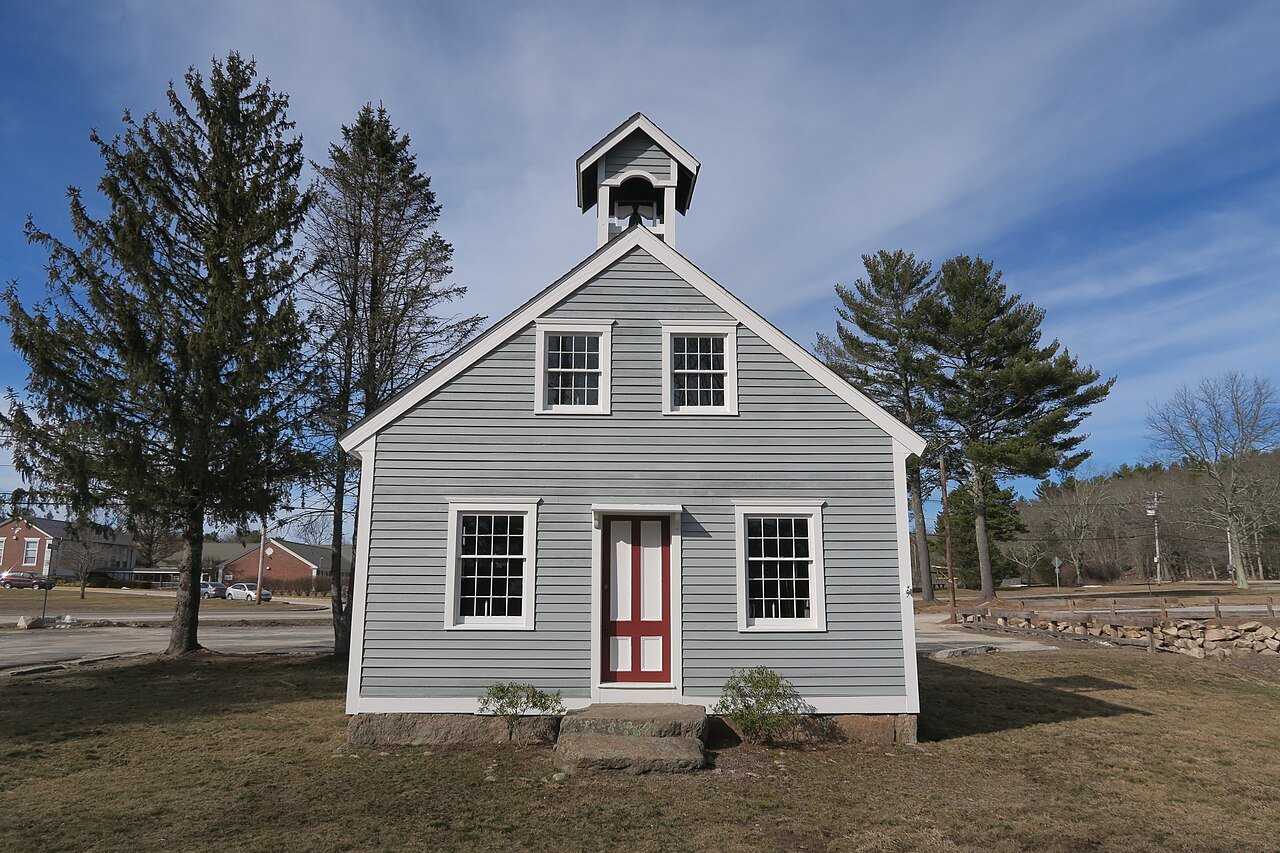
T29 Charlestown CharlestownWashington County · Chariho Regional School District 84% 262 8,051
32 Pawtucket PawtucketPawtucket School District 77% 504 75,893
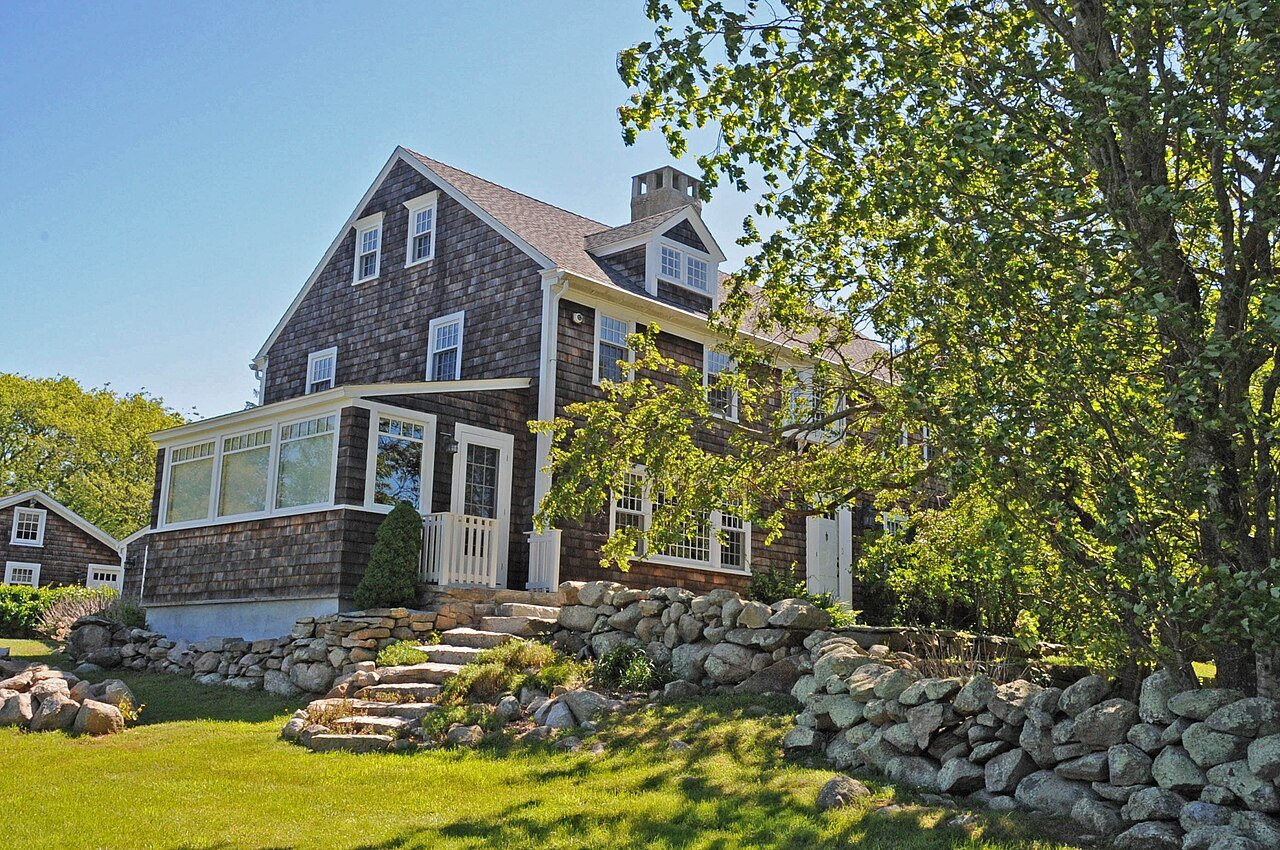
33 Providence ProvidenceProvidence School District 74% 2,019 191,767
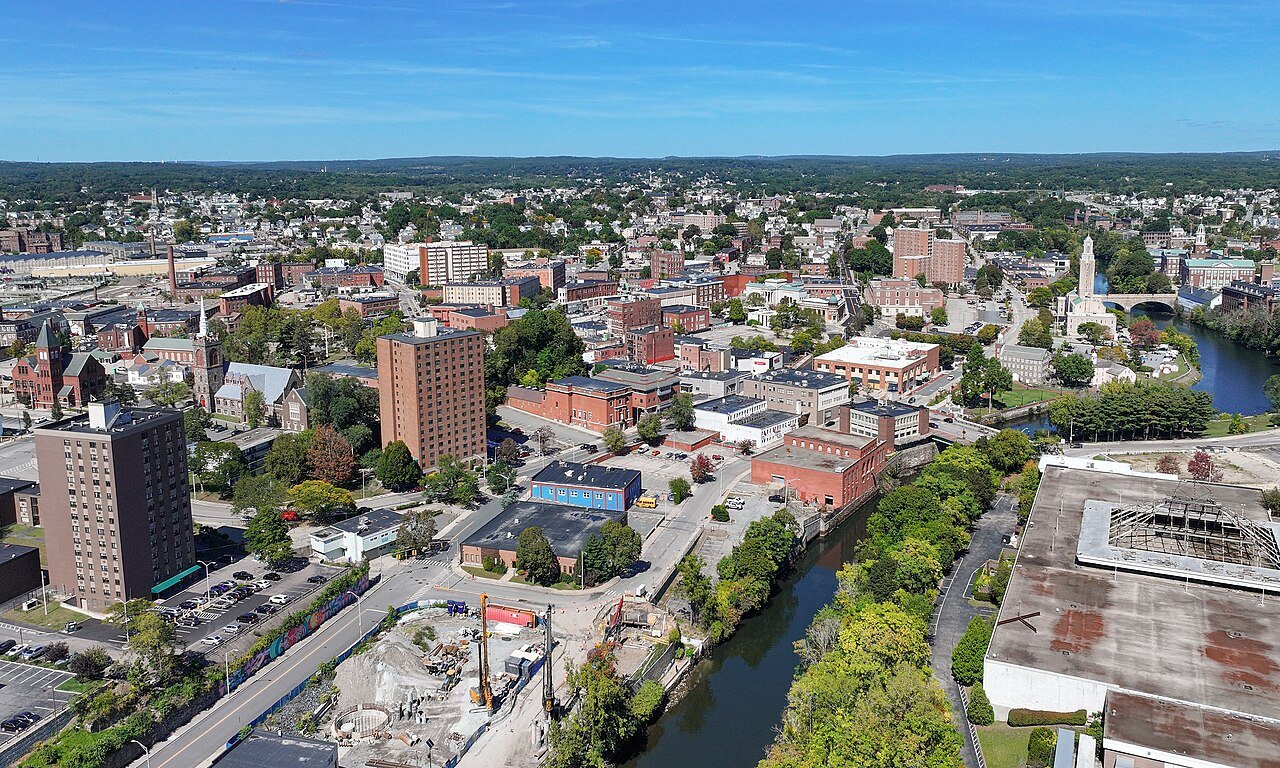
34 Woonsocket WoonsocketWoonsocket School District 73% 442 43,521
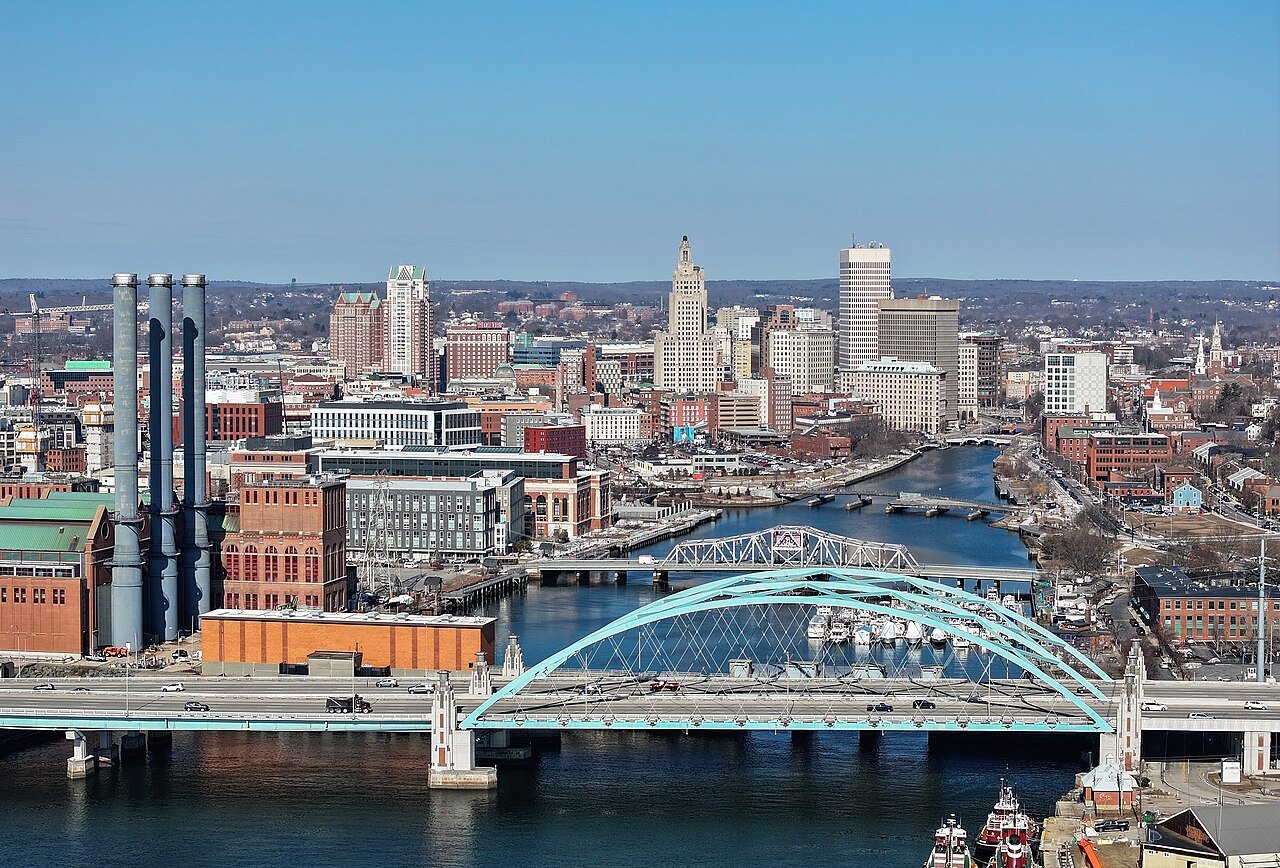
35 Central Falls Central FallsCentral Falls School District 69% 215 22,701
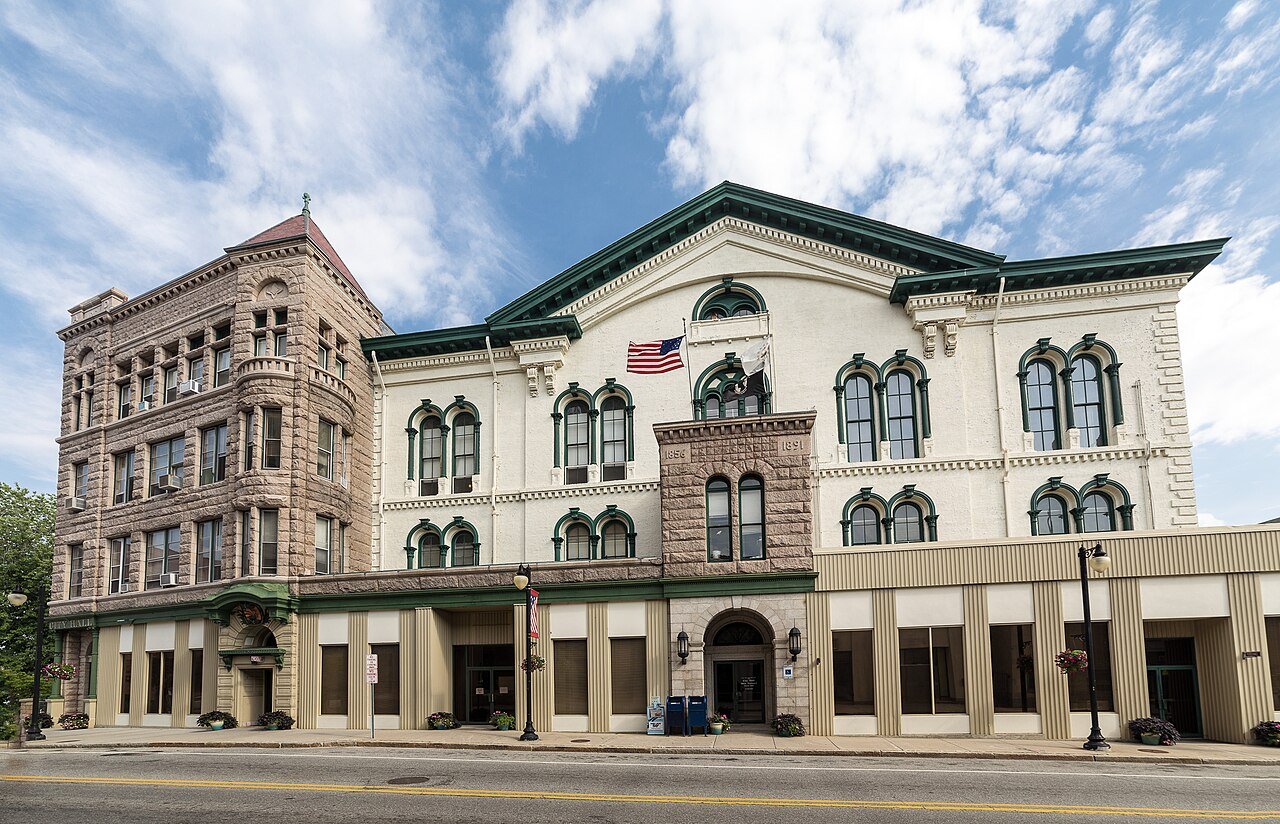
36 Newport NewportNewport School District 62% 177 24,874
How this ranking works

Each town gets the four-year graduation rate of the public school district that runs its high school for the class of 2020: the share of students who started ninth grade together and earned a regular diploma within four years, counting students who transferred in and out. Every state computes it the same federal way. Where a regional district serves several towns, they all share its rate and its rank.

We leave out a town split between high school districts, a district whose class had fewer than 20 students, and one the Department of Education reports only as a wide range (such as 50–100%). Those numbers are too uncertain to rank. The Department also publishes most rates in bands rather than exact figures (a rate between 95% and 99% is shown as 97%), which is why many towns tie. Graduation data: EDFacts via the Urban Institute Education Data Portal. Each district's page shows its rate against the state.

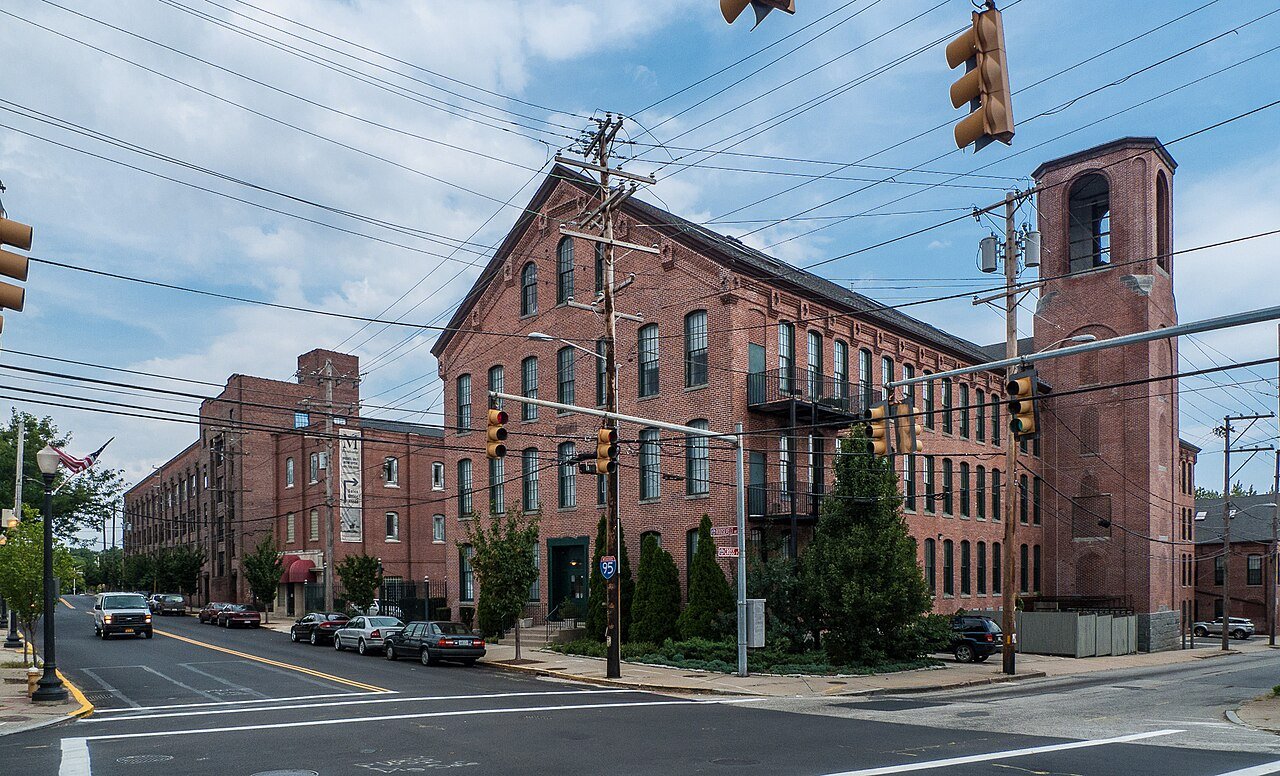
Only towns with at least 2,500 residents are ranked; Census estimates for smaller places are too uncertain. Population and income: U.S. Census Bureau American Community Survey 5-year estimates. Town photos: Wikimedia Commons, credited on each town’s page.

Same ranking in other states