NVNevada rankings

Towns with the lowest property taxes in Nevada

Ranked by the median yearly real-estate tax bill homeowners actually pay (the tax rate column is that bill divided by the median home value). 41 towns with 2,500+ residents.

U.S. Census ACS 2020–2024 5-year

Nevada · Lowest property tax

Paradise ranks #15 of 41

$1,553/yr median yearly property-tax bill · Visit Paradise →

Paradise ranks #15 of 41 for lowest property tax in Nevada
#TownMedian tax billHome valueTax rate
1 Silver Springs5,060 people $865/yr $244,400 0.35%
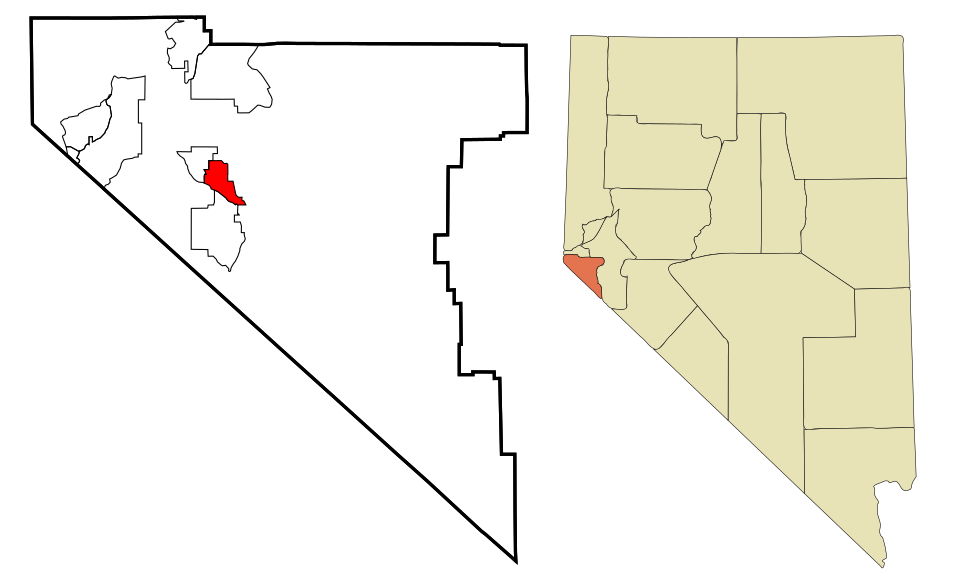
2 Map of Winchester Winchester37,081 people $979/yr $302,800 0.32%
3 Sun Valley22,228 people $979/yr $349,100 0.28%
4 Yerington3,150 people $1,087/yr $284,800 0.38%
5 Sunrise Manor200,218 people $1,095/yr $320,000 0.34%
6 Lemmon Valley4,412 people $1,122/yr $384,000 0.29%
7 Hawthorne2,809 people $1,129/yr $167,900 0.67%
8 Ely3,929 people $1,188/yr $233,700 0.51%
9 Whitney47,221 people $1,219/yr $329,000 0.37%
10 Battle Mountain3,518 people $1,239/yr $203,800 0.61%
11 Elko20,696 people $1,344/yr $309,100 0.43%
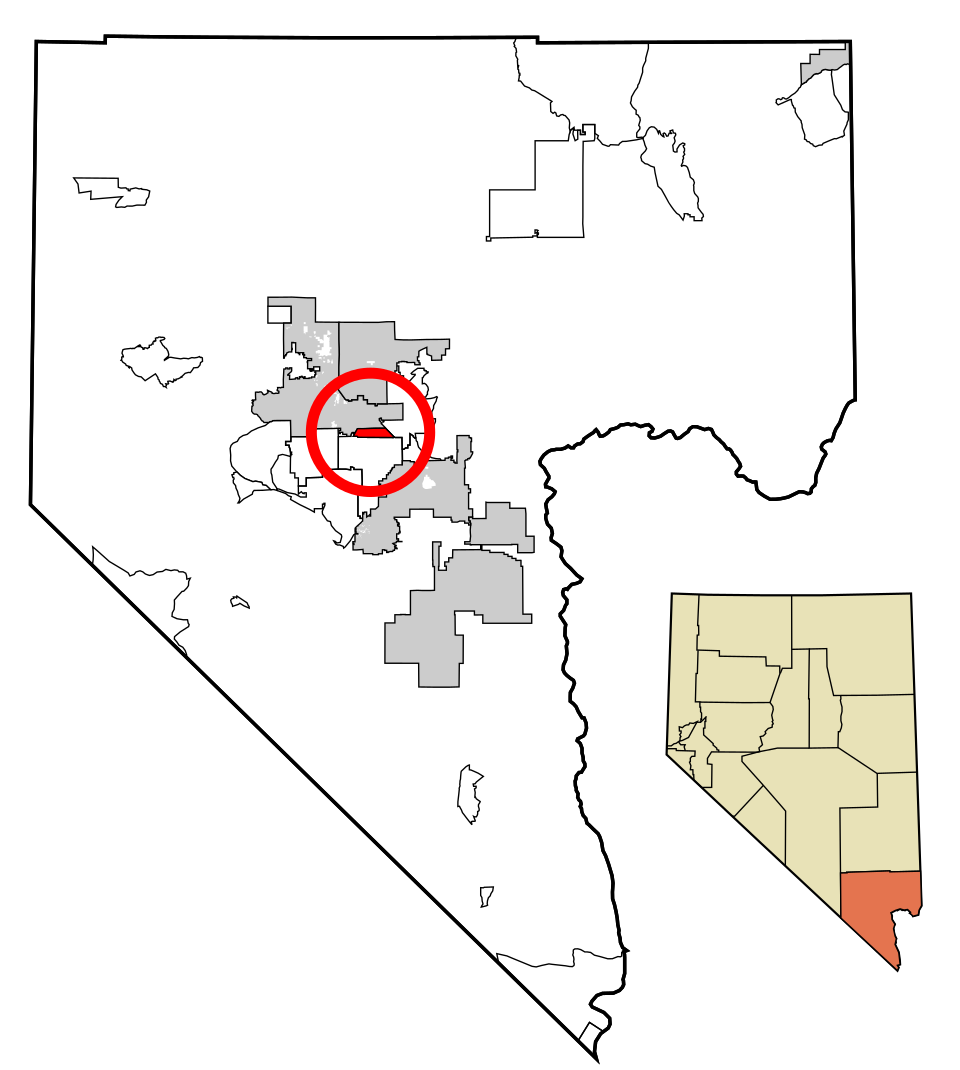
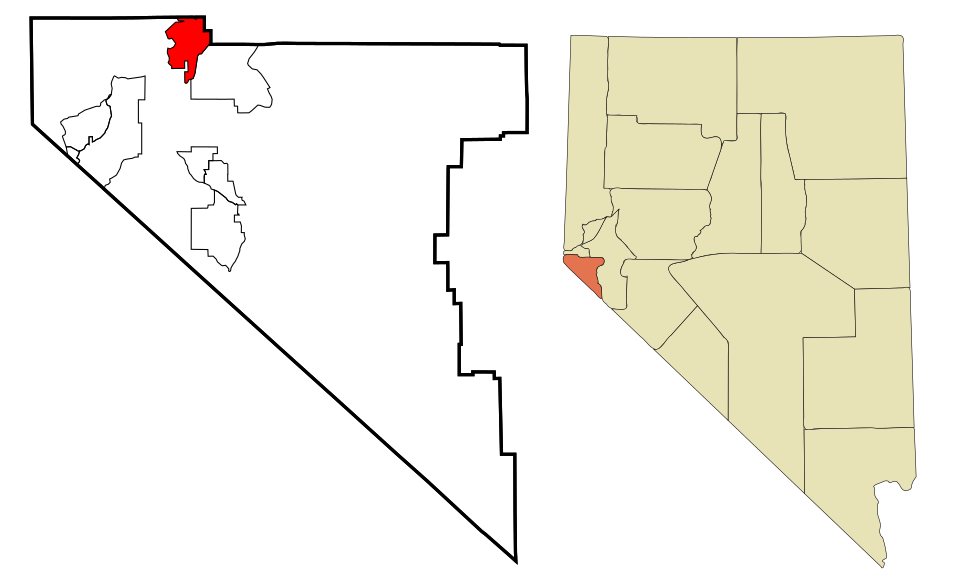
12 Map of Moapa Valley Moapa Valley6,684 people $1,360/yr $362,500 0.38%
13 Pahrump47,347 people $1,383/yr $310,300 0.45%
14 Cold Springs11,321 people $1,467/yr $433,300 0.34%
15 Paradise185,913 people $1,553/yr $384,200 0.40%
16 Boulder City14,919 people $1,578/yr $435,600 0.36%
17 West Wendover4,514 people $1,625/yr $139,700 1.16%
18 Laughlin8,789 people $1,702/yr $283,700 0.60%
19 Winnemucca8,361 people $1,708/yr $309,100 0.55%
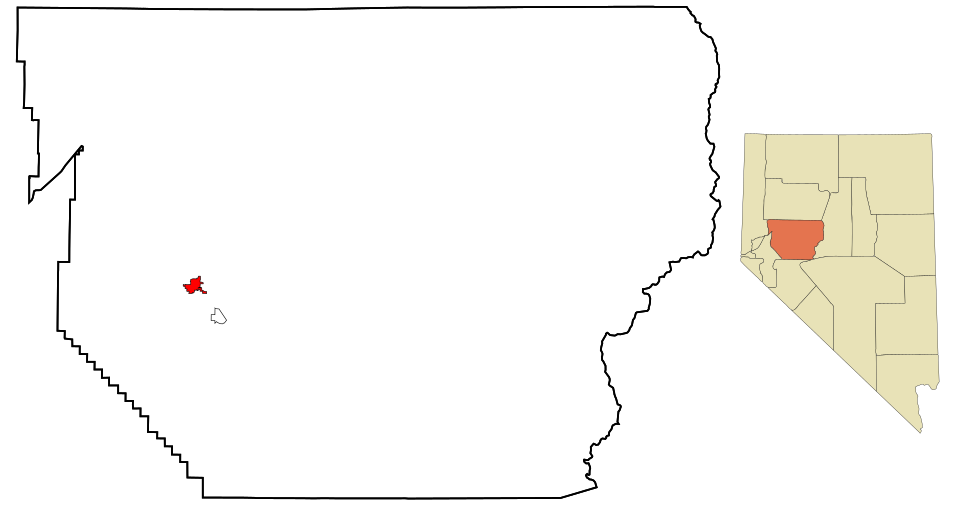
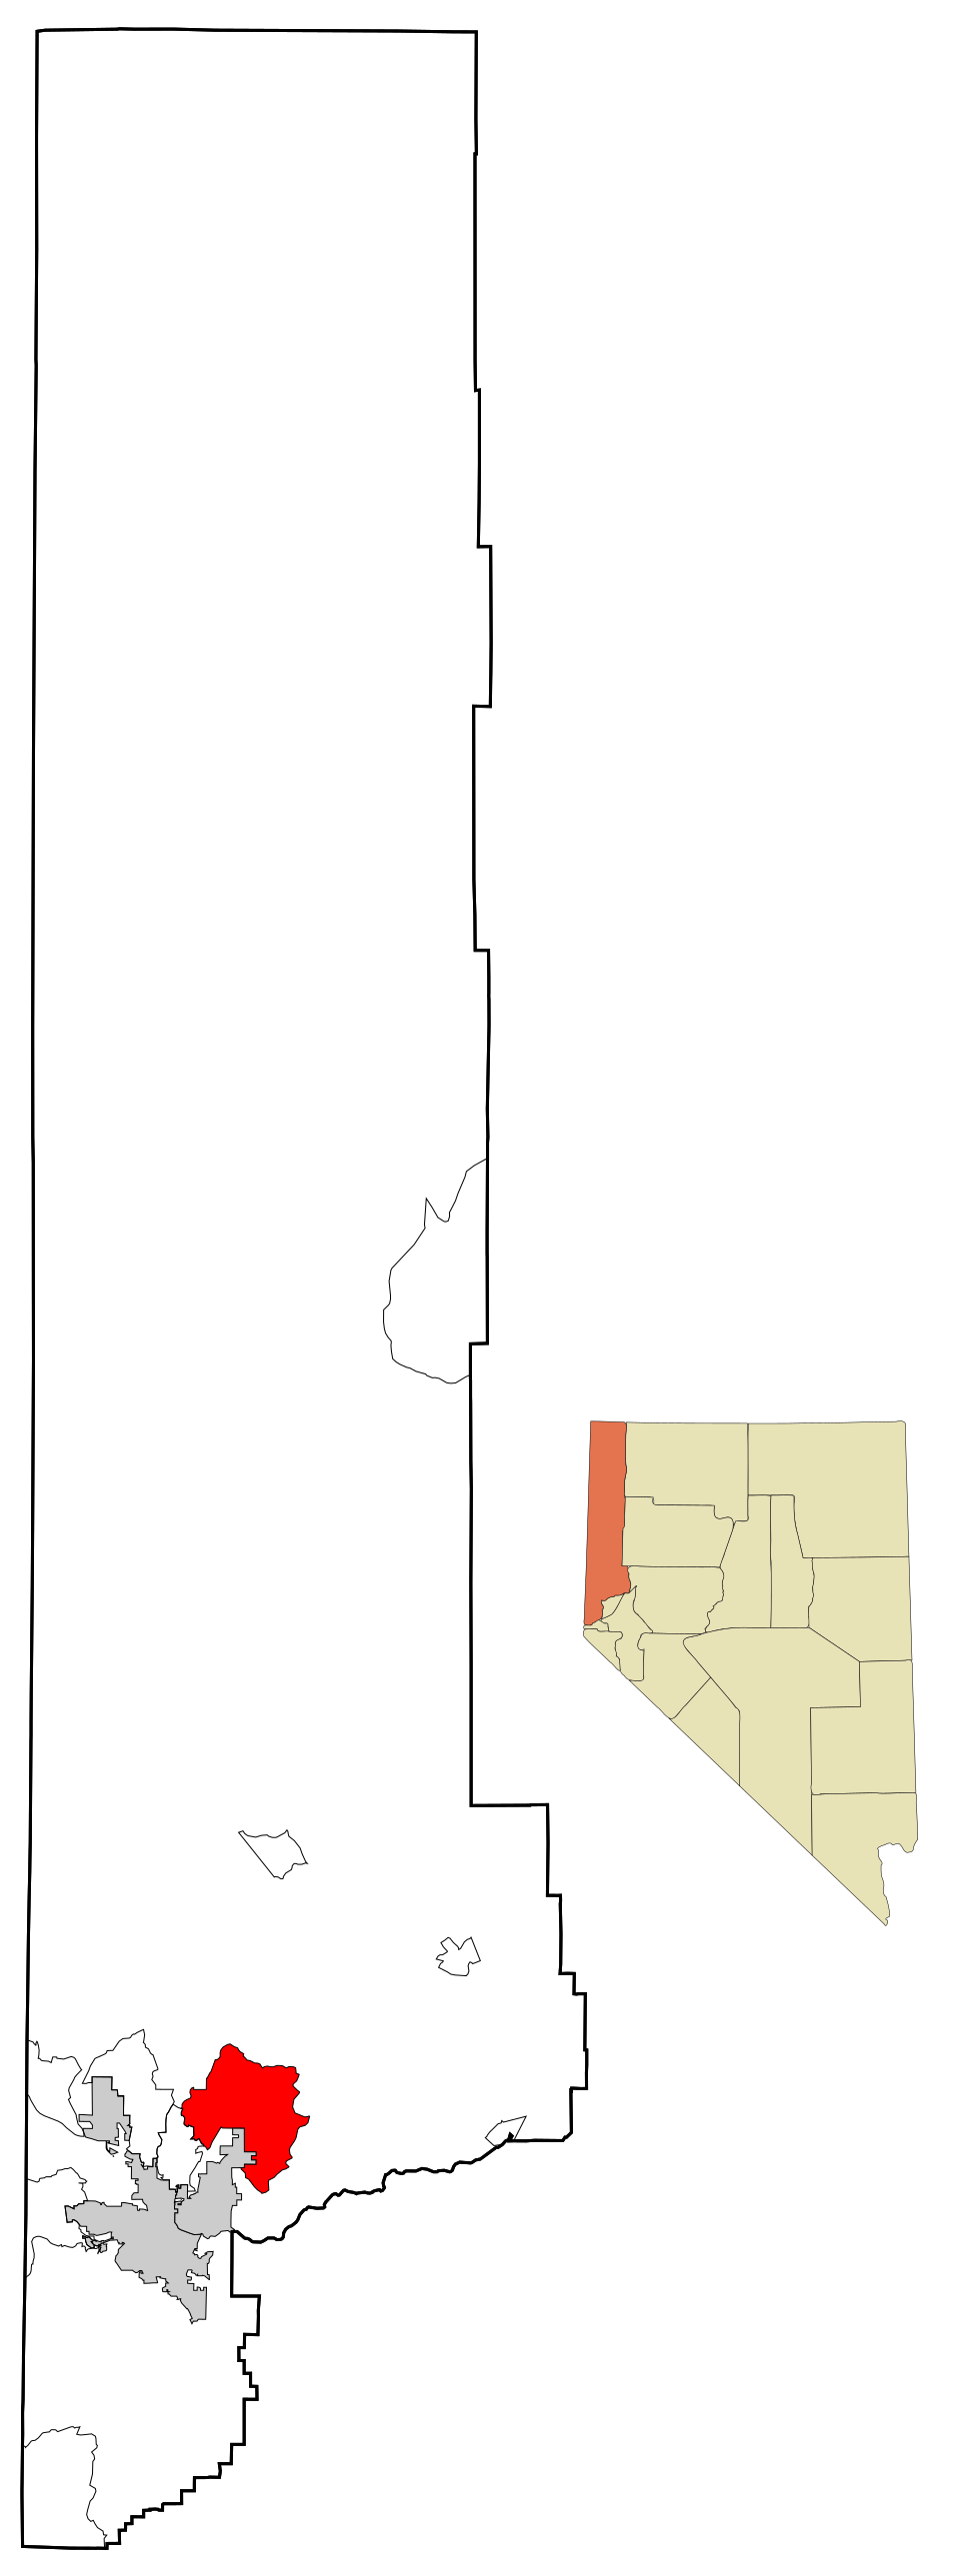
20 Map of Fallon Fallon9,463 people $1,719/yr $282,700 0.61%
21 Dayton15,781 people $1,846/yr $433,200 0.43%
22 North Las Vegas278,595 people $1,854/yr $404,400 0.46%
23 Carson58,384 people $1,870/yr $453,000 0.41%
24 Spring Creek14,739 people $1,899/yr $360,600 0.53%
25 Gardnerville Ranchos12,114 people $1,905/yr $486,000 0.39%
26 Fernley24,225 people $1,964/yr $366,700 0.54%
27 Las Vegas660,400 people $2,065/yr $427,900 0.48%
28 Washoe Valley3,315 people $2,099/yr $609,700 0.34%
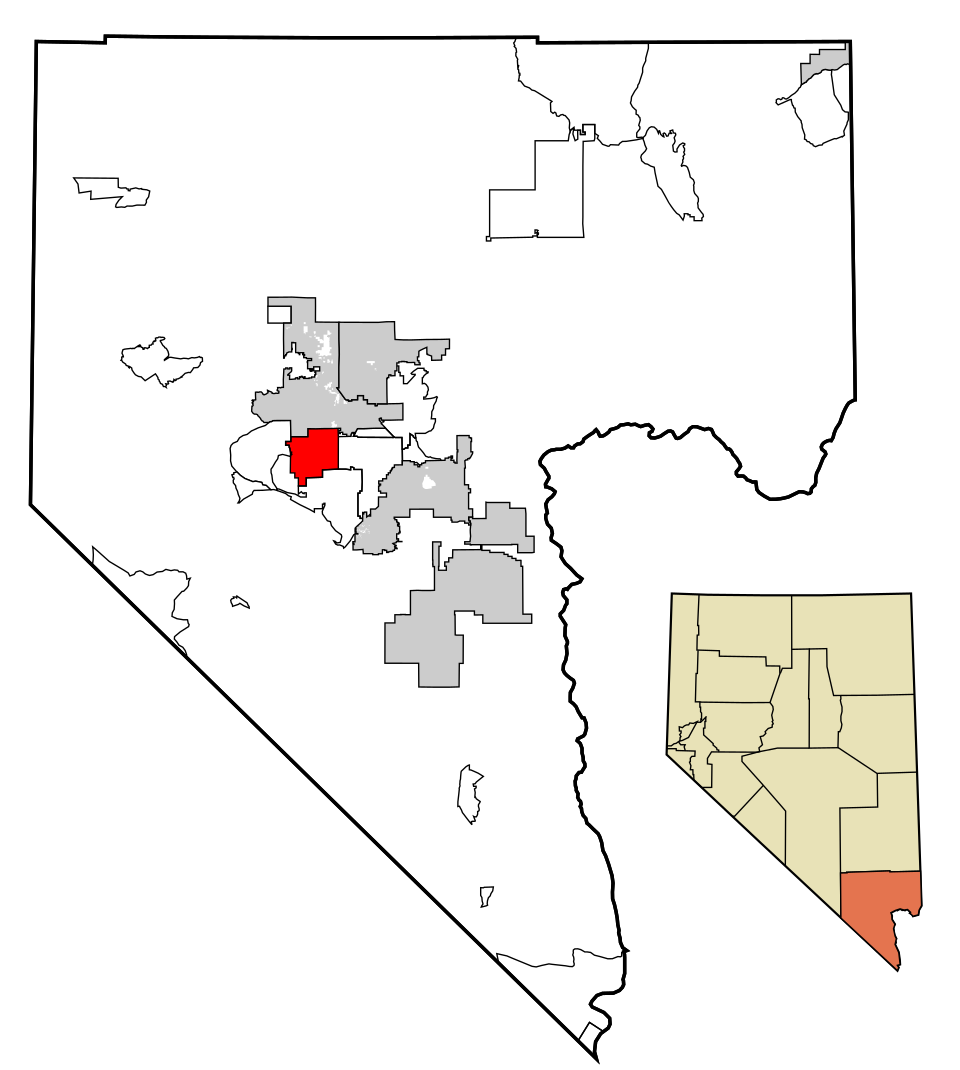
29 Map of Spring Valley Spring Valley219,187 people $2,149/yr $433,800 0.50%
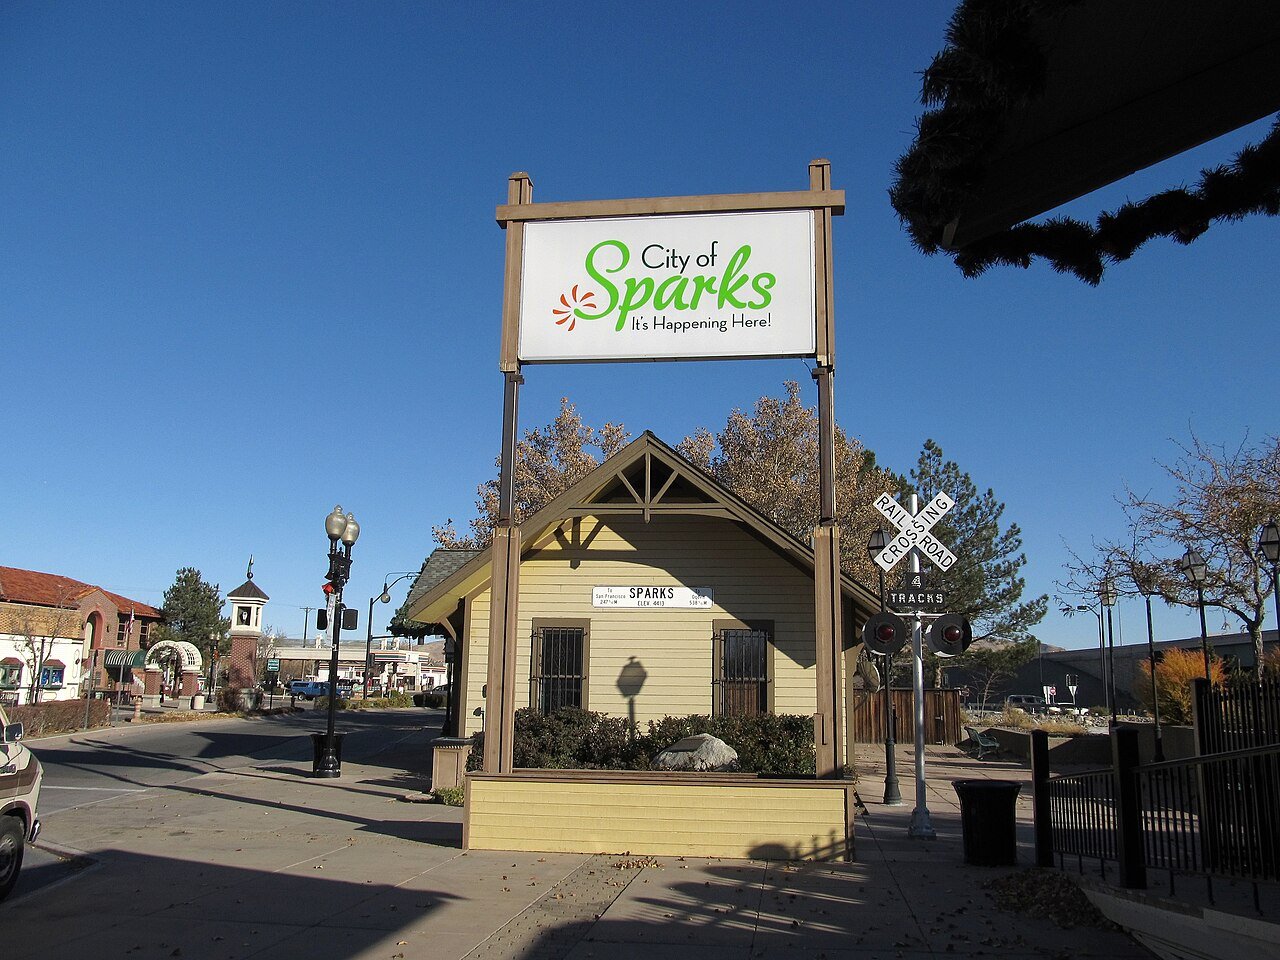
30 Sparks Sparks110,024 people $2,257/yr $483,800 0.47%
31 Mesquite22,059 people $2,278/yr $388,600 0.59%
32 Reno Reno273,212 people $2,358/yr $548,300 0.43%
33 Map of Gardnerville Gardnerville5,486 people $2,460/yr $487,300 0.50%
34 Map of Indian Hills Indian Hills5,527 people $2,505/yr $483,800 0.52%
35 Henderson332,141 people $2,520/yr $484,900 0.52%
36 Enterprise240,464 people $2,541/yr $475,500 0.53%
37 Map of Spanish Springs Spanish Springs17,980 people $2,867/yr $623,900 0.46%
38 Johnson Lane6,467 people $3,174/yr $764,100 0.42%
39 Minden3,707 people $3,411/yr $586,000 0.58%
40 Summerlin South31,354 people $3,711/yr $672,400 0.55%
41 Incline Village9,272 people $6,313/yr $1,454,600 0.43%

How this ranking works

We rank every town by the median yearly real-estate tax bill homeowners actually pay (the tax rate column is that bill divided by the median home value). The town with the lowest figure ranks #1. For comparison, the figure for Nevada as a whole is $2,027/yr.

Only towns with at least 2,500 residents are ranked; Census estimates for smaller places are too uncertain. Population and income: U.S. Census Bureau American Community Survey 5-year estimates. Town photos: Wikimedia Commons, credited on each town’s page.

Same ranking in other states