NENebraska rankings

Towns with the lowest depression rates in Nebraska

Ranked by the share of adults who have ever been told by a doctor that they have depression, as estimated by the CDC. 61 towns with 2,500+ residents.
CDC PLACES health estimates, 2025 release

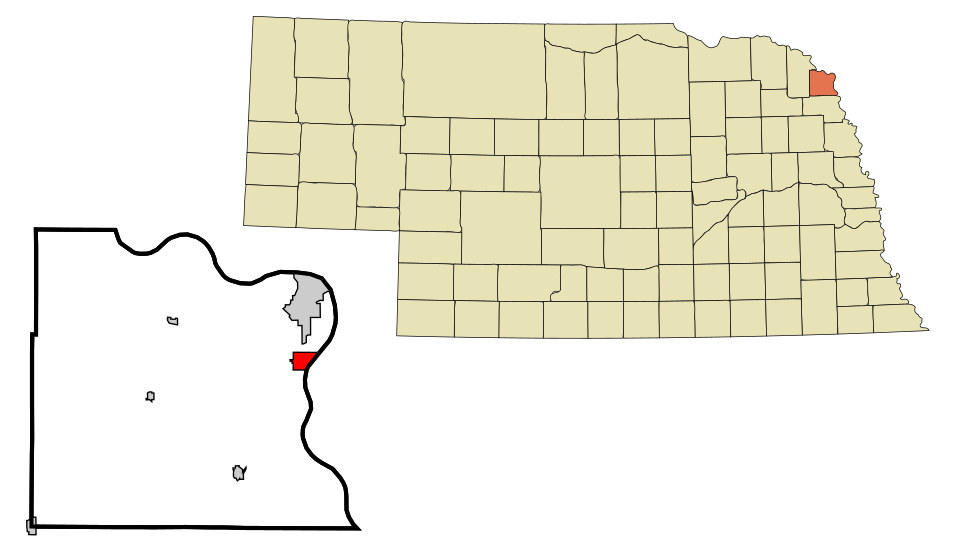
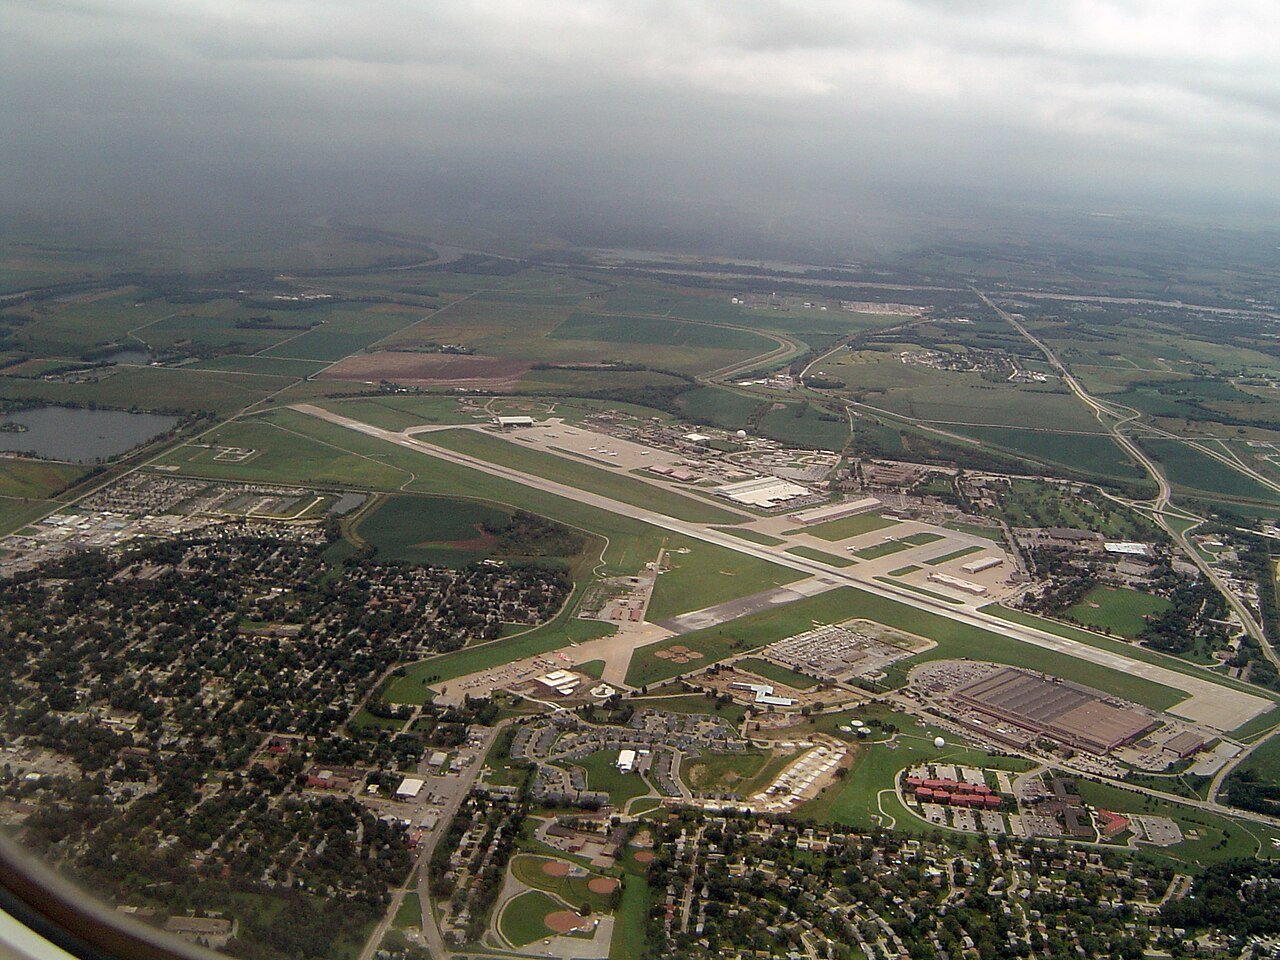
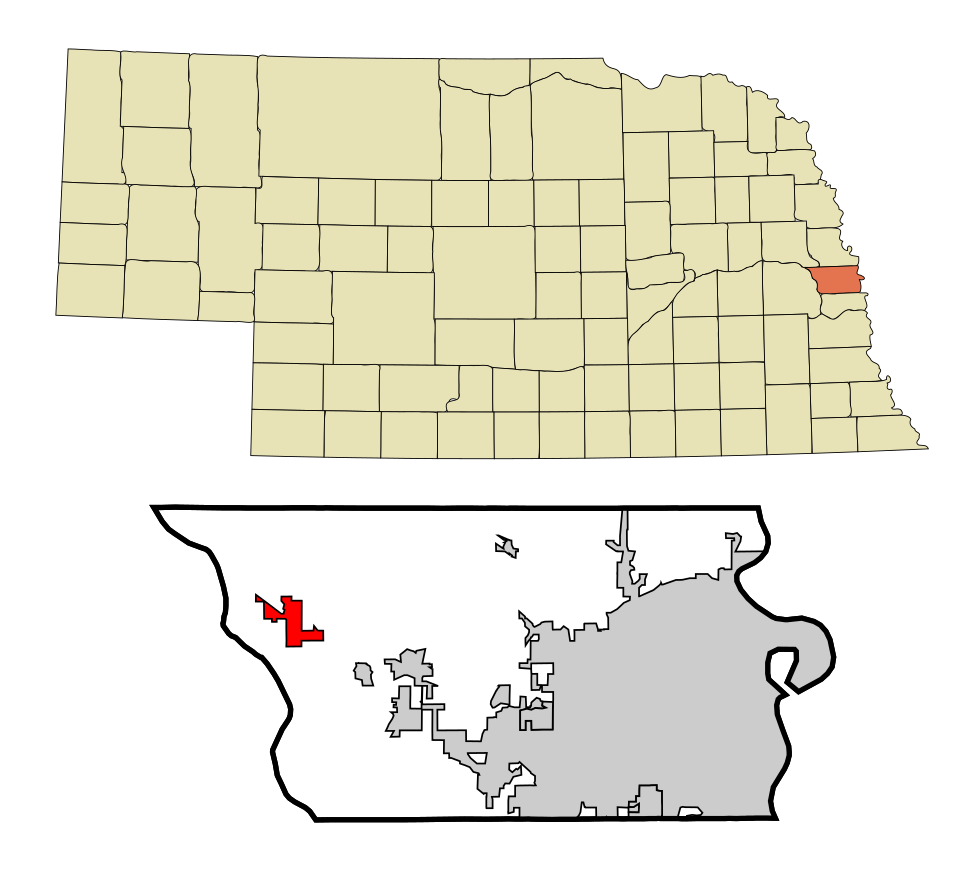
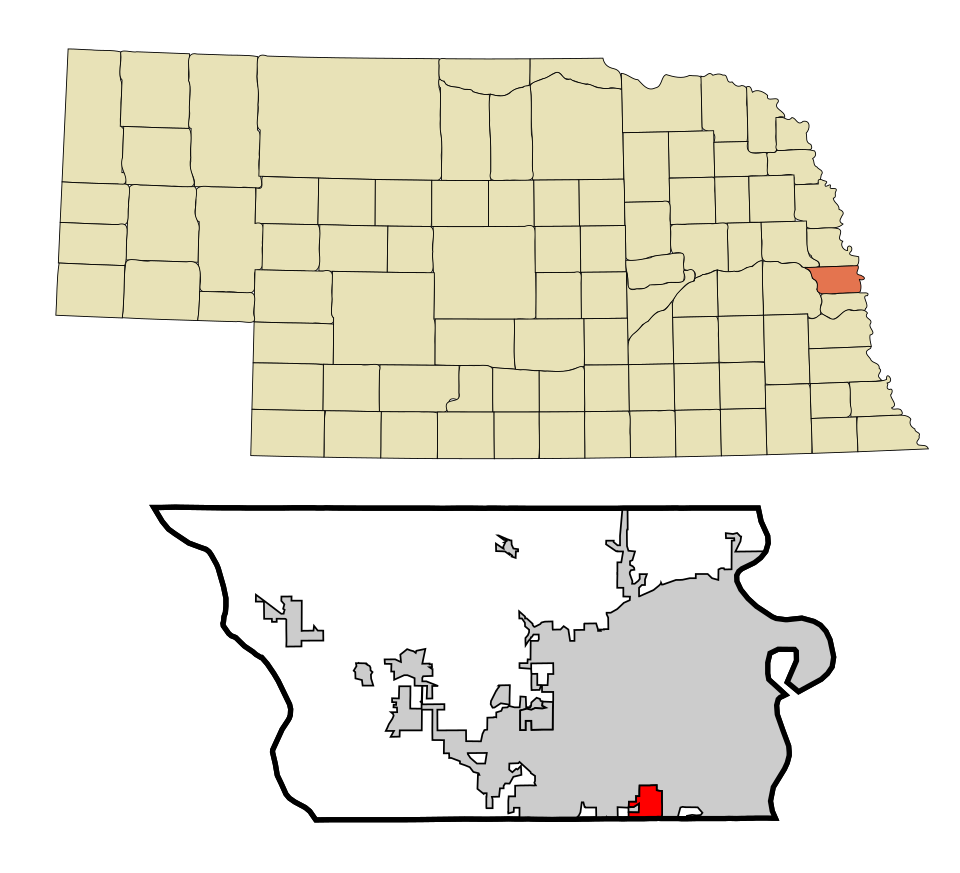
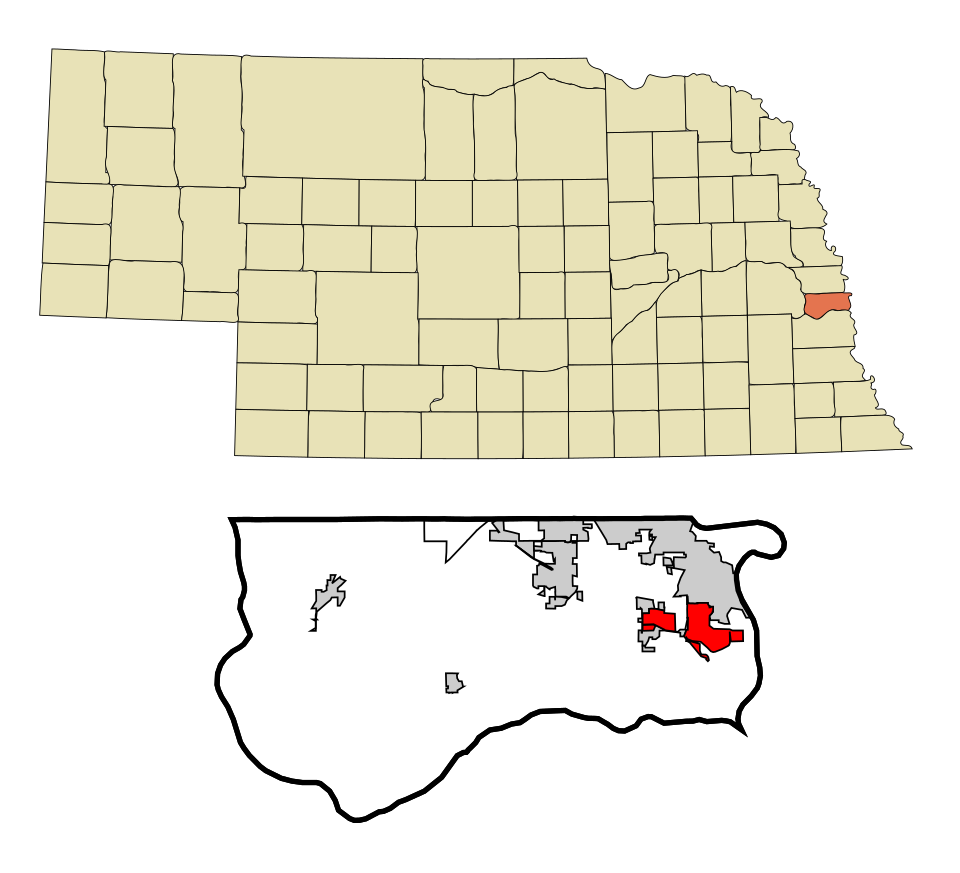
Map of Offutt AFB
Nebraska · Lowest depression

Where Offutt AFB lands: #54 of 61

20% of adults have been diagnosed with depression · Visit Offutt AFB →
#TownAdults with depressionLikely rangePopulation
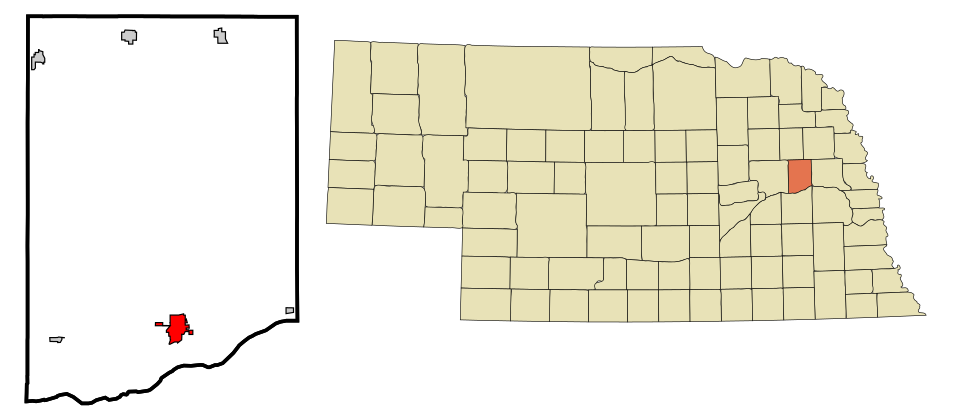
1 Map of Schuyler Schuyler6,578 people 14% 12–16% 6,578
2 Lexington Lexington10,862 people 15% 12–17% 10,862
T3 Map of South Sioux City South Sioux City13,907 people 16% 14–18% 13,907
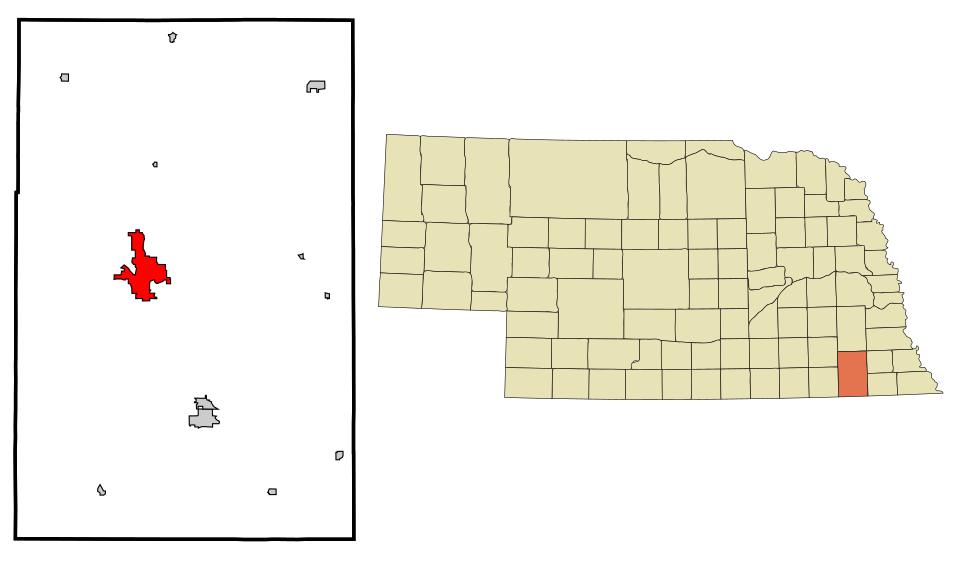
T3 Columbus Columbus24,488 people 16% 14–19% 24,488
T3 Columbus ColumbusPlatte County · 3,313 people 16% 14–19% 3,313
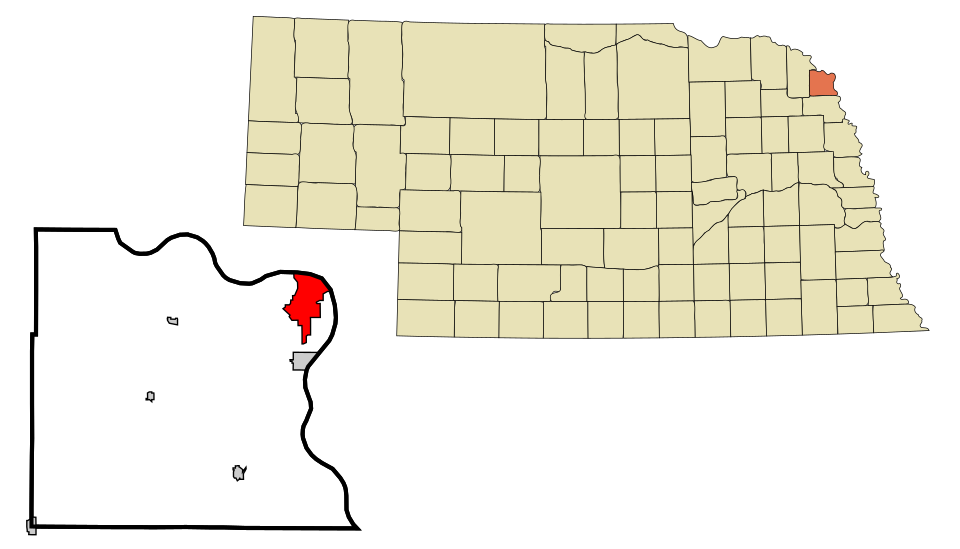
T3 Map of Dakota City Dakota City2,675 people 16% 14–19% 2,675
T3 Map of Crete Crete7,527 people 16% 14–19% 7,527
T3 Ogallala Ogallala4,777 people 16% 14–19% 4,777
T3 Map of West Point West Point3,471 people 16% 14–19% 3,471
T3 David City David City3,017 people 16% 14–19% 3,017
T11 Norfolk Norfolk26,054 people 17% 14–19% 26,054
T11 Grand Island Grand Island52,884 people 17% 14–19% 52,884
T11 Map of Wahoo Wahoo4,929 people 17% 14–20% 4,929
T11 O'Neill O'Neill3,570 people 17% 14–20% 3,570
T11 Map of Ashland AshlandSaunders County · 3,071 people 17% 14–20% 3,071
T11 Map of Fremont Fremont27,567 people 17% 15–19% 27,567
T11 Map of Gothenburg Gothenburg3,452 people 17% 14–20% 3,452
T11 Map of Union UnionSaunders County · 2,563 people 17% 14–20% 2,563
T11 Aurora Aurora4,664 people 17% 14–20% 4,664
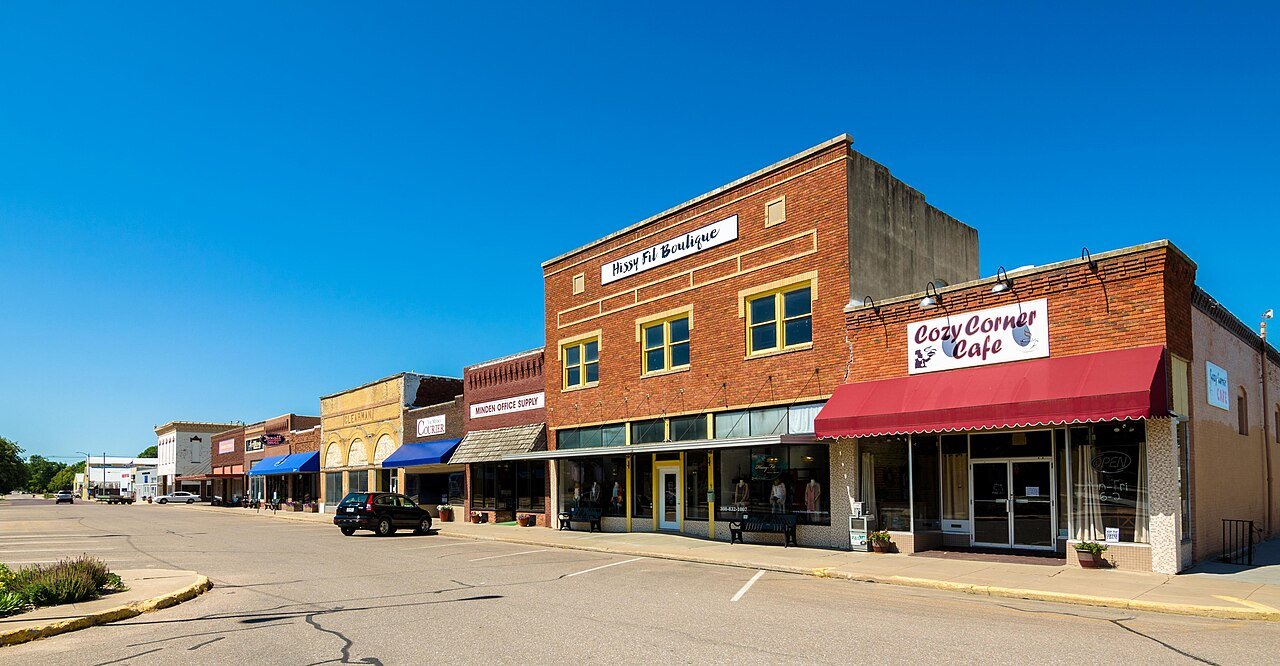
T11 Minden Minden3,108 people 17% 14–20% 3,108
T11 Map of Valentine Valentine2,633 people 17% 15–20% 2,633
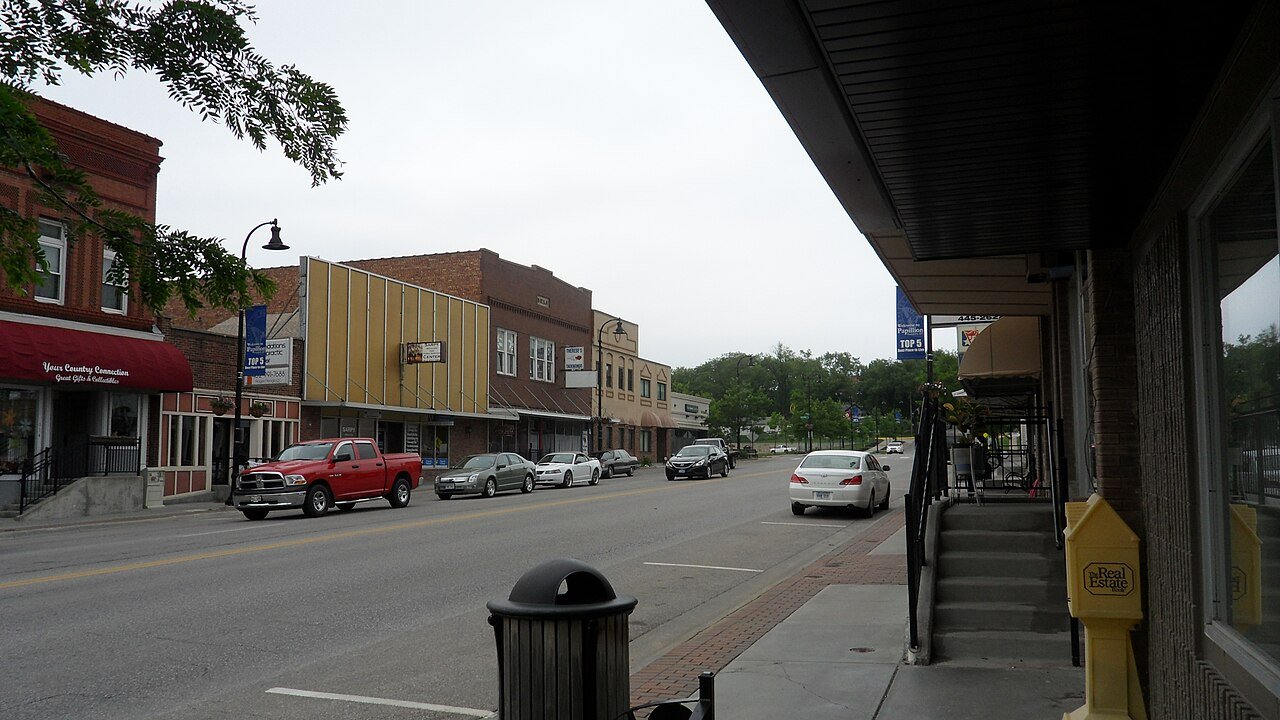
T11 Papillion Papillion25,244 people 17% 15–20% 25,244
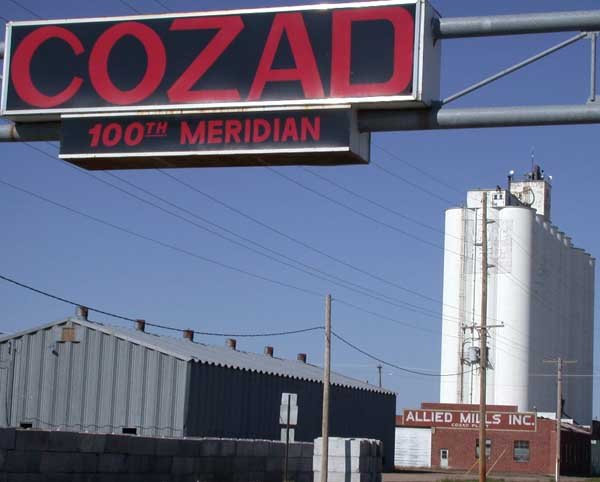
T11 Cozad Cozad3,937 people 17% 15–20% 3,937
T11 Broken Bow Broken Bow3,502 people 17% 15–20% 3,502
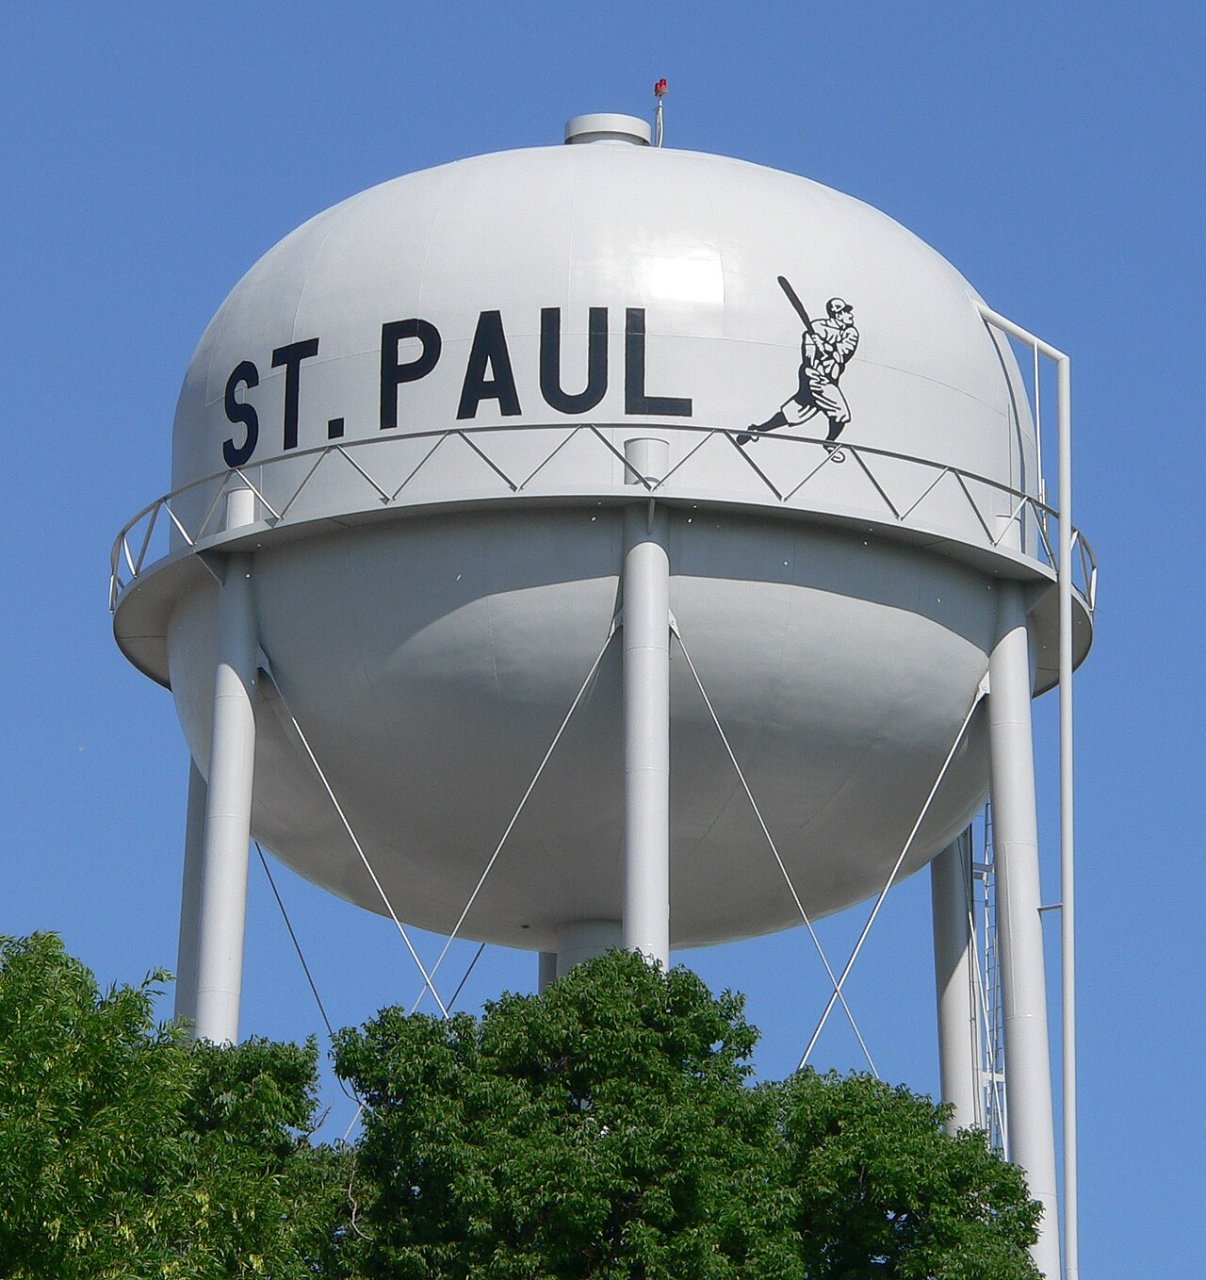
T11 St. Paul St. Paul2,758 people 17% 14–21% 2,758
T11 Map of Alliance Alliance8,075 people 17% 15–20% 8,075
T27 Scottsbluff Scottsbluff14,376 people 18% 15–20% 14,376
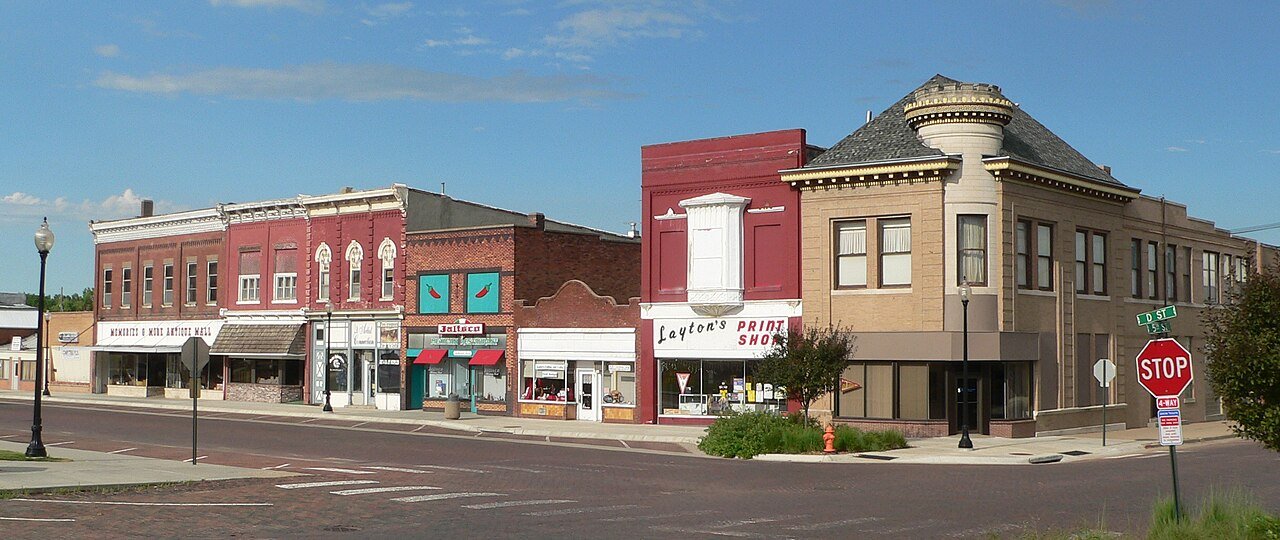
T27 Gretna Gretna9,193 people 18% 15–20% 9,193
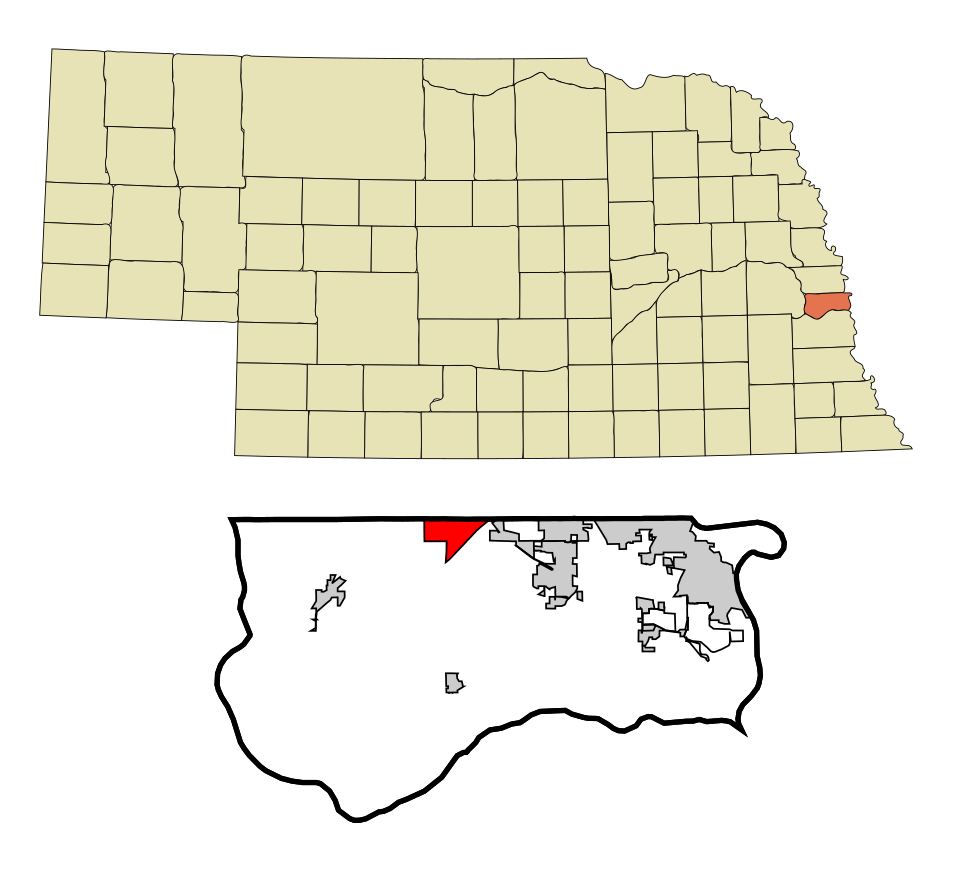
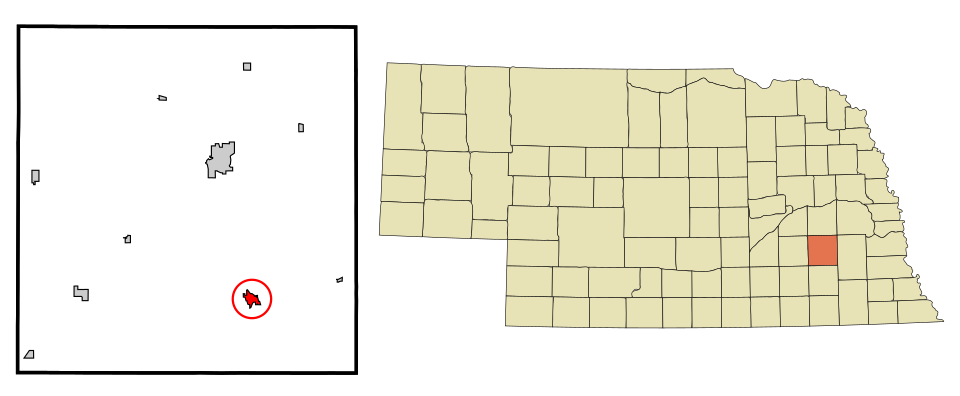
T27 Bellevue Bellevue64,510 people 18% 16–20% 64,510
T27 Map of York York8,141 people 18% 15–21% 8,141
T27 Township 2Washington County · 3,195 people 18% 15–21% 3,195
T27 La Vista La Vista16,563 people 18% 16–20% 16,563
T27 Map of Gering Gering8,550 people 18% 15–21% 8,550
T27 Nebraska City Nebraska City7,369 people 18% 15–21% 7,369
T27 Sidney Sidney6,419 people 18% 15–21% 6,419
T27 Blair Blair7,914 people 18% 15–21% 7,914
T27 Township 1Washington County · 4,458 people 18% 16–21% 4,458
T27 Map of Beatrice Beatrice12,225 people 18% 15–21% 12,225
T27 Map of Falls City Falls City4,077 people 18% 15–21% 4,077
T27 Map of Central City Central City3,061 people 18% 16–22% 3,061
T27 Township 7Washington County · 2,731 people 18% 16–21% 2,731
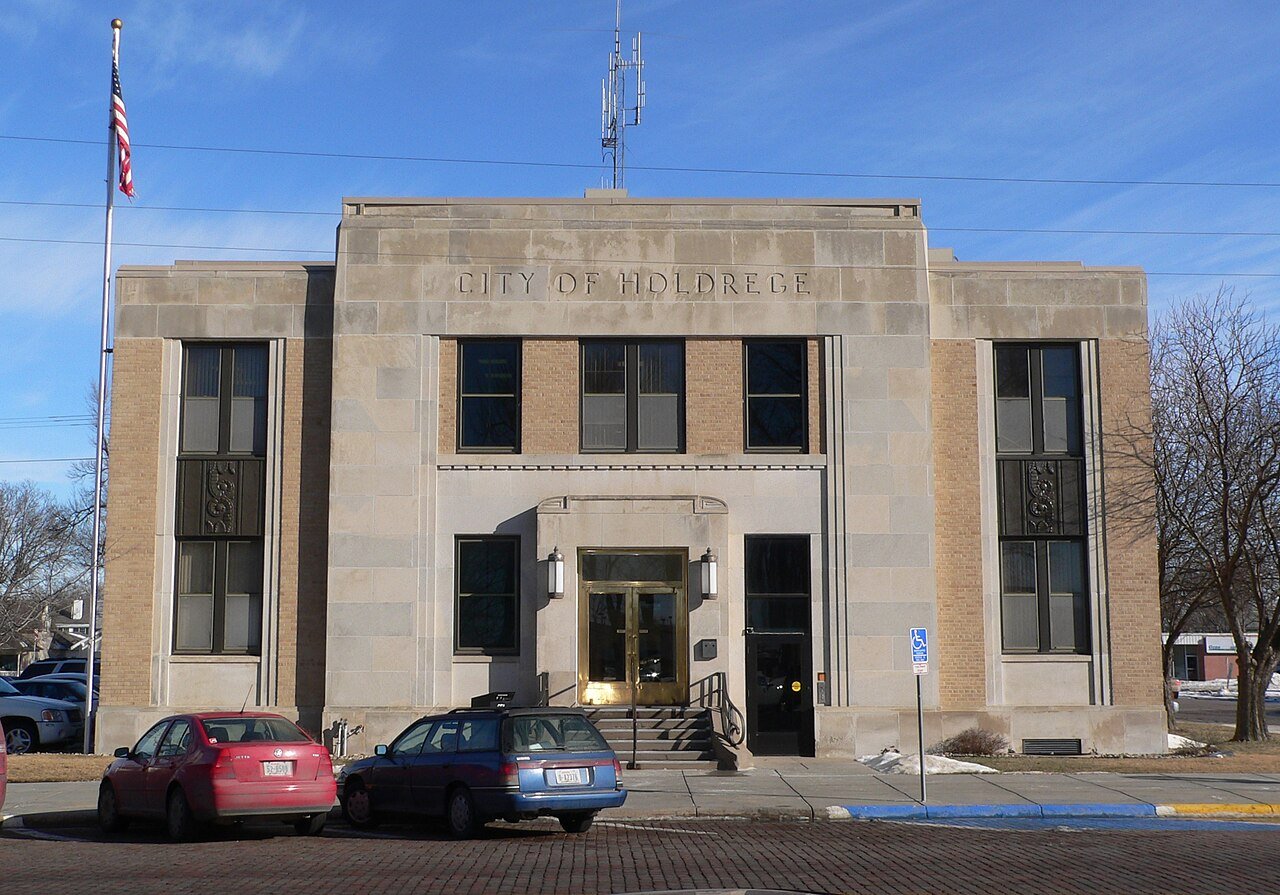
T42 Holdrege Holdrege5,546 people 19% 16–22% 5,546
T42 Fairbury Fairbury3,888 people 19% 16–22% 3,888
T42 Map of Chalco Chalco10,595 people 19% 16–21% 10,595
T42 Map of Milford Milford2,565 people 19% 16–22% 2,565
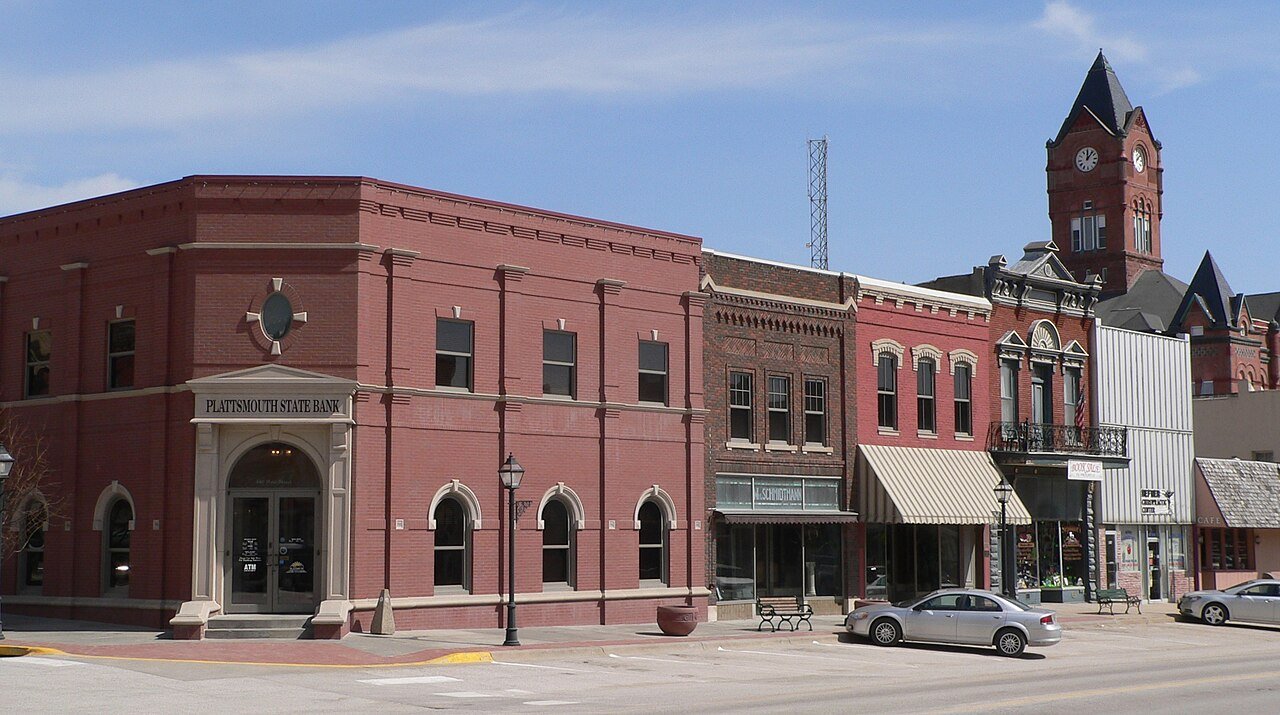
T42 Plattsmouth Plattsmouth6,731 people 19% 16–22% 6,731
T42 Map of Auburn Auburn3,470 people 19% 16–22% 3,470
T42 Kearney Kearney34,246 people 19% 16–22% 34,246
T42 Map of Valley Valley3,174 people 19% 17–21% 3,174
T42 Seward Seward7,678 people 19% 16–22% 7,678
T42 Omaha Omaha488,837 people 19% 17–21% 488,837
T42 Wayne Wayne6,121 people 19% 16–22% 6,121
T42 Map of Chadron Chadron5,160 people 19% 16–23% 5,160
T54 Map of North Platte North Platte22,831 people 20% 17–22% 22,831
T54 McCook McCook7,314 people 20% 17–23% 7,314
T54 Map of Ralston Ralston6,472 people 20% 18–22% 6,472
T54 Map of Hastings Hastings25,008 people 20% 17–23% 25,008
T54 Map of Offutt AFB Offutt AFB6,074 people 20% 18–23% 6,074
T59 Map of Waverly Waverly4,440 people 21% 18–23% 4,440
T59 Lincoln Lincoln294,856 people 21% 19–23% 294,856
T59 Map of Hickman Hickman3,004 people 21% 19–23% 3,004

How this ranking works

We rank every town by the share of adults who have ever been told by a doctor that they have depression, as estimated by the CDC. The lowest share ranks #1. Across Nebraska it’s 18%.

These are the CDC’s modeled estimates, not a count: national survey answers combined with each area’s age, sex, race and income mix. Each carries a likely range (shown in the table), so we rank on the whole percent and towns at the same figure share a rank (T = tied). Differences of a point or two are within the estimates’ margins.

Cities and villages use the CDC’s own estimate for that place. New England towns and townships, which the CDC doesn’t publish, use the ZIP codes that cover them, weighted by land area.

Only towns with at least 2,500 residents are ranked; Census estimates for smaller places are too uncertain. Population and income: U.S. Census Bureau American Community Survey 5-year estimates. Health estimates: CDC PLACES. Town photos: Wikimedia Commons, credited on each town’s page.

Same ranking in other states