MTMontana rankings

Towns with the lowest depression rates in Montana

Ranked by the share of adults who have ever been told by a doctor that they have depression, as estimated by the CDC. 42 towns with 2,500+ residents.
CDC PLACES health estimates, 2025 release

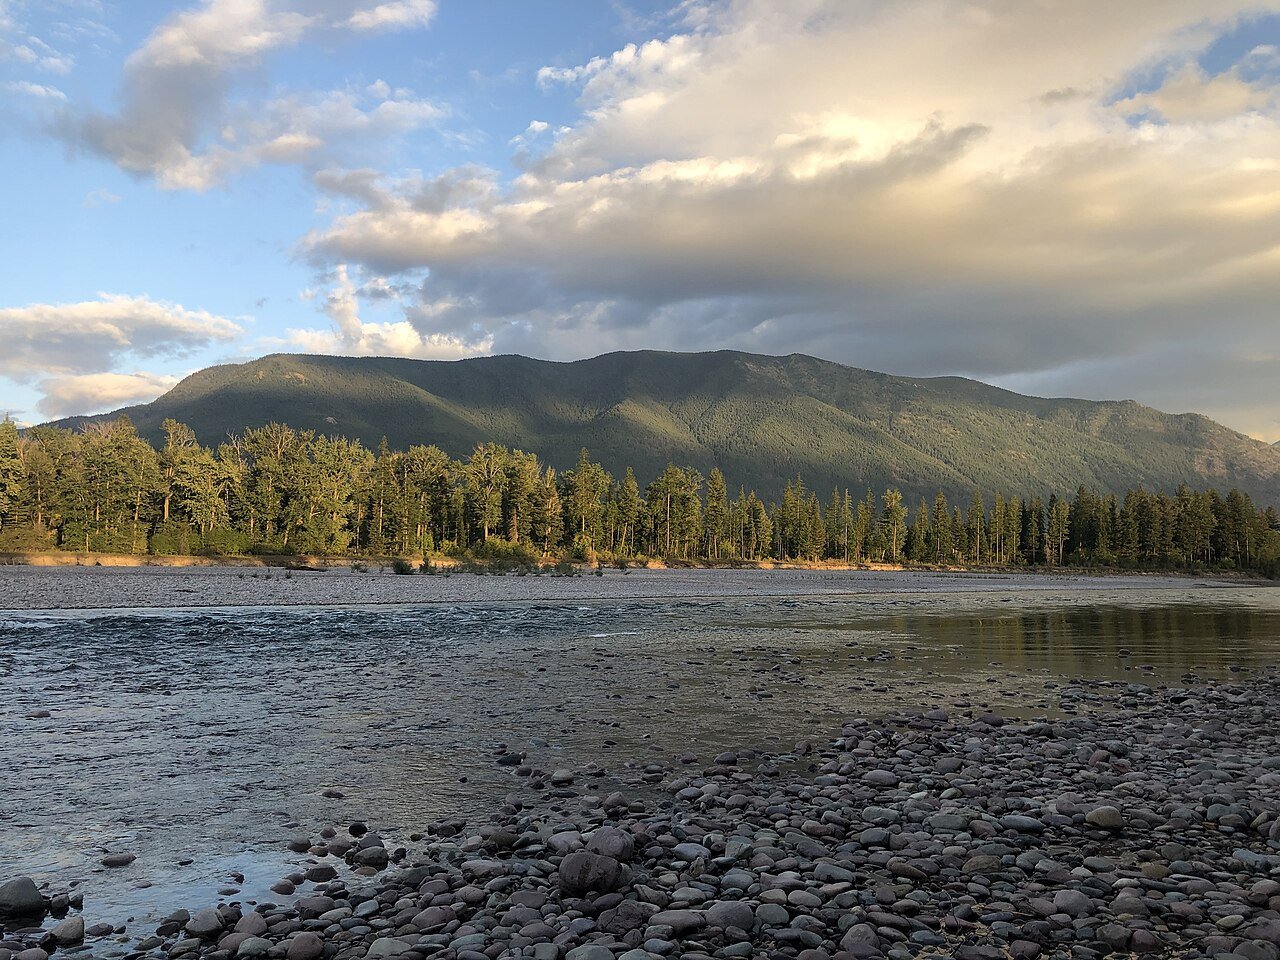
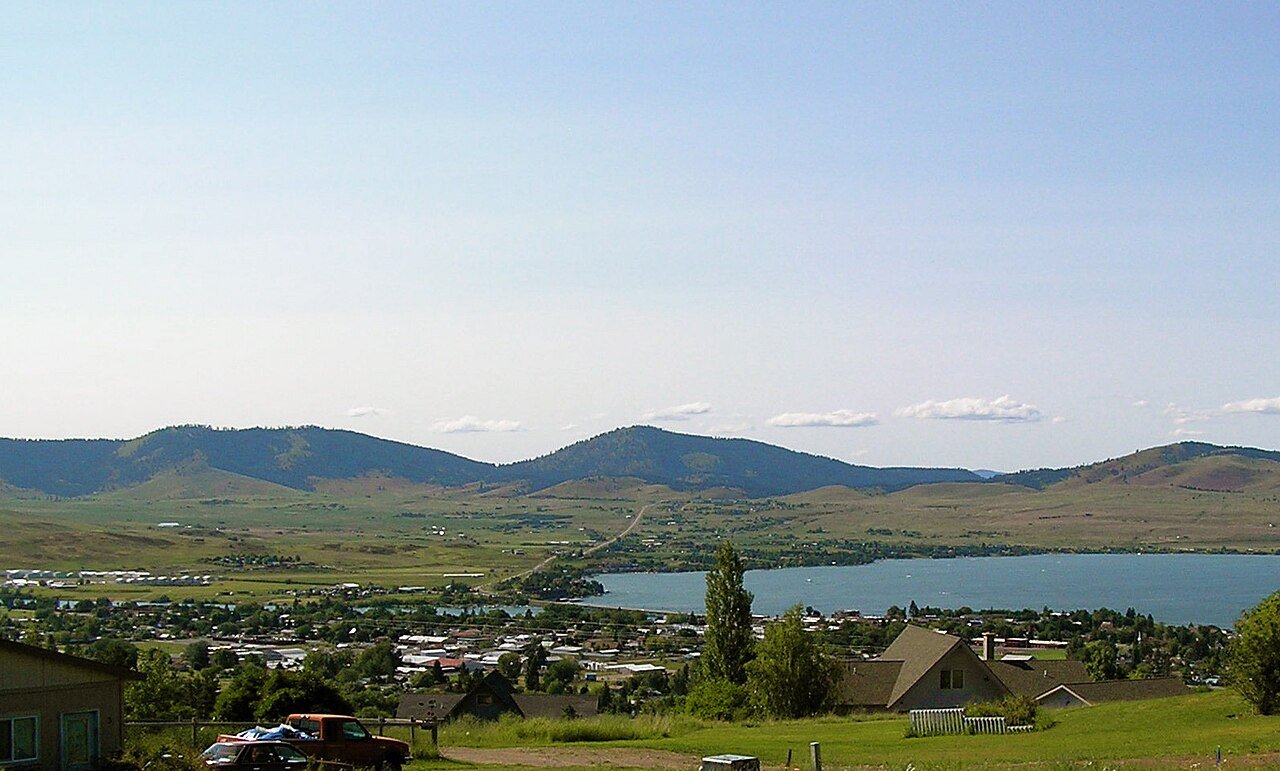
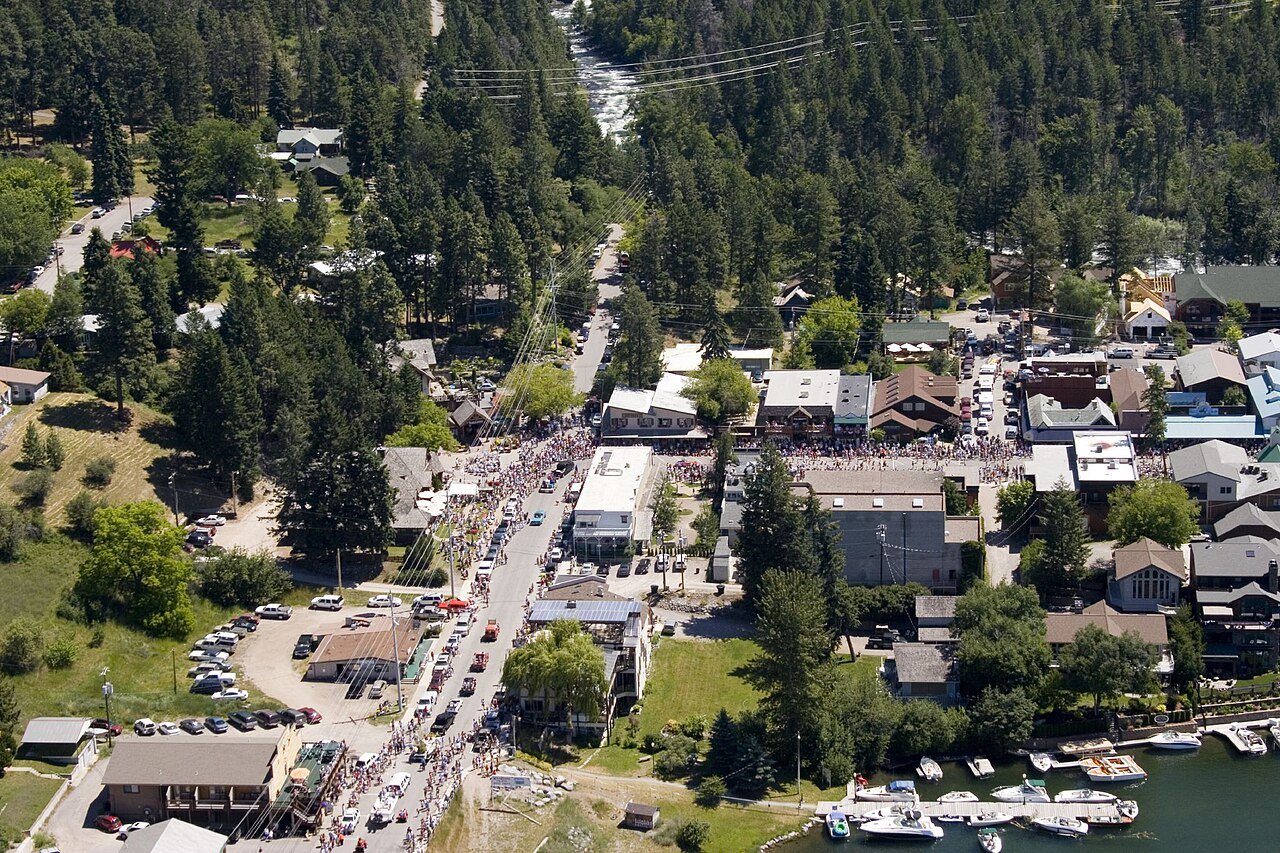
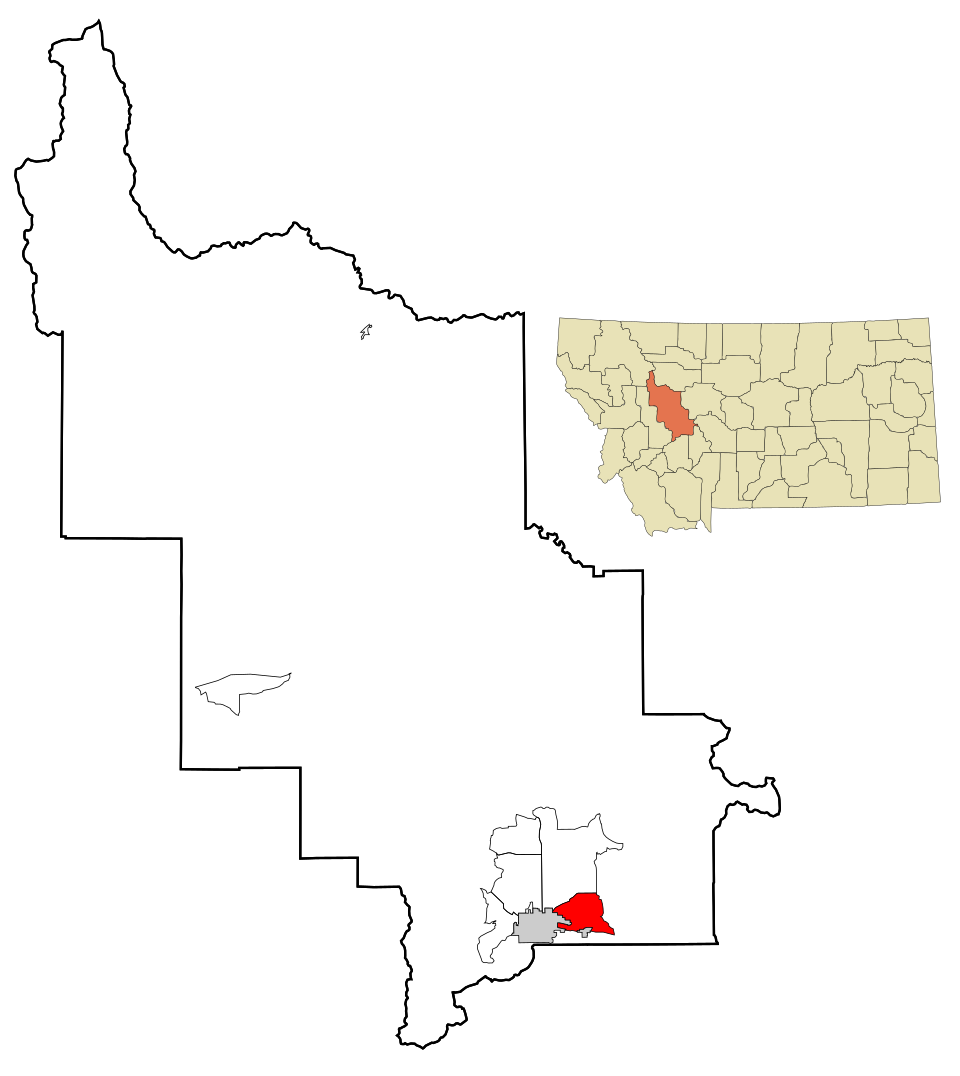
Polson
Montana · Lowest depression

Where Polson lands: #18 of 42

25% of adults have been diagnosed with depression · Visit Polson →
#TownAdults with depressionLikely rangePopulation
T1 Bigfork Bigfork5,565 people 22% 19–24% 5,565
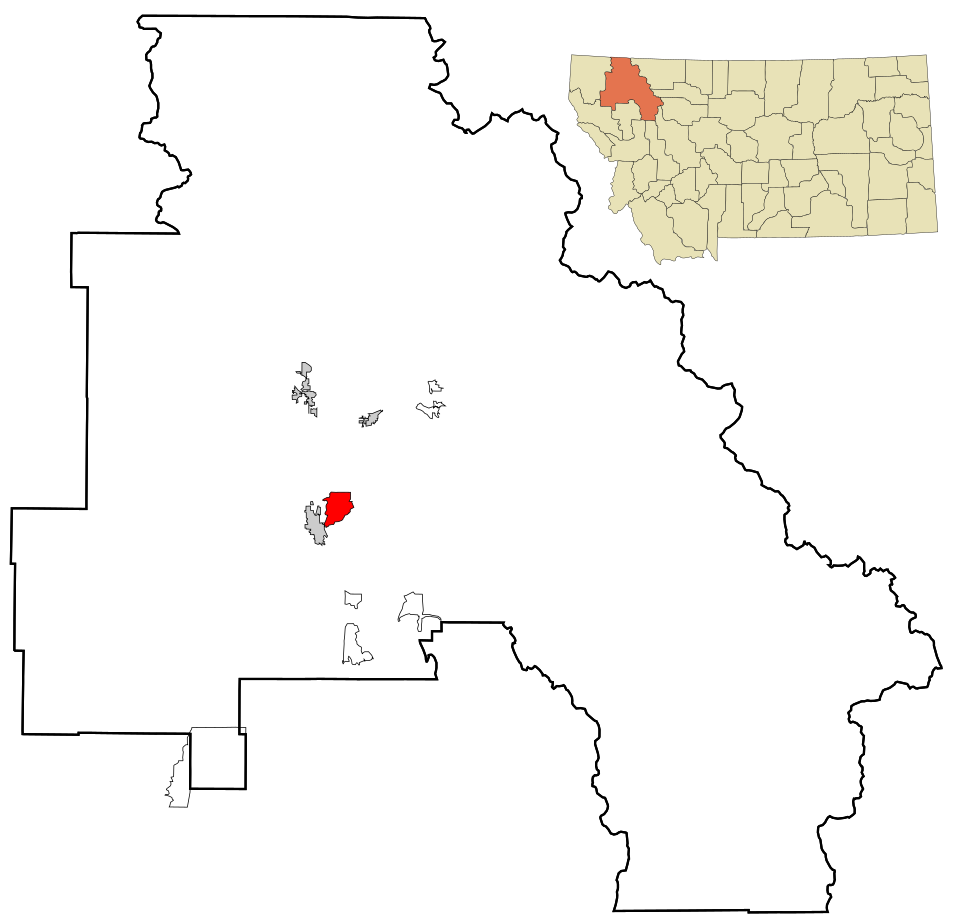
T1 Map of Montana City Montana City3,092 people 22% 19–25% 3,092
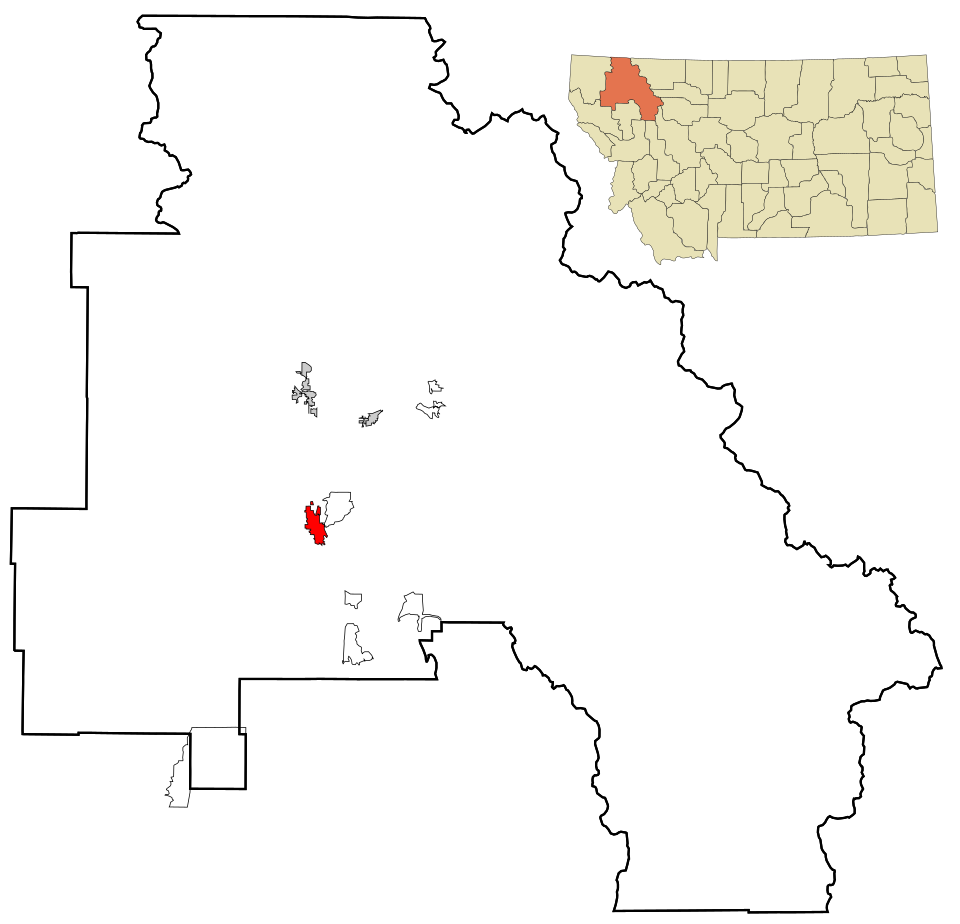
T1 Map of Four Corners Four Corners5,791 people 22% 20–25% 5,791
T4 Hamilton Hamilton5,101 people 23% 20–26% 5,101
T4 Shelby Shelby3,216 people 23% 19–26% 3,216
T4 Red Lodge Red Lodge2,502 people 23% 20–27% 2,502
T4 Whitefish Whitefish8,749 people 23% 20–26% 8,749
T8 Sidney Sidney6,171 people 24% 20–27% 6,171
T8 Glendive Glendive4,810 people 24% 20–27% 4,810
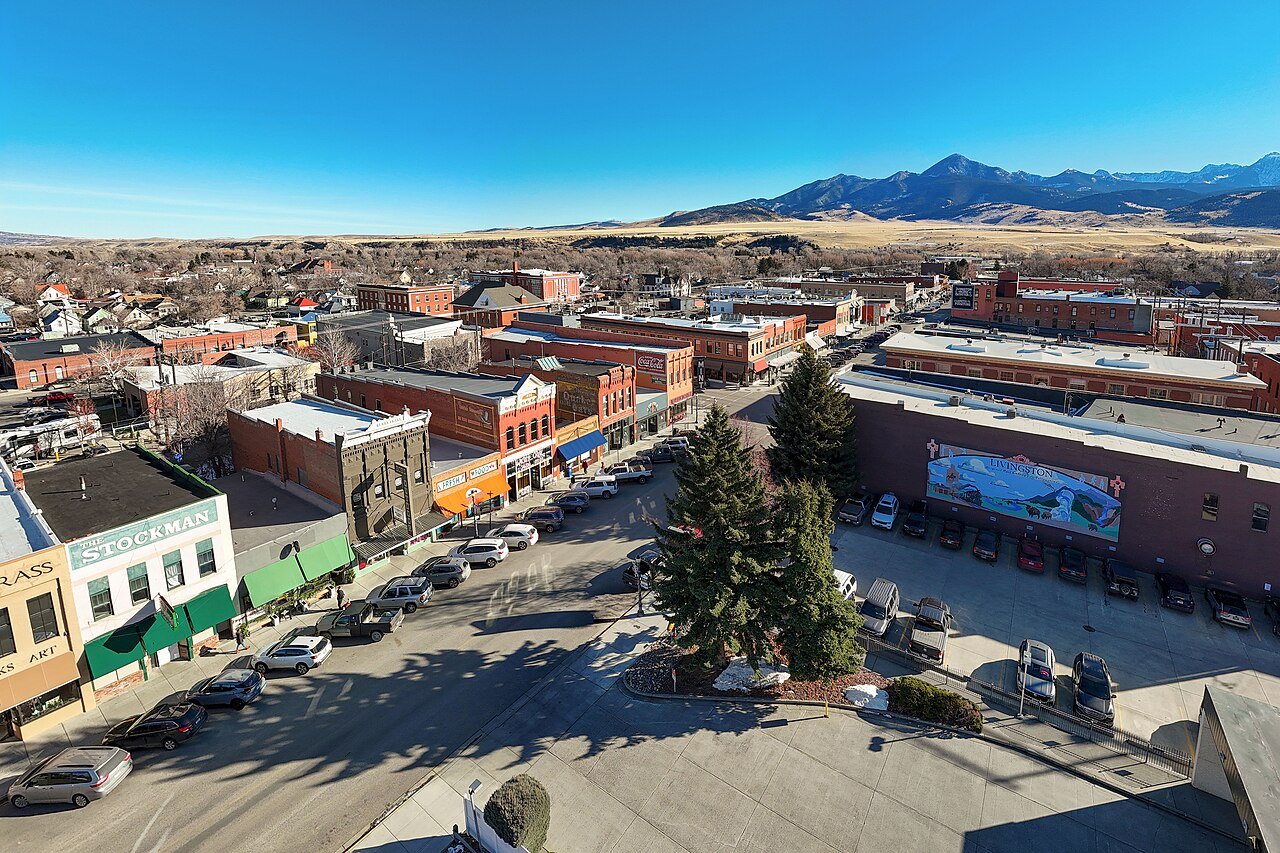
T8 Livingston Livingston8,780 people 24% 20–27% 8,780
T8 Lewistown Lewistown6,087 people 24% 21–28% 6,087
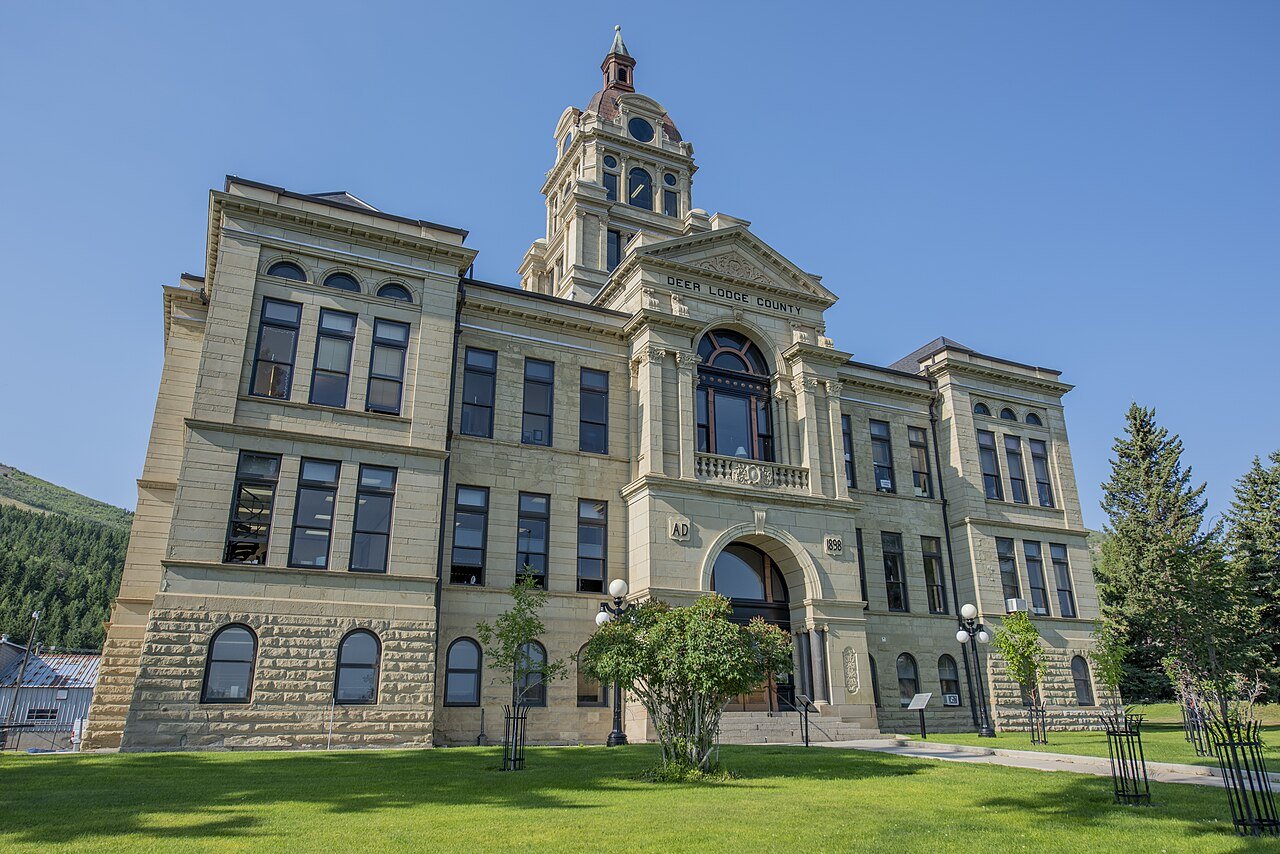
T8 Deer Lodge Deer Lodge3,021 people 24% 20–28% 3,021
T8 Glasgow Glasgow3,190 people 24% 21–28% 3,190
T8 Belgrade11,872 people 24% 21–27% 11,872
T8 Hardin Hardin3,742 people 24% 21–28% 3,742
T8 Anaconda-Deer Lodge County Anaconda-Deer Lodge County9,597 people 24% 21–28% 9,597
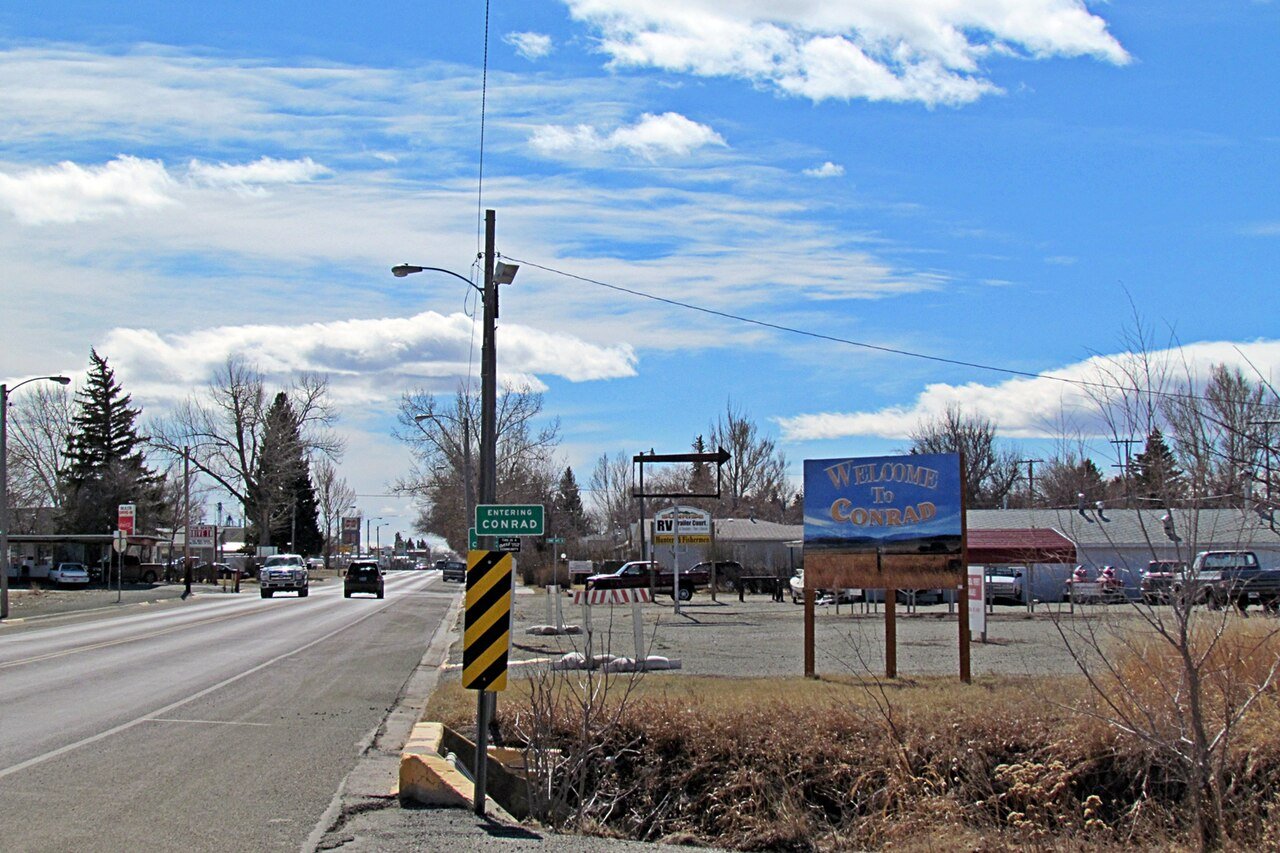
T8 Conrad Conrad2,618 people 24% 21–28% 2,618
T18 Bozeman Bozeman56,114 people 25% 22–28% 56,114

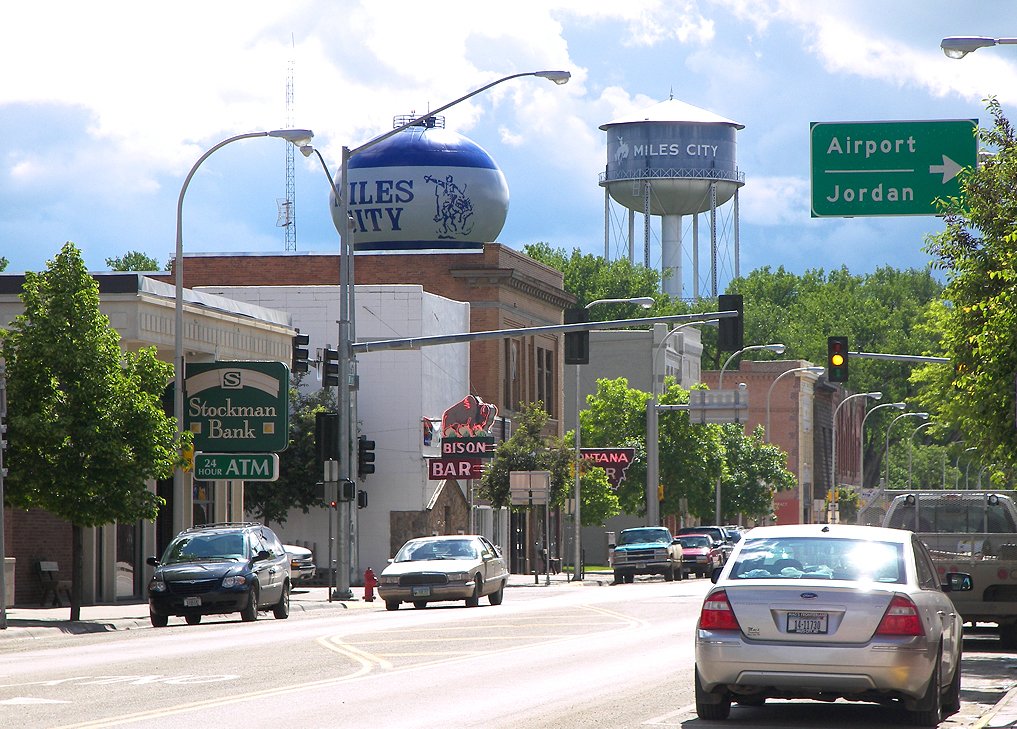
T18 Miles City Miles City8,407 people 25% 21–28% 8,407
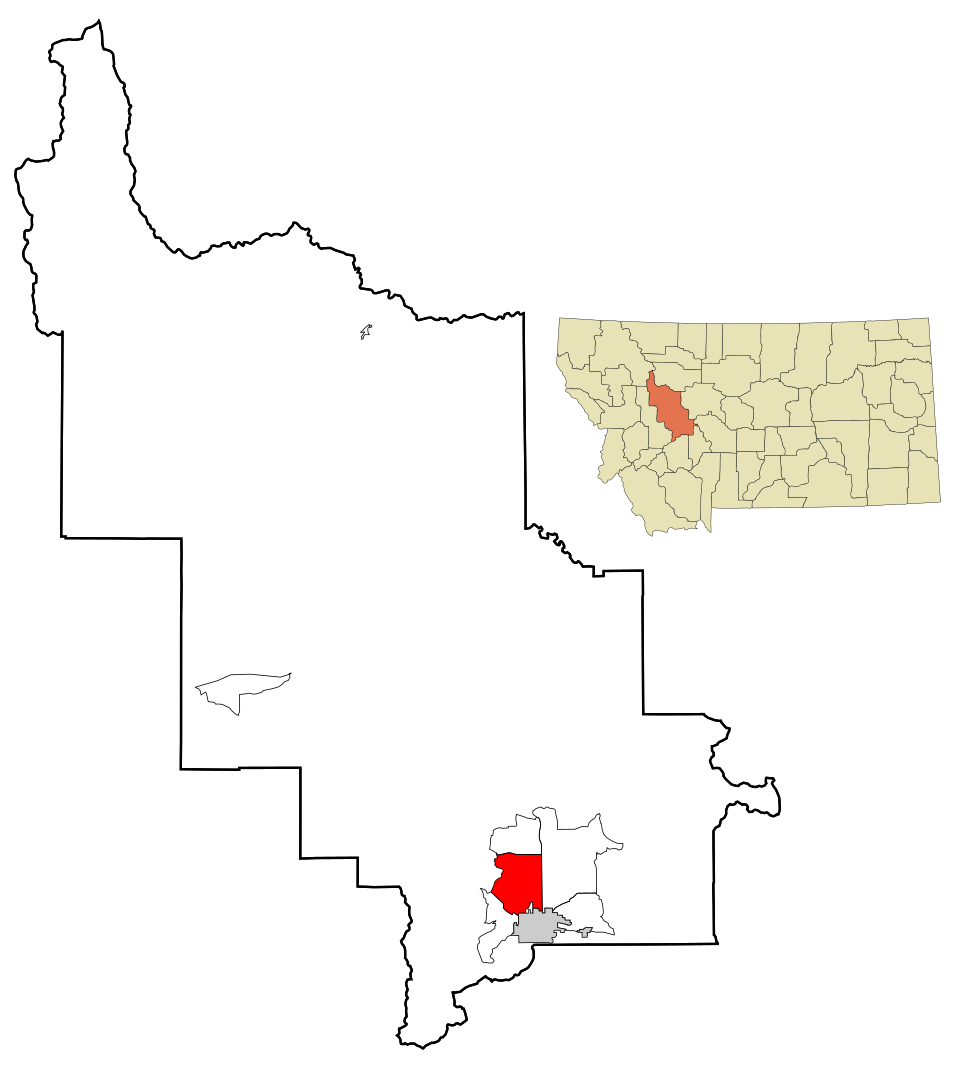
T18 Map of Evergreen Evergreen9,611 people 25% 22–28% 9,611
T18 Polson Polson5,428 people 25% 22–29% 5,428
T18 Map of Orchard Homes Orchard Homes5,588 people 25% 22–28% 5,588
T18 Map of Kalispell Kalispell28,504 people 25% 22–28% 28,504
T18 Columbia Falls Columbia Falls5,615 people 25% 22–29% 5,615
T25 Dillon Dillon4,085 people 26% 22–30% 4,085
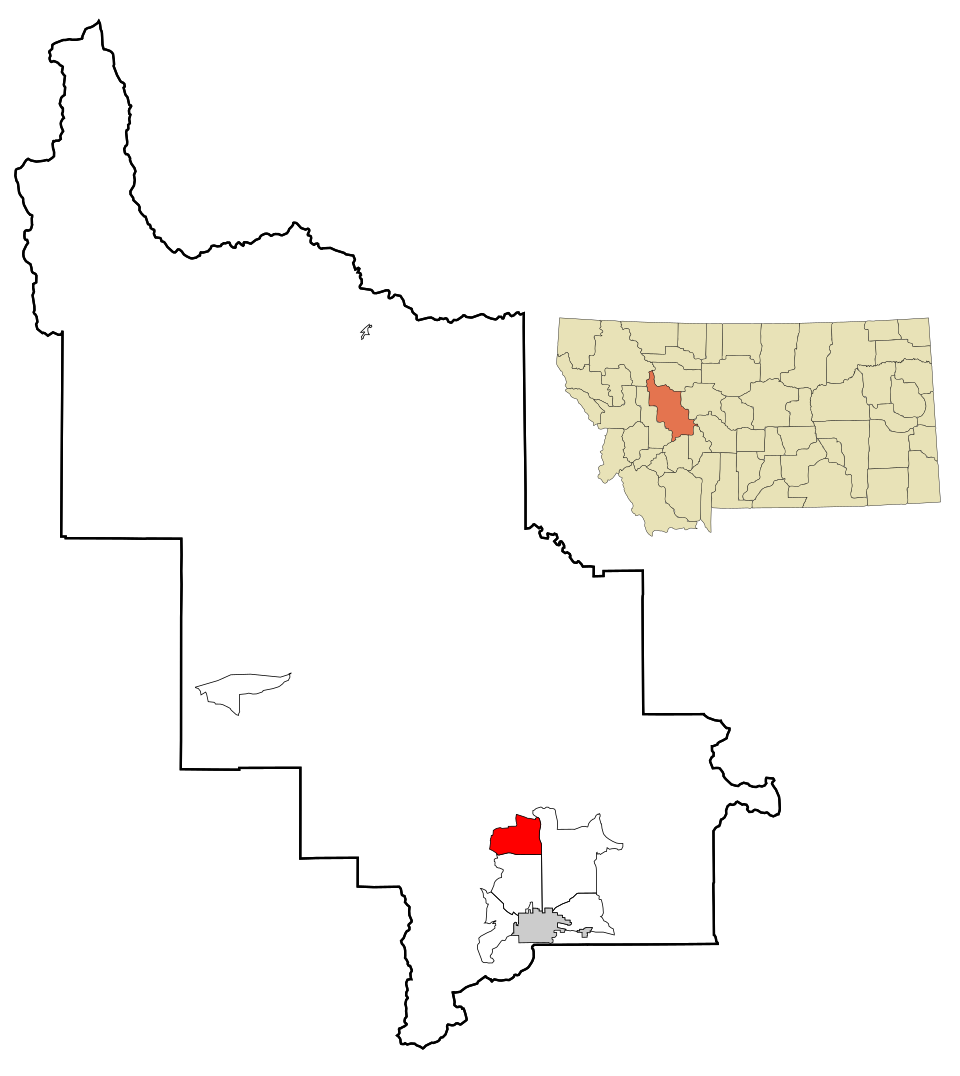
T25 Map of Helena Valley Northeast Helena Valley Northeast4,659 people 26% 23–29% 4,659
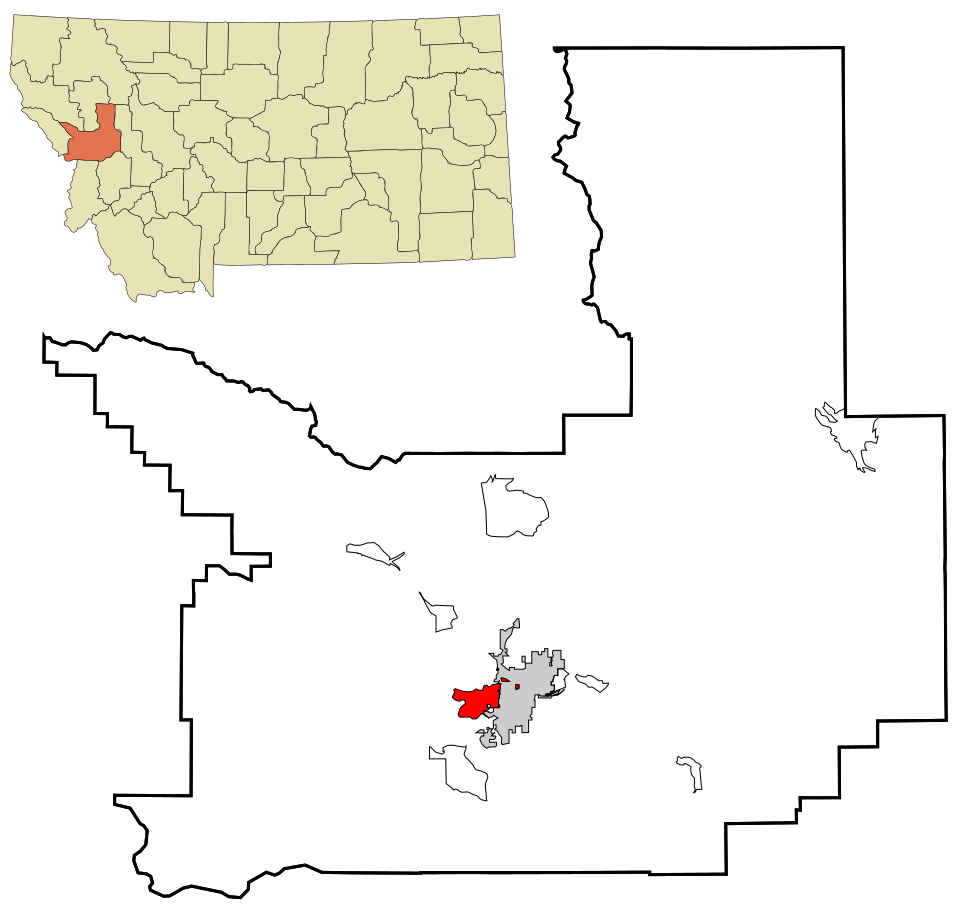
T25 Helena Helena33,639 people 26% 23–29% 33,639
T25 Libby Libby3,042 people 26% 23–30% 3,042
T25 Map of Cut Bank Cut Bank3,028 people 26% 23–30% 3,028
T25 Map of Helena Valley West Central Helena Valley West Central8,056 people 26% 23–30% 8,056
T25 Map of Helena Valley Northwest Helena Valley Northwest5,183 people 26% 23–30% 5,183
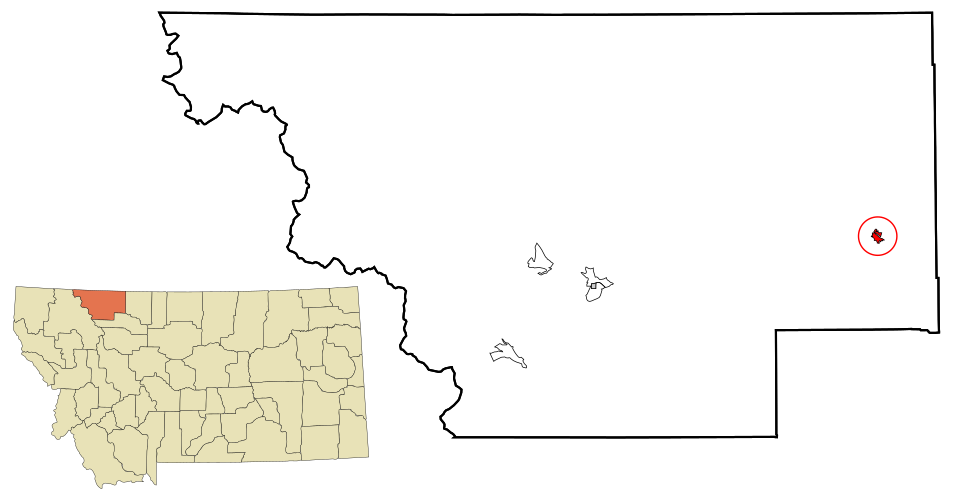
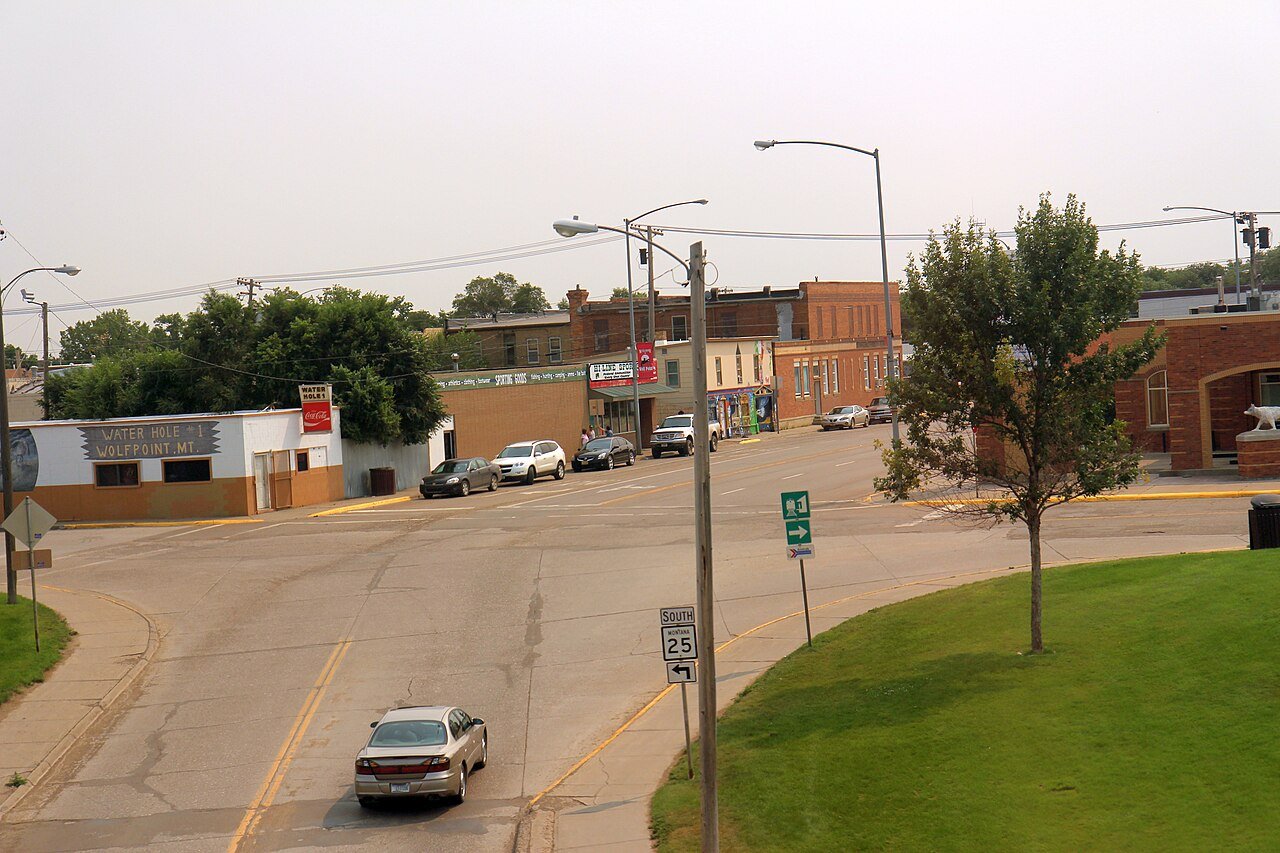
T25 Wolf Point Wolf Point2,602 people 26% 23–30% 2,602
T33 Map of Havre Havre9,258 people 27% 23–30% 9,258
T33 Map of North Browning North Browning3,144 people 27% 23–31% 3,144
T33 Missoula Missoula76,514 people 27% 24–30% 76,514
T36 Great Falls Great Falls60,329 people 28% 25–31% 60,329
T36 Billings Billings119,434 people 28% 25–31% 119,434
T36 Map of Helena Valley Southeast Helena Valley Southeast9,108 people 28% 25–31% 9,108
T36 Laurel Laurel7,215 people 28% 25–31% 7,215
T36 Lolo Lolo4,314 people 28% 25–31% 4,314
41 Lockwood Lockwood7,181 people 29% 26–32% 7,181
42 Malmstrom AFB Malmstrom AFB4,302 people 30% 27–33% 4,302

How this ranking works

We rank every town by the share of adults who have ever been told by a doctor that they have depression, as estimated by the CDC. The lowest share ranks #1. Across Montana it’s 25%.

These are the CDC’s modeled estimates, not a count: national survey answers combined with each area’s age, sex, race and income mix. Each carries a likely range (shown in the table), so we rank on the whole percent and towns at the same figure share a rank (T = tied). Differences of a point or two are within the estimates’ margins.

Cities and villages use the CDC’s own estimate for that place. New England towns and townships, which the CDC doesn’t publish, use the ZIP codes that cover them, weighted by land area.

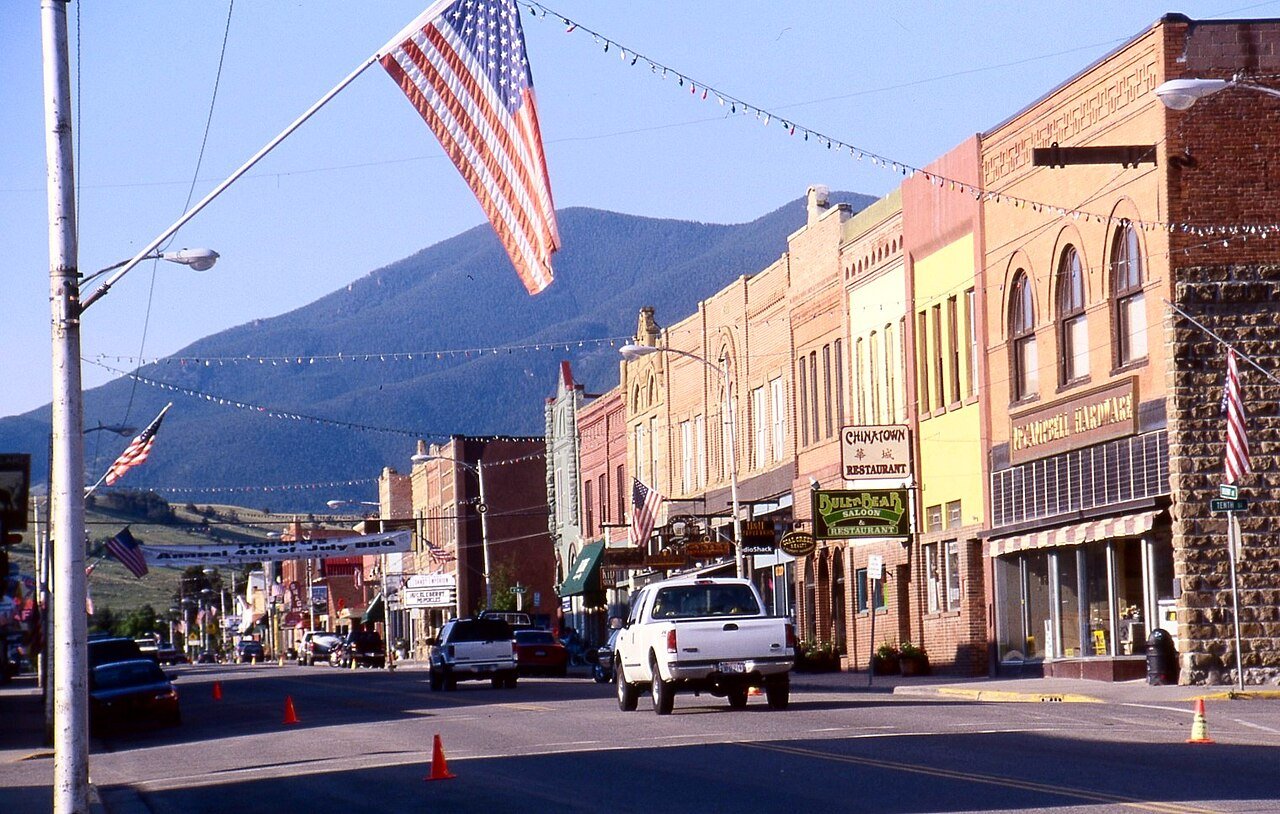
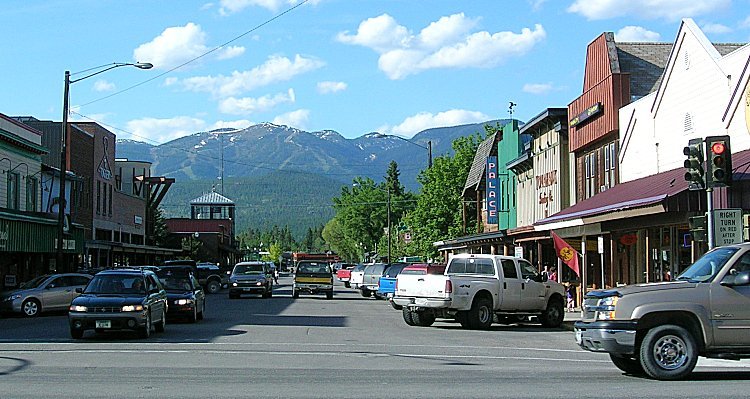
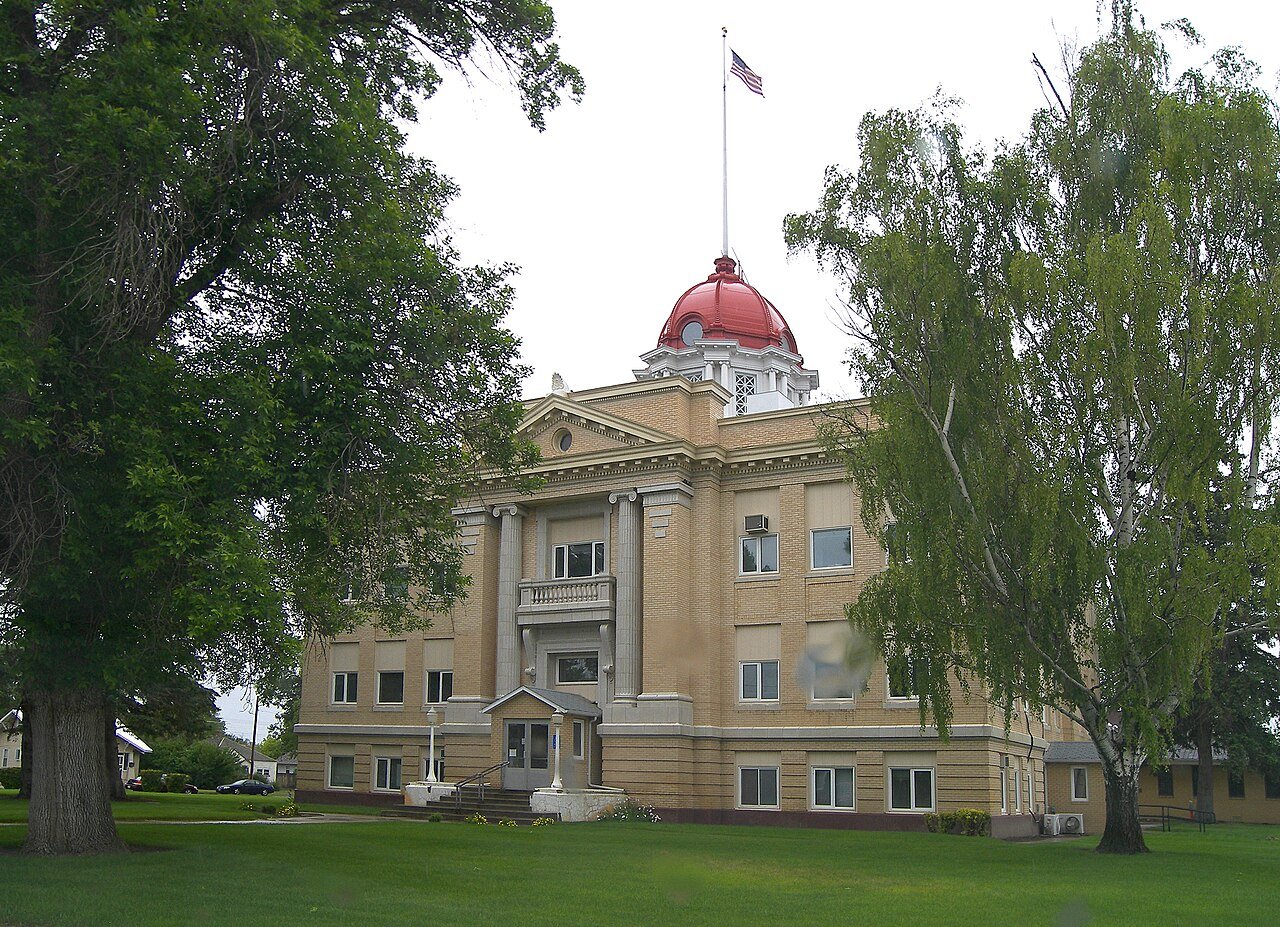
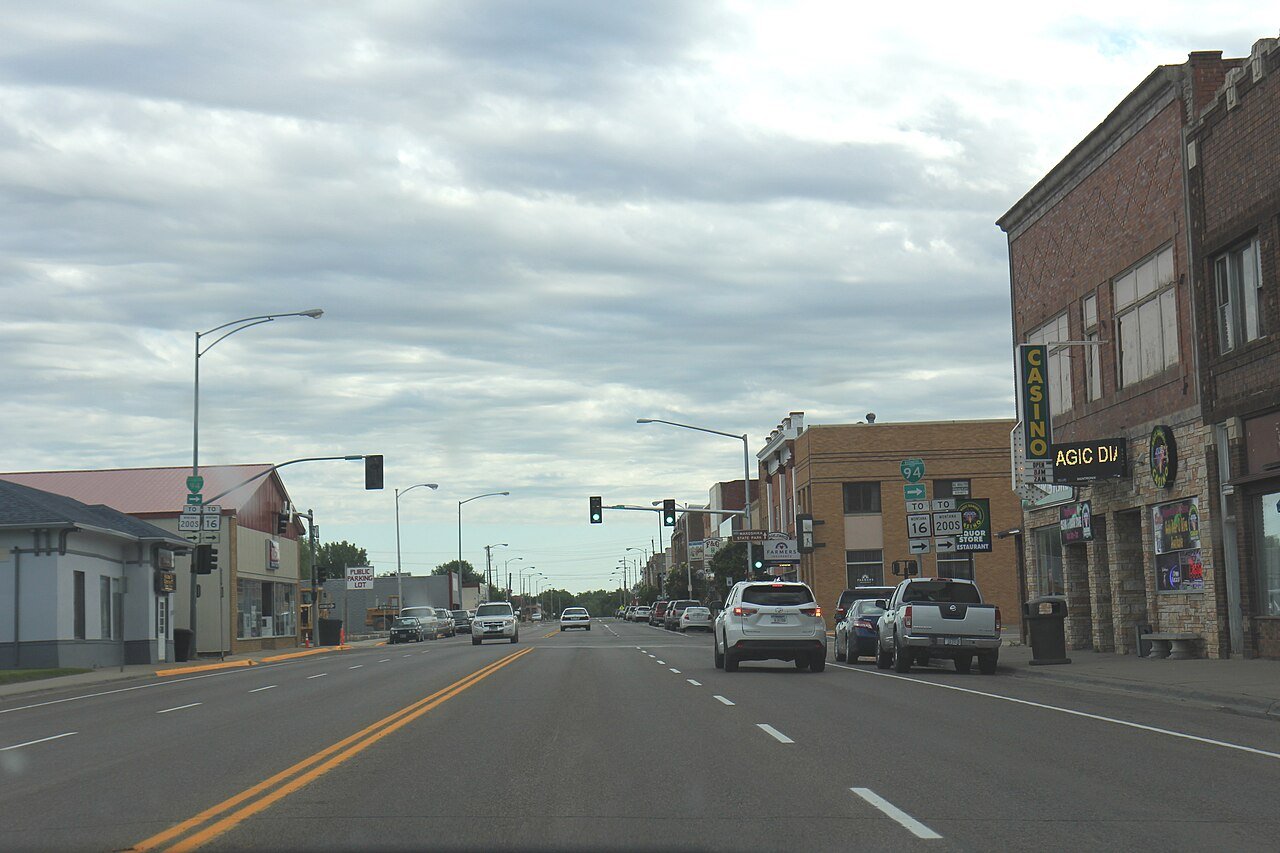
Only towns with at least 2,500 residents are ranked; Census estimates for smaller places are too uncertain. Population and income: U.S. Census Bureau American Community Survey 5-year estimates. Health estimates: CDC PLACES. Town photos: Wikimedia Commons, credited on each town’s page.

Same ranking in other states