Towns where housing hasn't kept up with growth in Louisiana
Ranked by how many new residents each town gained for every new home it permitted between the 2010 and 2020 censuses. 21 towns with 2,500+ residents.
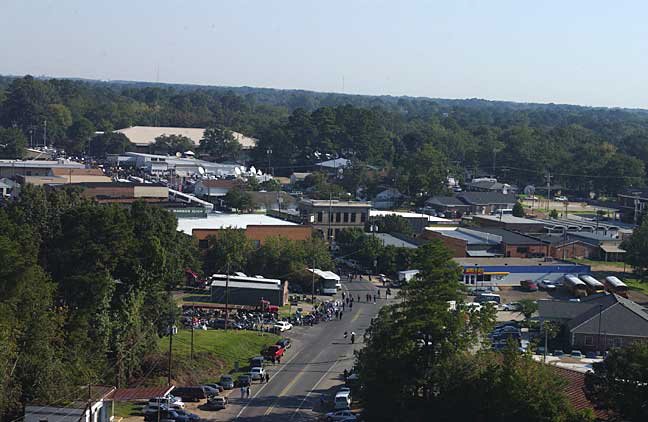 1
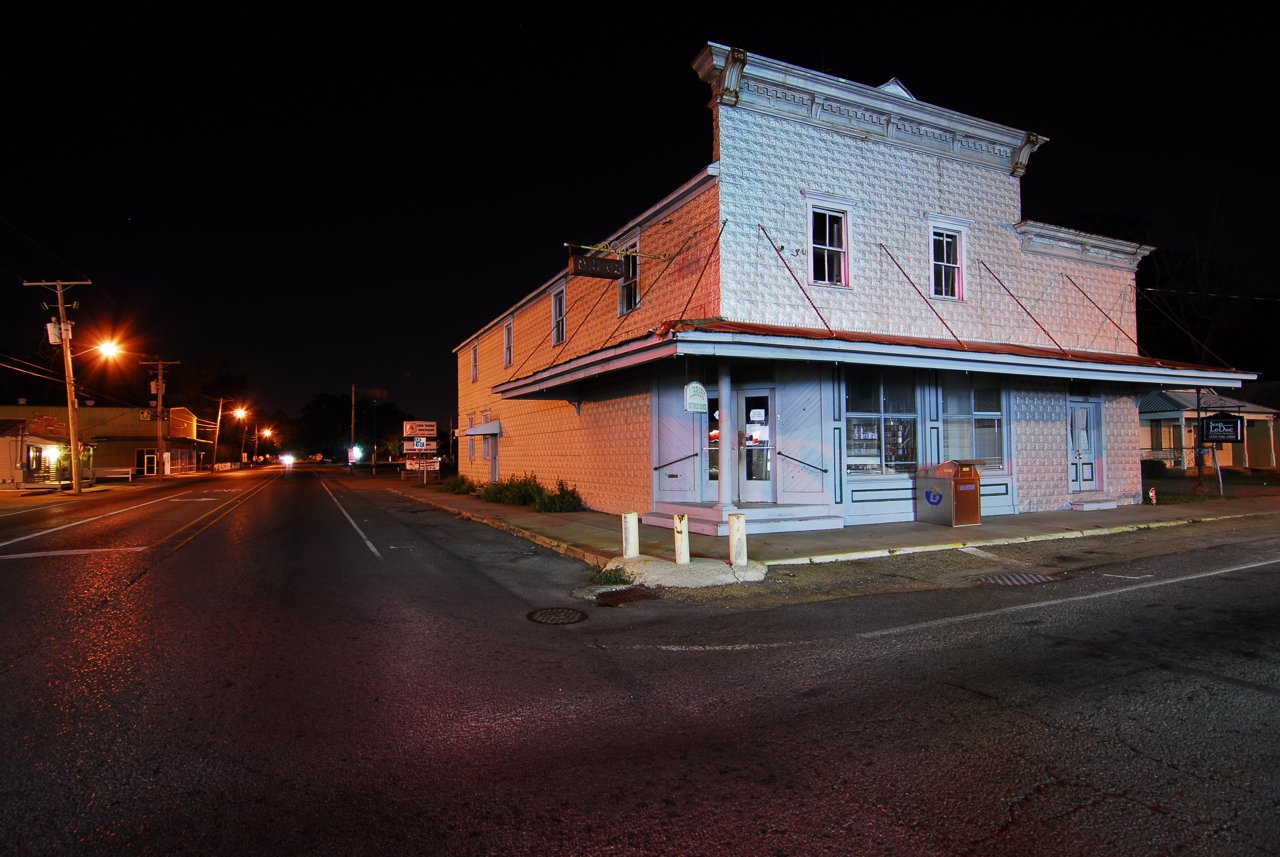
Jena
22.9 per home
Residents gained 757
1
Jena
22.9 per home
Residents gained 757
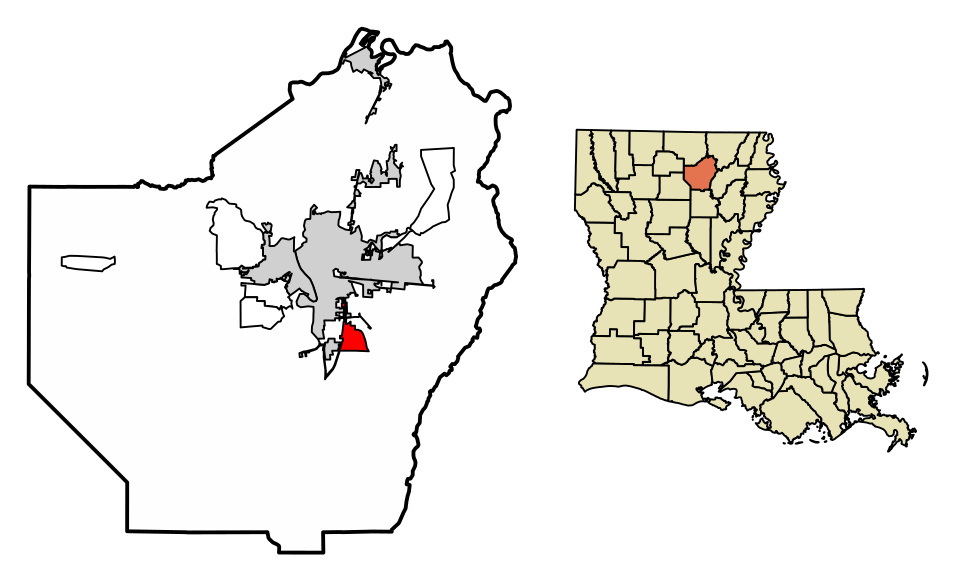 2
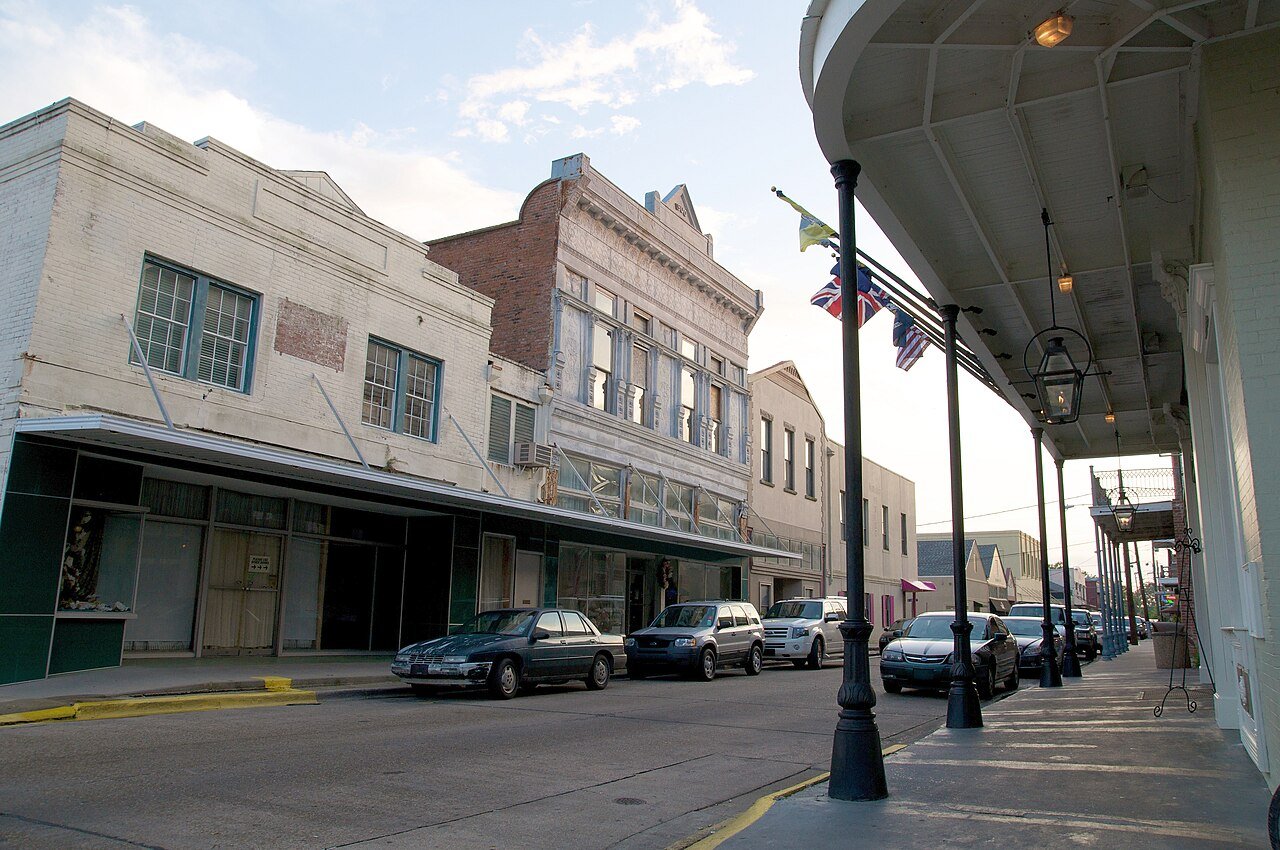
Richwood
6.8 per home
Residents gained 489
2
Richwood
6.8 per home
Residents gained 489
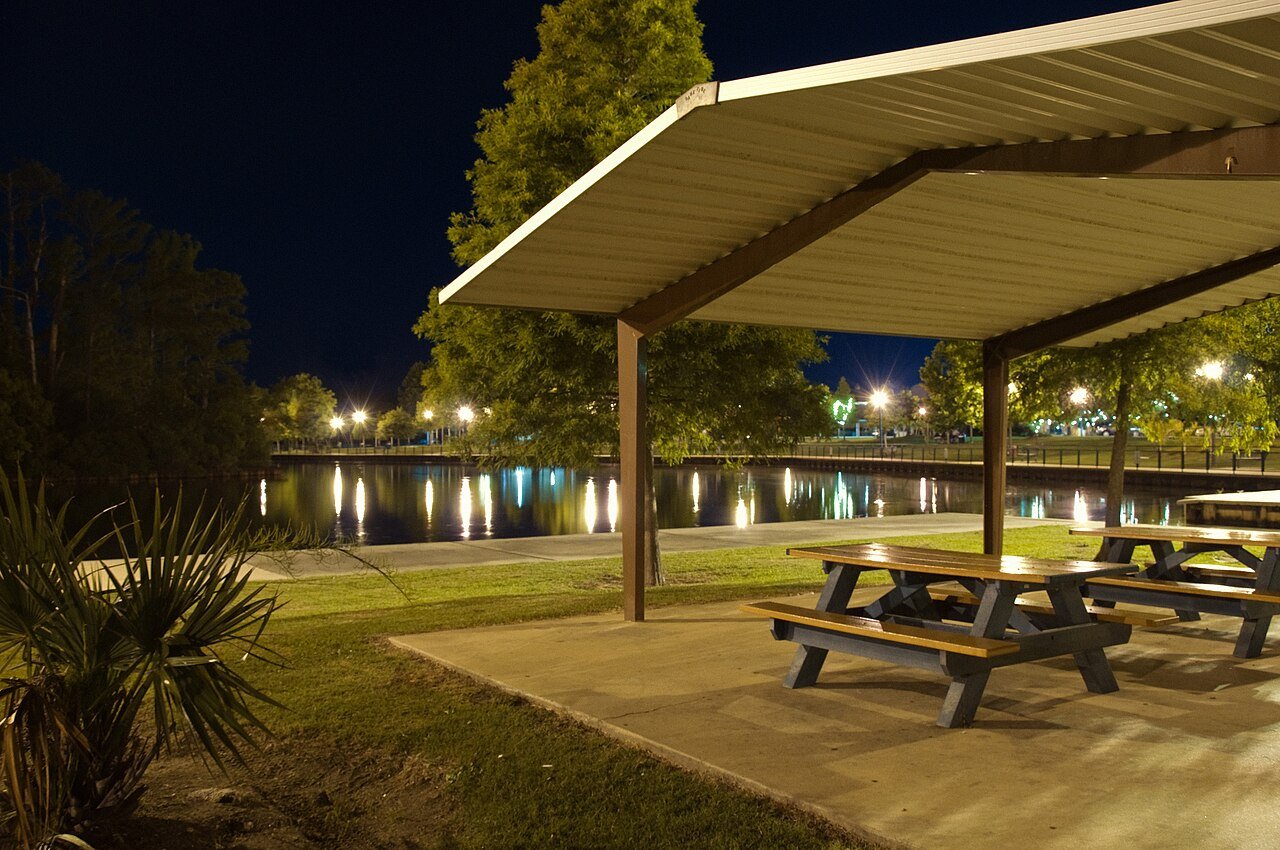 3
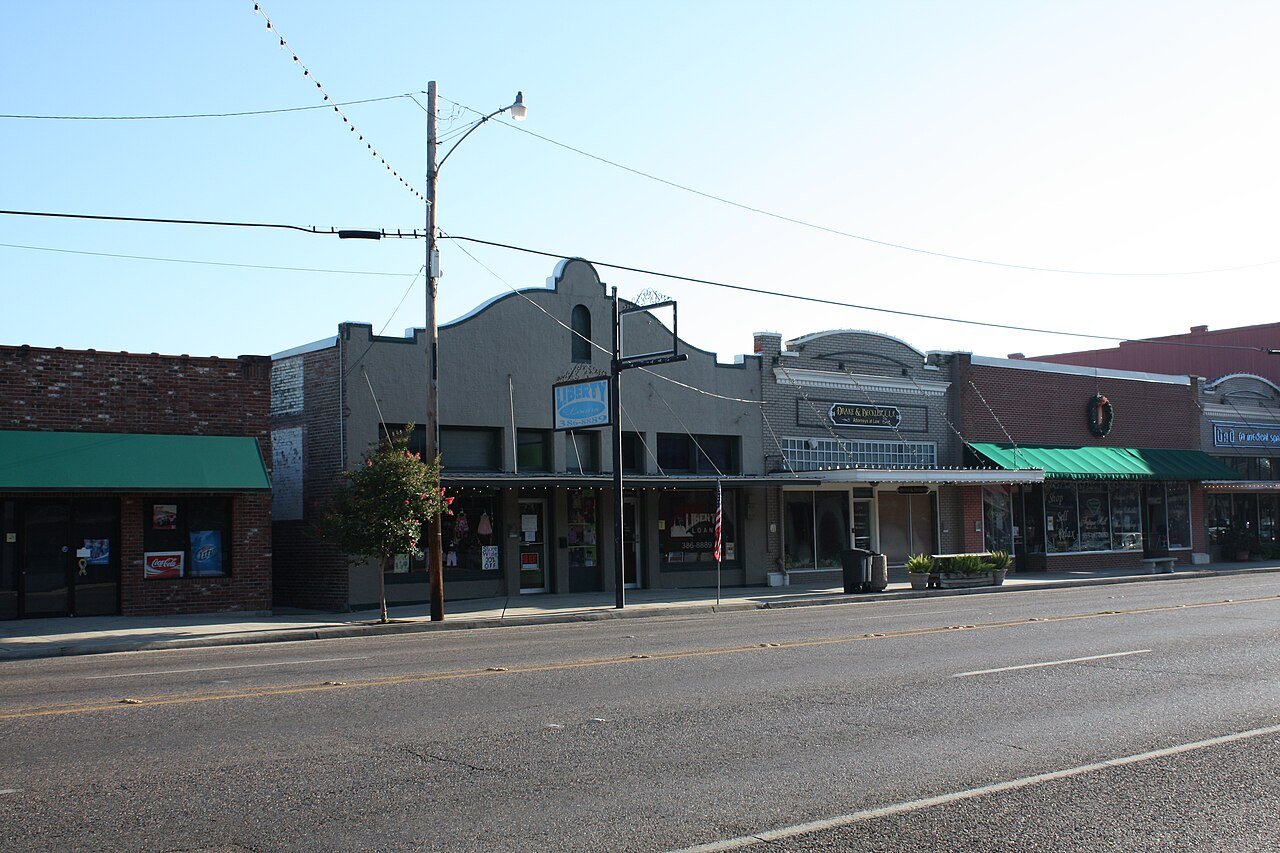
Slidell
6.0 per home
Residents gained 1,713
3
Slidell
6.0 per home
Residents gained 1,713




How this ranking works
We take each town’s population change between the 2010 and 2020 censuses and divide it by the new homes its building permits authorized over 2010–2019. The result is how many new residents arrived for every new home. A high number means people came faster than homes were built, so existing homes filled up: larger households, fewer vacancies and tighter supply. The highest ratio ranks #1. Across Louisiana it’s 0.9 per home.
Only towns that gained at least 250 residents and permitted at least 10 homes are ranked, because a ratio built on a handful of either is noise. College towns, where 20% or more of residents are enrolled in college, are left out: a growing college adds dorm students as residents, but dorms never show up as permitted homes.
Only towns with at least 2,500 residents are ranked; Census estimates for smaller places are too uncertain. Population and income: U.S. Census Bureau American Community Survey 5-year estimates. New homes: U.S. Census Bureau Building Permits Survey. Residents: 2010 and 2020 decennial censuses. Town photos: Wikimedia Commons, credited on each town’s page.