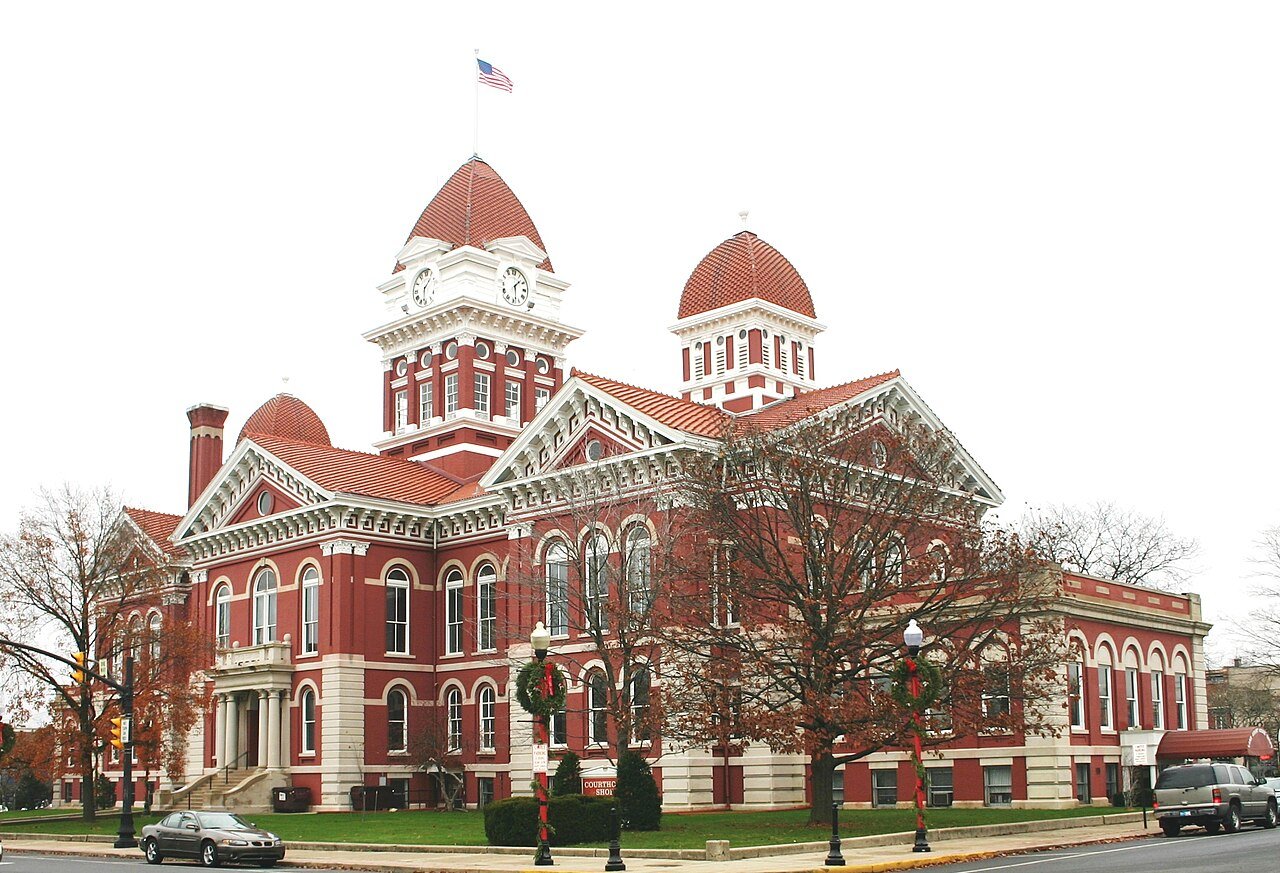
Rankings · How Crown Point ranks in IN
Crown Point ranks #10 in Indiana for low depression
Crown Point is ranked on 32 lists against the 611 Indiana towns with 2,500+ residents. It makes the top 10 on 1 and the top quarter on 12.
Lists ranked on
32
of IN’s 611 ranked towns
Top-10 finishes
1
Best: #10 lowest depression
Top-quarter finishes
12
of 22 lists where higher is better
Strongest area
Schools
Top 3% on average
★ What stands out · Where it shines
The lists Crown Point does best on
Each list ranks every IN town with 2,500+ residents. Tap one to see the whole list with Crown Point marked.
Next door
Crown Point out-ranks every neighbor it can be compared with
Head to head on the lists where both towns are ranked: a point for each list where one town places higher. Tap a town for its own rankings.
MerrillvilleCenter TownshipRoss TownshipCrown Point
Crown Point leadsNeighbor leadsEvenNot ranked
At a glance
Crown Point lands in the top half on 16 of 22 lists
Each dot is Crown Point’s spot on one list: the left end is #1 in IN, the right end is last. Areas where Crown Point does best come first.
Top 10%Top halfBottom half
HealthHealth →
Lowest depression#10/607Lowest obesity#58/607Fewest uninsured#62/607Healthiest#67/607Fewest smokers#67/607Most active#79/607Closest to a top hospital#416/611 SafetySafety →
Safest#11/81 People
Most educated#112/611 HousingHousing →
Most new homes#43/135 Cost of livingHousing →
Rent easiest to afford#87/171Most affordable#521/610Lowest property tax#570/610Cheapest rent#554/587 Getting aroundWork & commute →
Shortest commute#495/611 What kind of place
Steadier prices than 90% of Indiana
Not better or worse, just Crown Point’s character, from the lists where neither end is the “good” one. The most distinctive come first.
Steadier prices than 90% of IN towns
Steadier pricesPrices rising fast
+44.9% in home prices, 5 years
Shorter growing season than 84% of IN towns
Shorter seasonLonger season
171 days between frosts
More snow than 70% of IN towns
Less snowMore snow
27 in of snow a year
Fewer homes per newcomer than 63% of IN towns
Homes keep paceShort on homes
3.1 new residents for each new home, 2010–20
More vacation homes than 60% of IN towns
Year-roundVacation homes
0.4% of homes are seasonal
More seniors than 57% of IN towns
Fewer seniorsMore seniors
18.3% of residents are 65+
More kids than 55% of IN towns
Fewer kidsMore kids
23.8% of residents are under 18