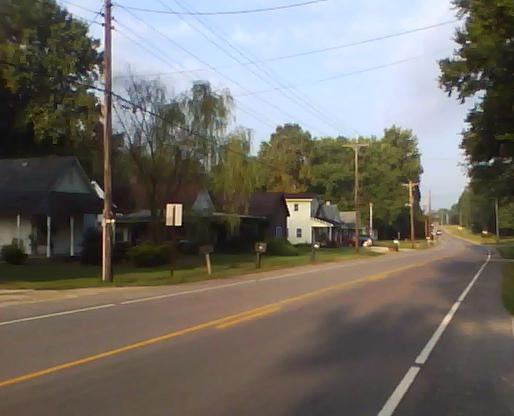
Homes in Cloverland
Zillow and Redfin don’t publish market figures for Cloverland, so this page shows what the Census and federal housing data say about its homes.
Renters pay a median $3,501 a month
HUD doesn’t publish rents for this area.
Median rent and renters: U.S. Census Bureau, American Community Survey.
64% of Cloverland households own their home
Half of Cloverland’s homes were built before 1990.
Indiana: 71% own.
U.S. Census Bureau, American Community Survey 2020-2024 · figures for a place this size carry wide margins of error.
Cloverland vs. its neighbors
The towns that share a border with Cloverland. Tap one to see its housing page.
Compare more
| Town | Typical value | 1-yr change | 2-bed rent | Median income |
|---|---|---|---|---|
| Cloverland | — | — | — | $72,865 |
| Posey | $171K* | +5.2%† | $1,040 | $93,664 |
| Lost Creek | $222K* | +5.6%† | $1,110 | $67,471 |
Typical value: Zillow Home Value Index; * Census median home value where Zillow has none. † FHFA price index change where Zillow has none. Rent: HUD Fair Market Rent. New homes: Census building permits.
Neighbors talk housing
What Cloverland buyers, sellers and renters are saying.
Your answer becomes a post in Town Square.
Home values: Zillow Home Value Index (ZHVI), Zillow Research. Sales, days on market and supply: Redfin Data Center. Income, ownership, taxes and rent: U.S. Census Bureau, American Community Survey. Listings link to their publishers. The calculator is an estimate, not a loan offer.