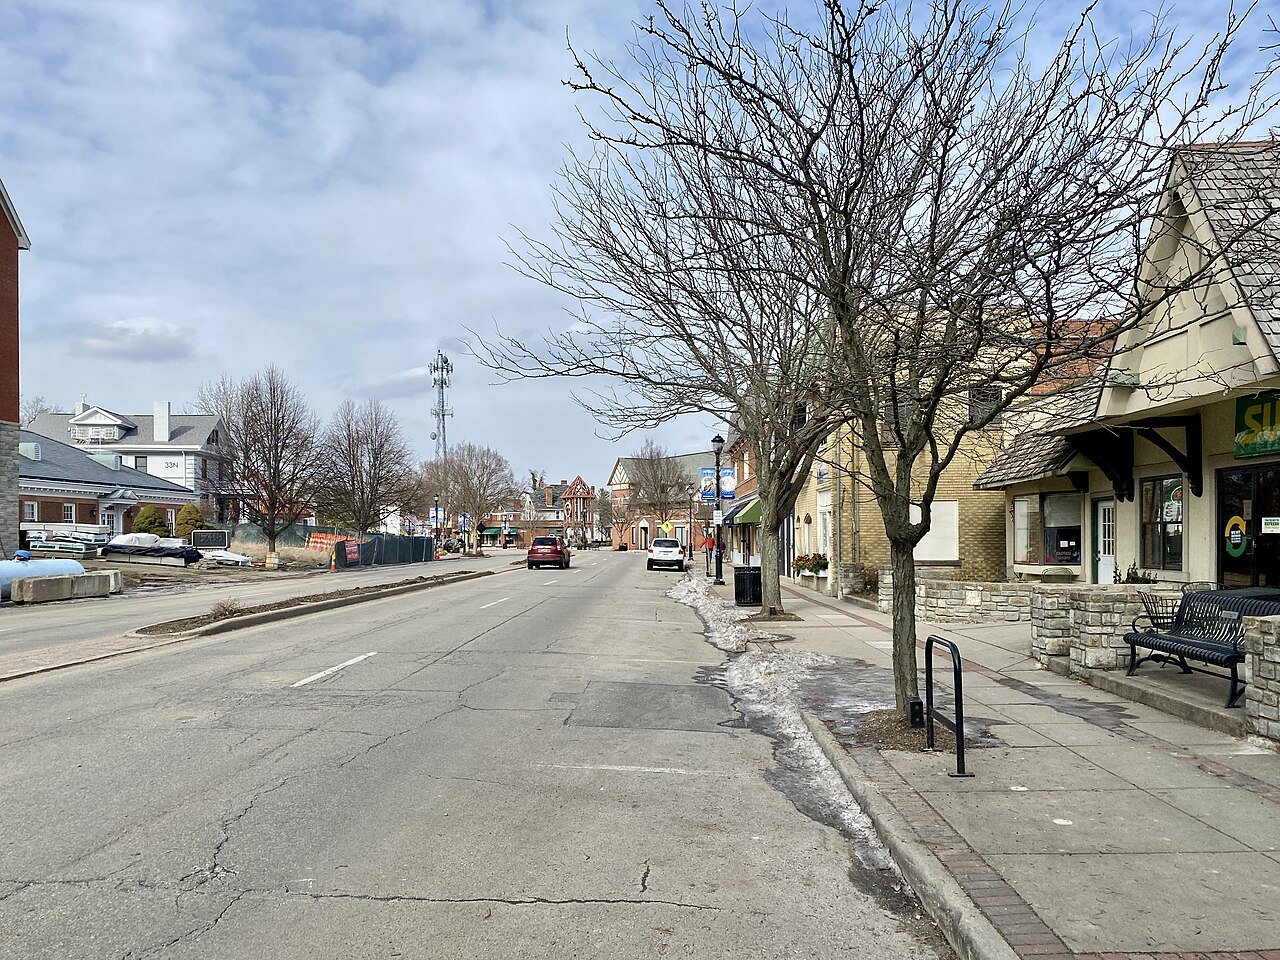
 #1
#1
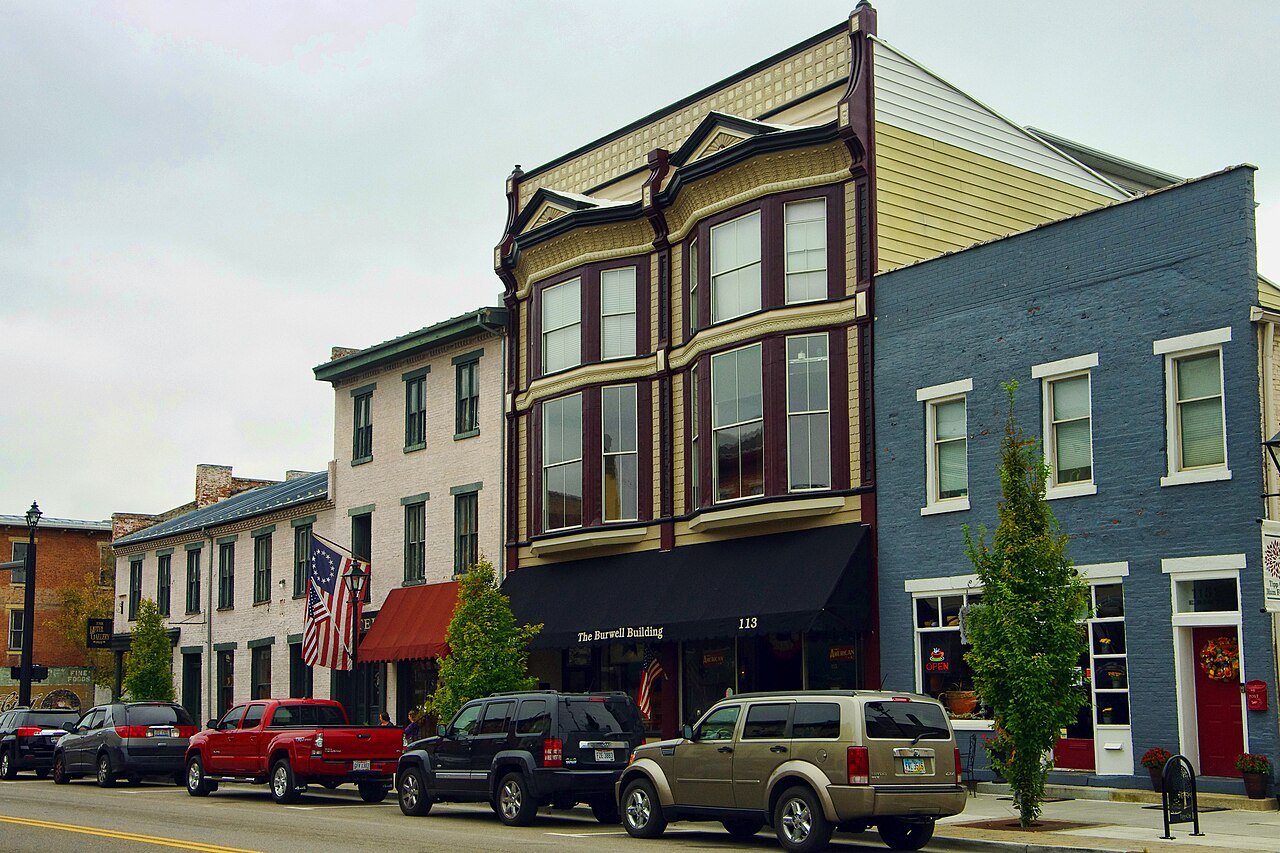
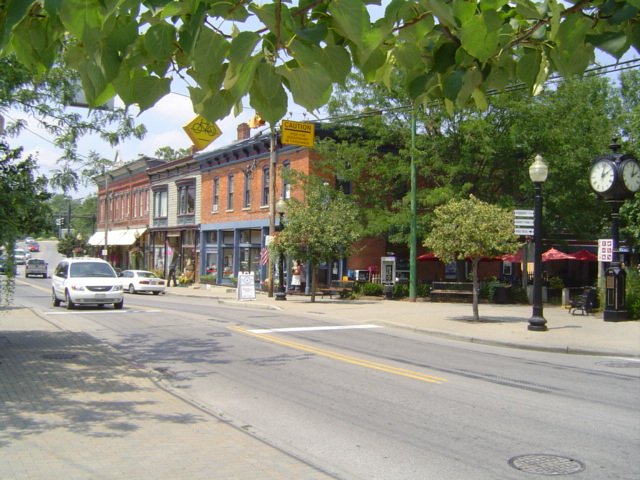
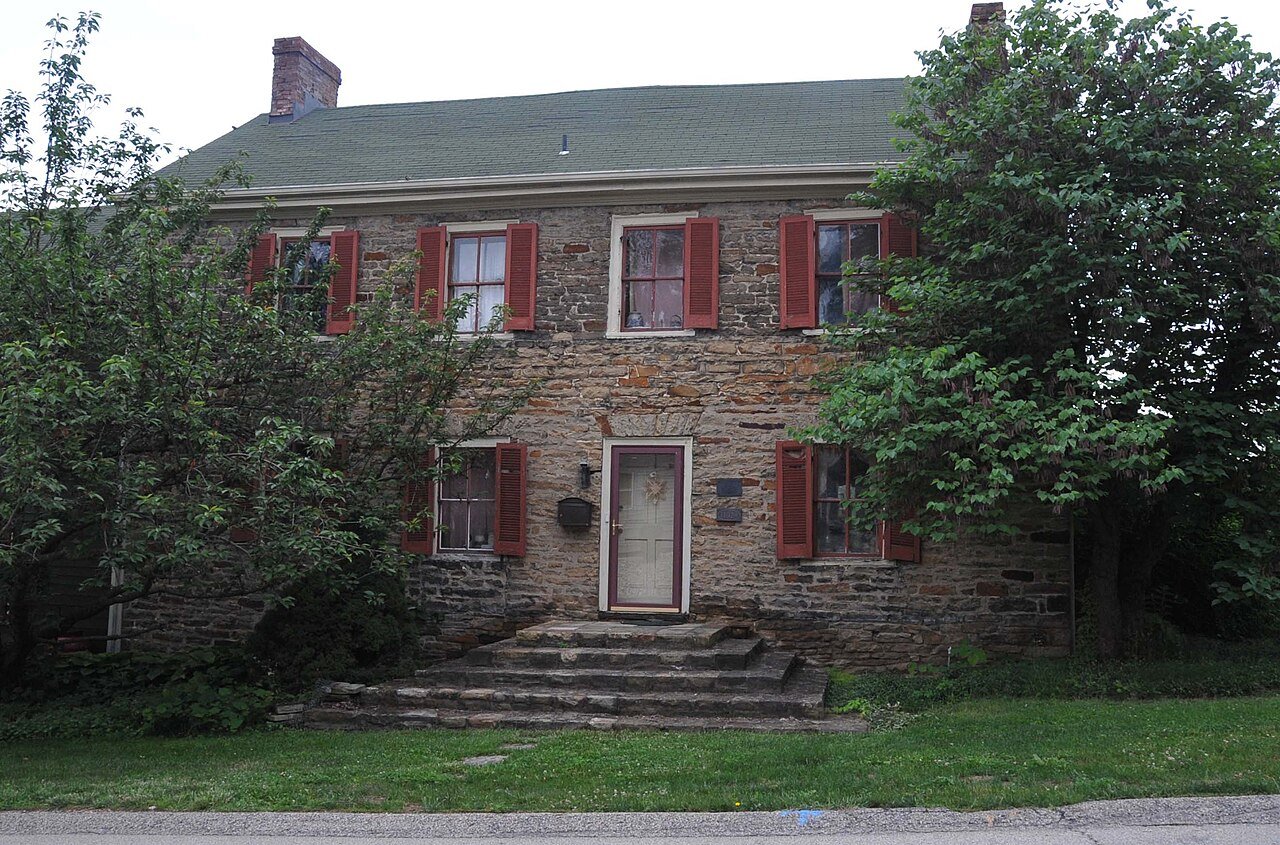
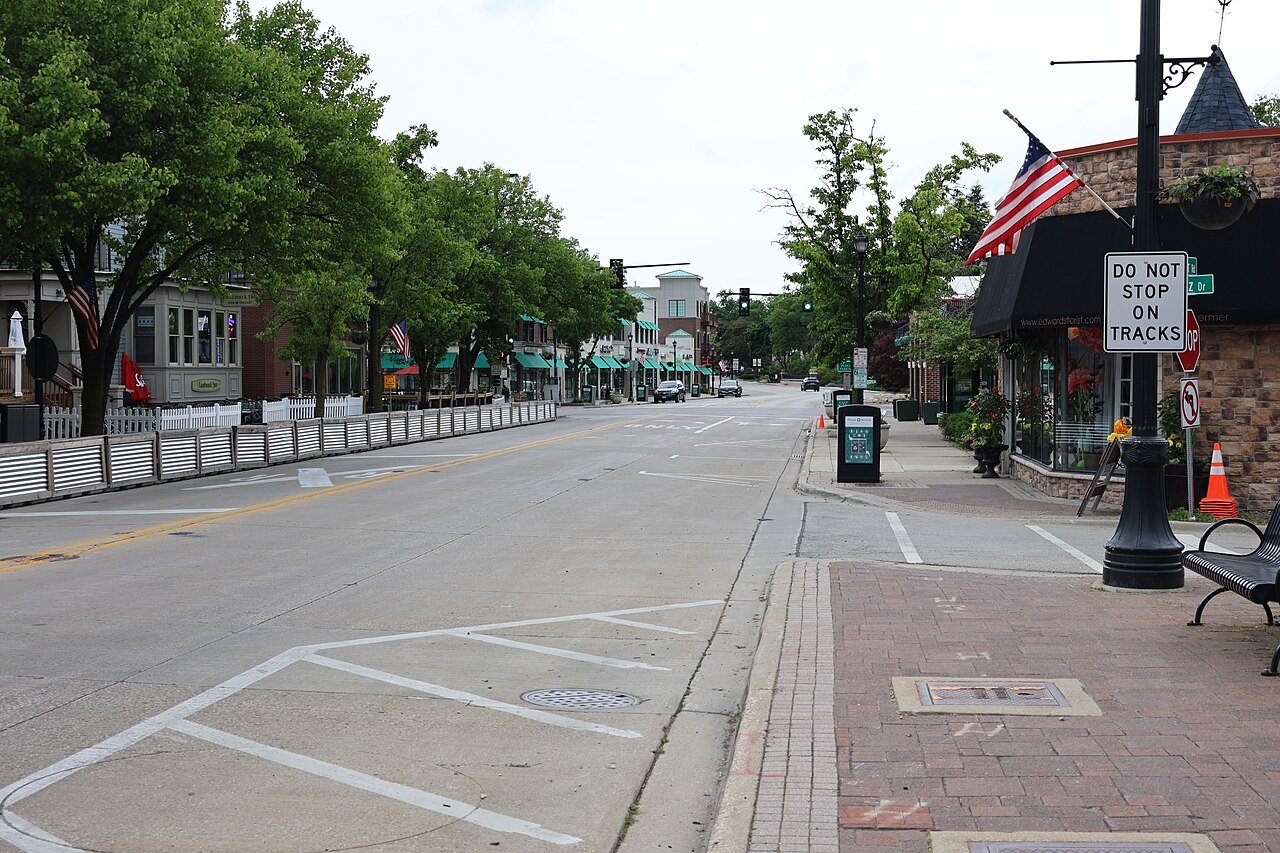
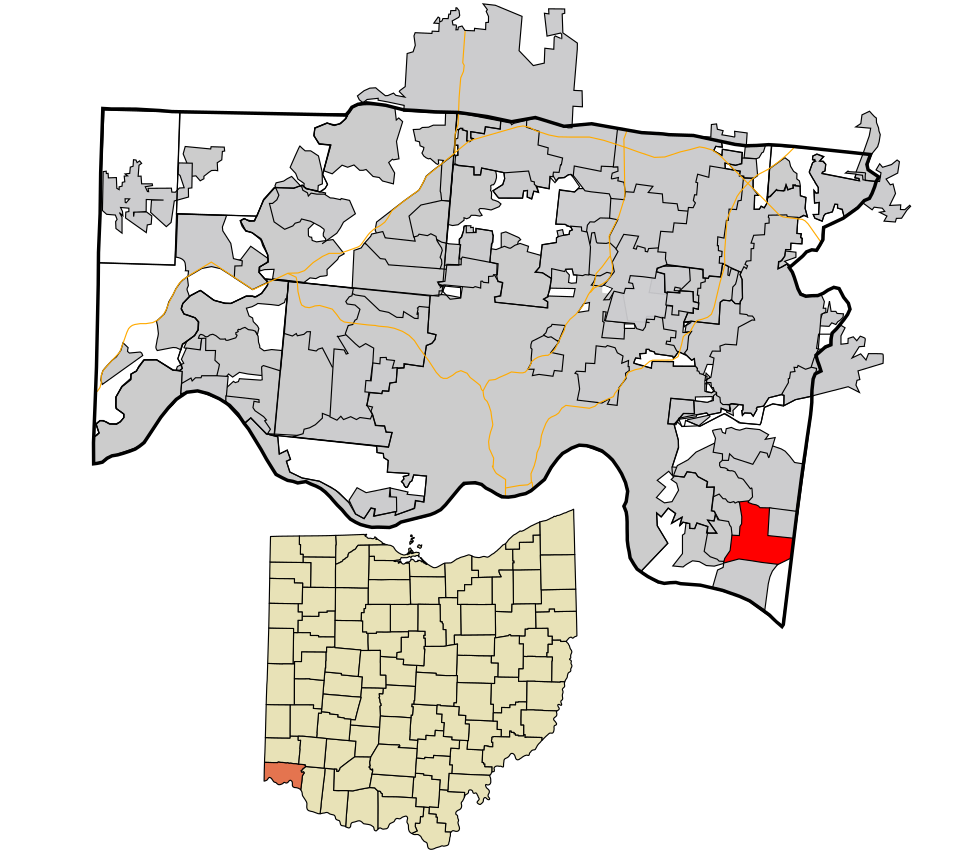
Fort Thomas, KY
· 17,169 peopleWhy it’s here: Health (#109 closest to a top hospital), safety (#226 safest).
We scored 5,138 cities and towns of 10,000+ people on the six things people weigh when they move: affordability, safety, schools, health, jobs and the outdoors, from public data. Then we ask the people who live there whether we got it right.
#1 best places to liveFort Thomas, KY
78score
Weights: Affordability 20% · Safety 20% · Schools 20% · Health 15% · Jobs & commute 15% · Outdoors & community 10%. How the score works
#1
Why it’s here: Health (#109 closest to a top hospital), safety (#226 safest).
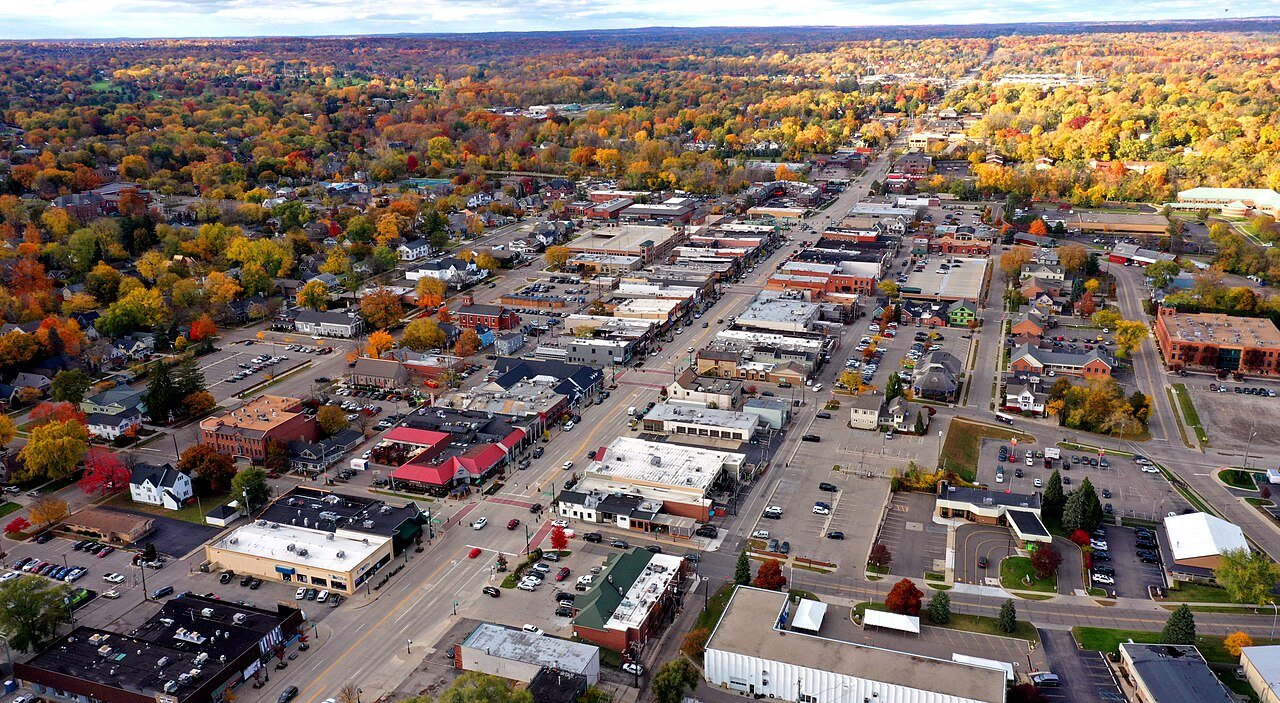 #2
#2
Why it’s here: Schools (#6 highest graduation rate), safety (#76 safest).
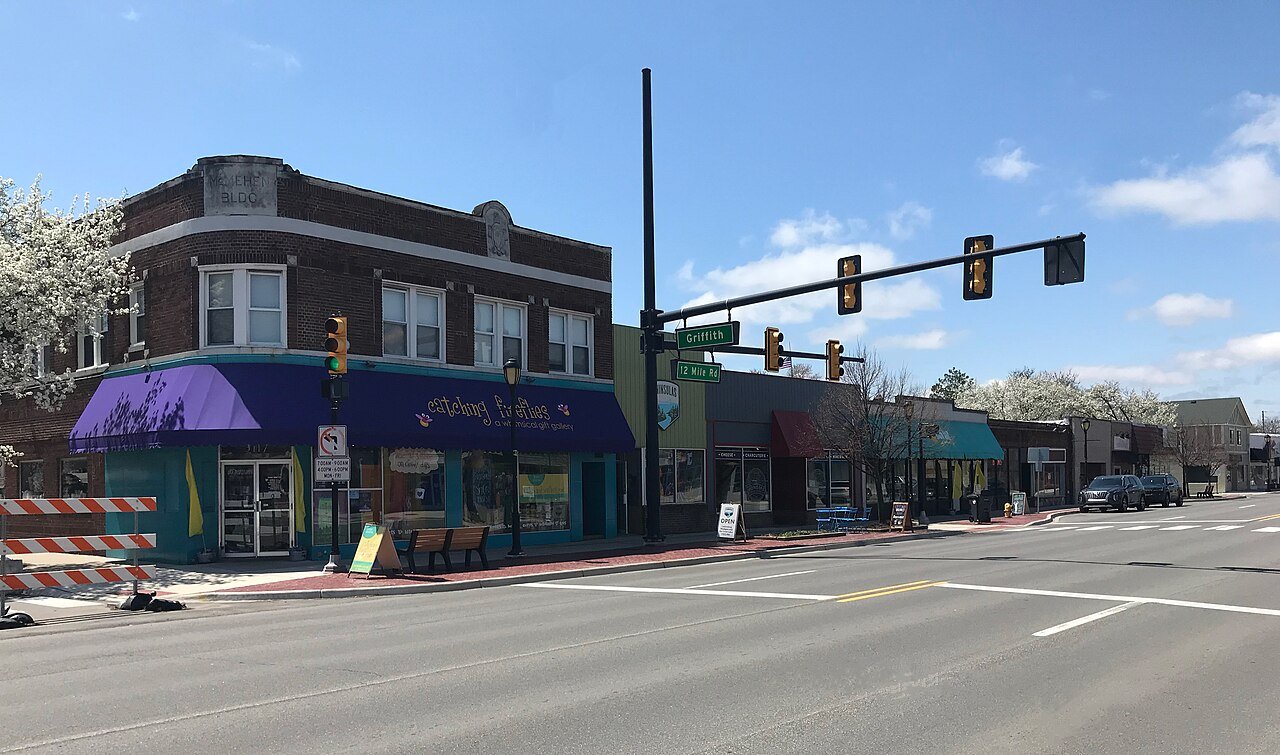 #3
#3
Why it’s here: Safety (#123 safest), schools (#6 highest graduation rate).
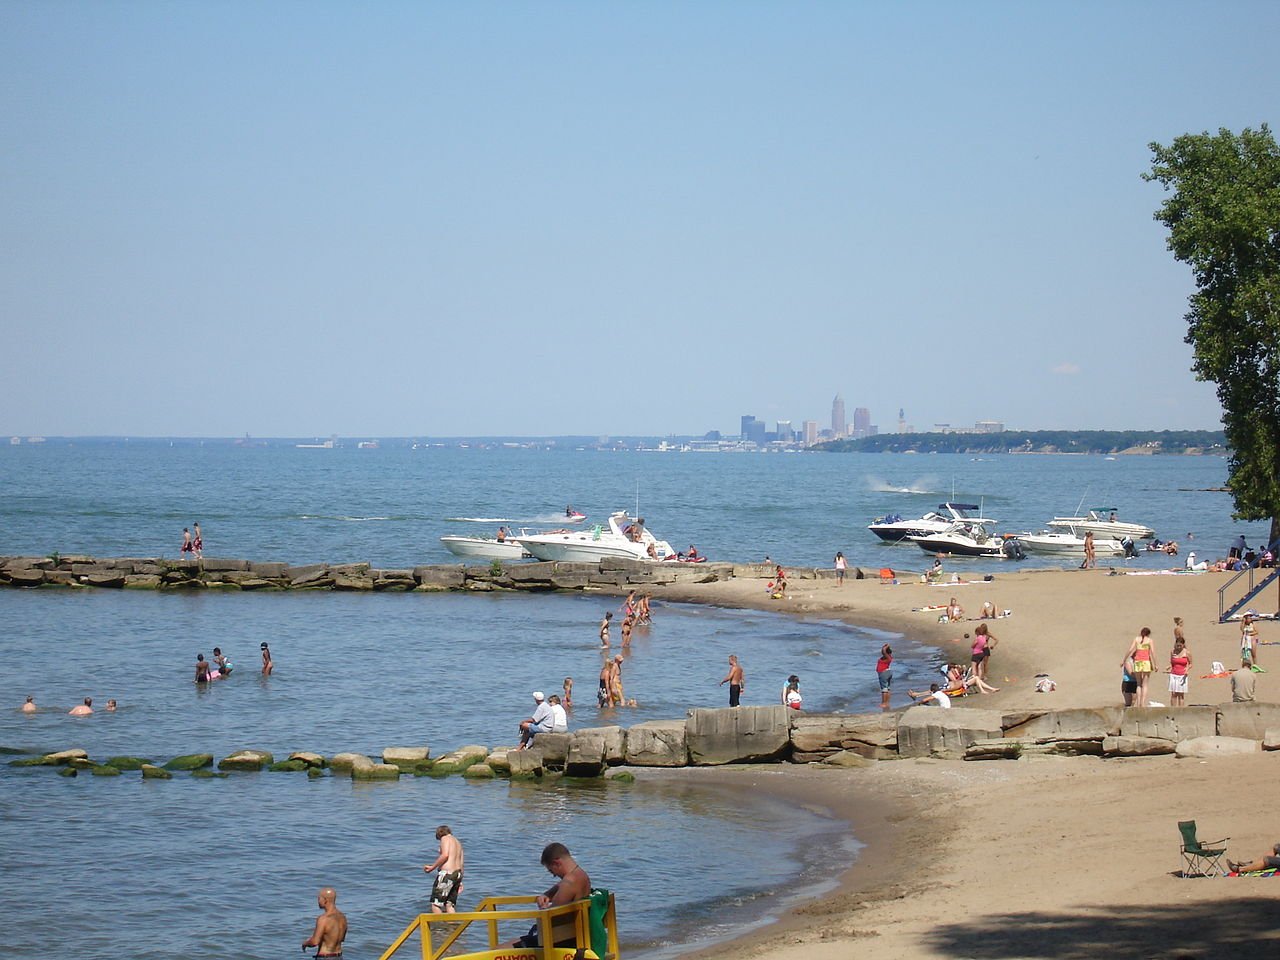
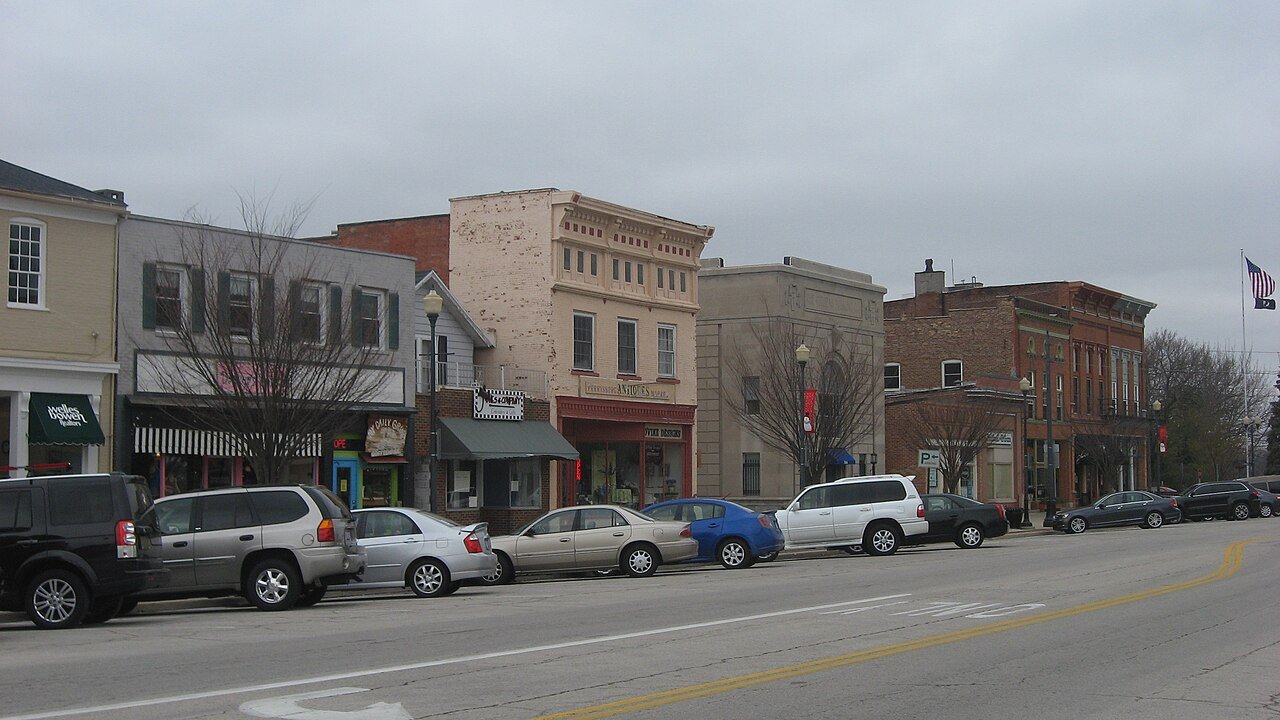


 76A+
76A+
 75A+
75A+
 75A+
75A+

 73A+
73A+

 73A+
73A+
 73A+
73A+

 73A+
73A+
 73A+
73A+
 73A+
73A+
 73A+
73A+
 73A+
73A+
 73A+
73A+
 73A+
73A+

 72A+
72A+
 72A+
72A+
 72A+
72A+

 72A+
72A+
 71A+
71A+
 71A+
71A+
 71A+
71A+
 71A+
71A+
 71A+
71A+
 71A+
71A+
 71A+
71A+
 71A+
71A+

 71A+
71A+
 71A+
71A+
 71A+
71A+
 71A+
71A+
 71A+
71A+
 71A+
71A+
 71A+
71A+
 71A+
71A+
 71A+
71A+
 71A+
71A+
 70A+
70A+
 70A+
70A+

 70A+
70A+
 70A+
70A+
 70A+
70A+

 70A+
70A+
 70A+
70A+
 70A+
70A+
 70A+
70A+
 70A+
70A+

 70A
70A

 70A
70A
 70A
70A
 70A
70A
 70A
70A


 70A
70A


 70A
70A
 69A
69A
 69A
69A
 69A
69A
 69A
69A

 69A
69A
 69A
69A
 69A
69A

 69A
69A
 69A
69A
 69A
69A

 69A
69A
 69A
69A
 69A
69A
 69A
69A
 69A
69A
 69A
69A

 69A
69A
 69A
69A

 69A
69A
 69A
69A
 69A
69A

 69A
69A
 69A
69A
 69A
69A
 69A
69A
 69A
69A

 68A
68A
 68A
68A
 68A
68A
 68A
68A
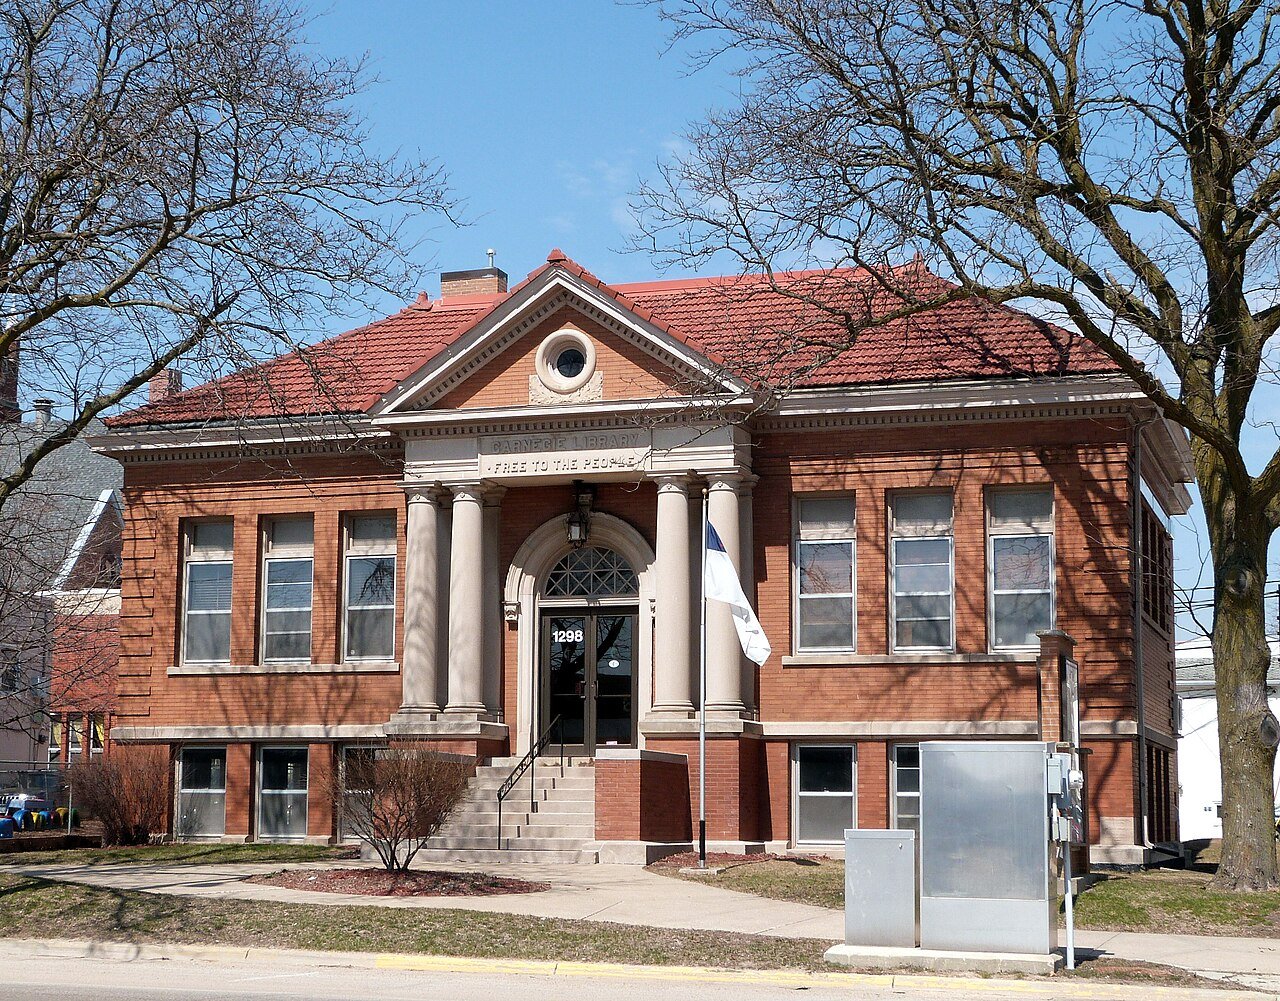


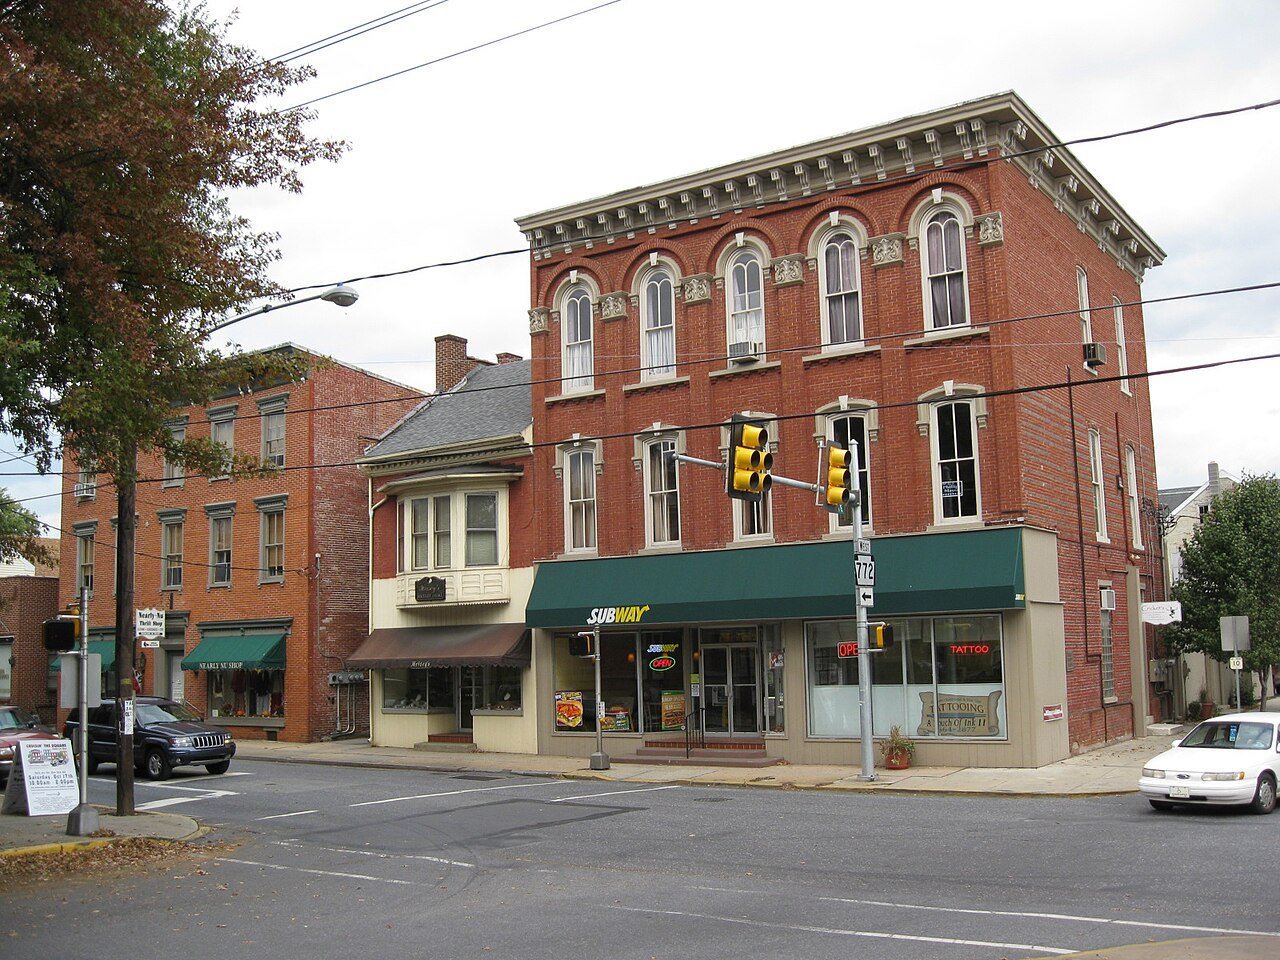
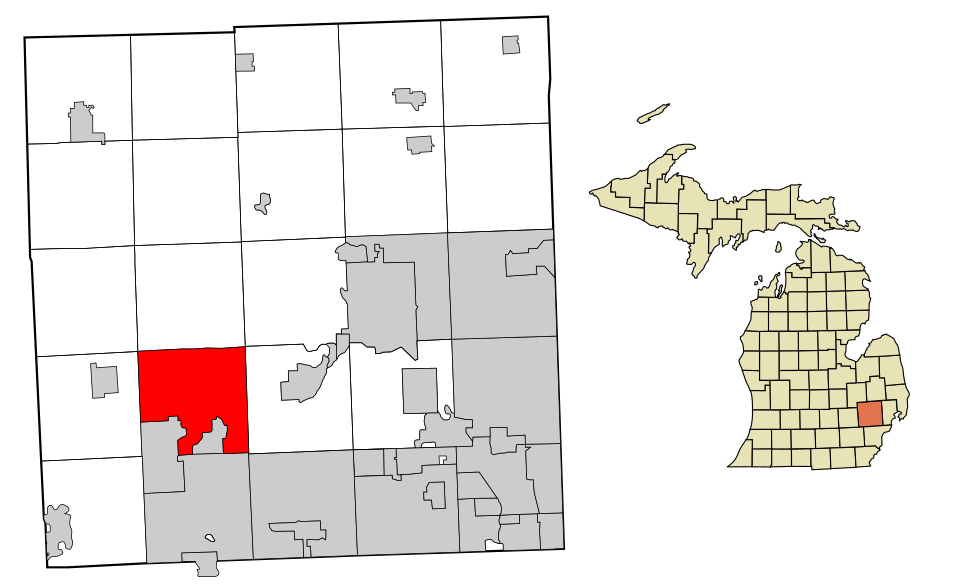
 68A
68A
 68A
68A
 68A
68A
 68A
68A
 68A
68A
 68A
68A
 68A
68A
 68A
68A
 68A
68A

 68A
68A
 68A
68A
 68A
68A

 68A
68A
 68A
68A

 68A
68A

 68A
68A
 68A
68A
 68A
68A
 68A
68A
 68A
68A
 68A
68A
 68A
68A
 68A
68A
 68A
68A
 68A
68A
 68A
68A
 68A
68A

 67A
67A
 67A
67A


 67A
67A
 67A
67A


 67A
67A
 67A
67A
 67A
67A
 67A
67A
 67A
67A
 67A
67A
 67A
67A
 67A
67A
 67A
67A

 67A
67A
 67A
67A

 67A
67A

 67A
67A
 67A
67A
 67A
67A
 67A
67A
 67A
67A
 67A
67A
 67A
67A
 67A
67A
 67A
67A
 67A
67A
 67A
67A
 67A
67A
 67A
67A
 67A
67A
 67A
67A
 67A
67A
 67A
67A
 67A
67A
 67A
67A
 67A
67A
 67A
67A
 67A
67A
 67A
67A
 67A
67A
 67A
67A

 67A
67A
 67A
67A
 67A
67A
 67A
67A
Every city and town with 10,000+ residents and data on at least 5 of the 6 areas.
Every state has its own list, scored against its own towns, with small towns included.
Data can’t tell you what a Tuesday feels like on Main Street. If you live in one of these towns, or left one, tell neighbors what the numbers miss.
Every number is public data, compared only with other U.S. cities and towns. A town gets 0–100 in each area by where it falls on that area’s lists (the best = 100, the last = 0), and the score is the weighted average. So a score of 70 means that, across what matters, the town does better than about 70% of the others. Nobody is best at everything: the top scores land around 70. Schools are compared within each state, since every state gives its own tests.
What a home costs against local income, the property-tax bill, and rent.
State test results and the graduation rate of the town’s public schools.
CDC health estimates, health insurance, and the drive to a top hospital.
Trails, conserved land, walkable streets, and a well-used library.
| List | Affordability | Safety | Schools | Health | Jobs & commute | Outdoors & community |
|---|---|---|---|---|---|---|
| Overall | 20% | 20% | 20% | 15% | 15% | 10% |
| For families | 15% | 25% | 35% | 10% | 5% | 10% |
| To retire | 20% | 25% | – | 35% | – | 20% |
| Affordable | 45% | 20% | 15% | 10% | 5% | 5% |
Towns need data on at least 5 of the 6 areas; a missing area’s weight is shared by the rest. Sources: U.S. Census ACS, state education departments, FBI crime data, CDC PLACES, IMLS libraries, conservation and trail data.
Fort Thomas, KY scores highest overall (78), followed by Rochester, MI and Berkley, MI.
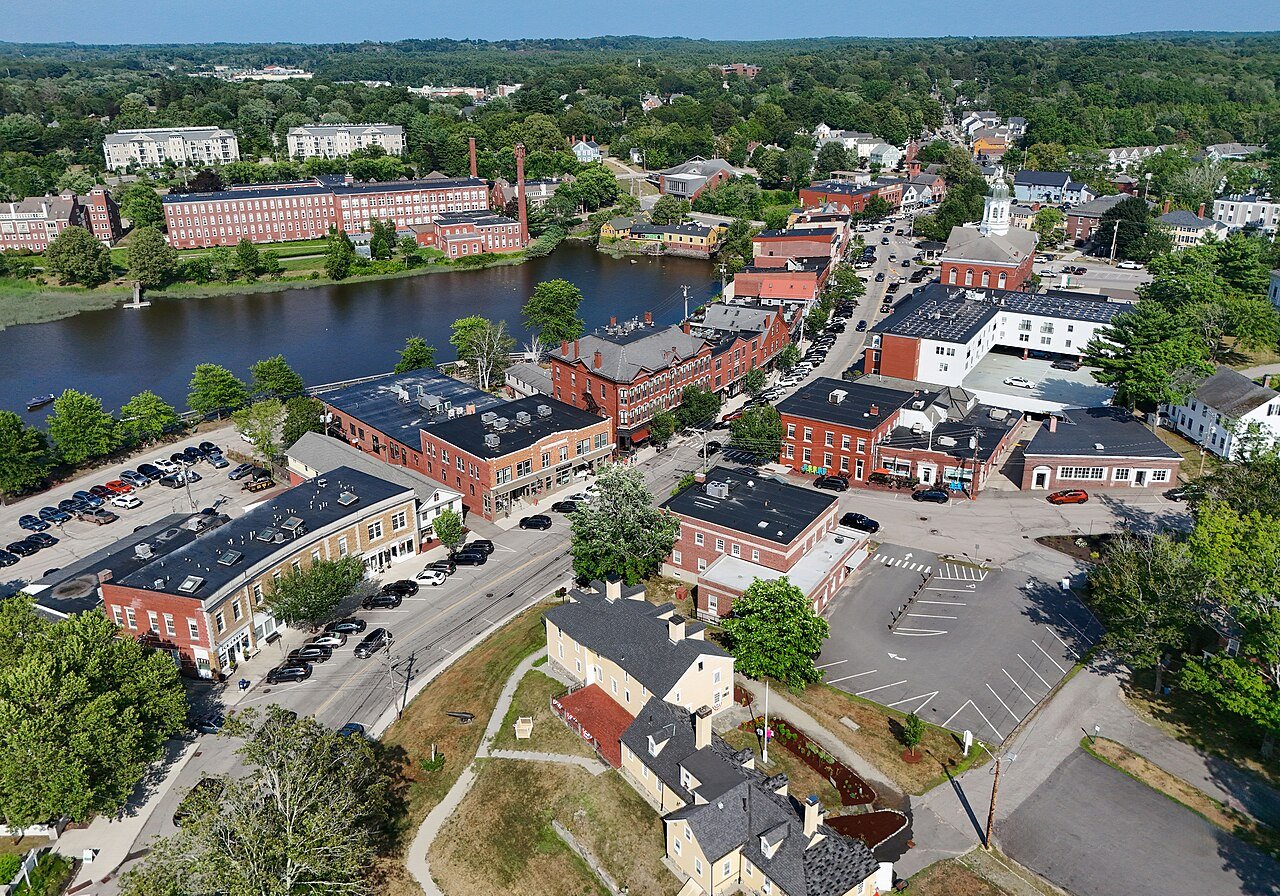
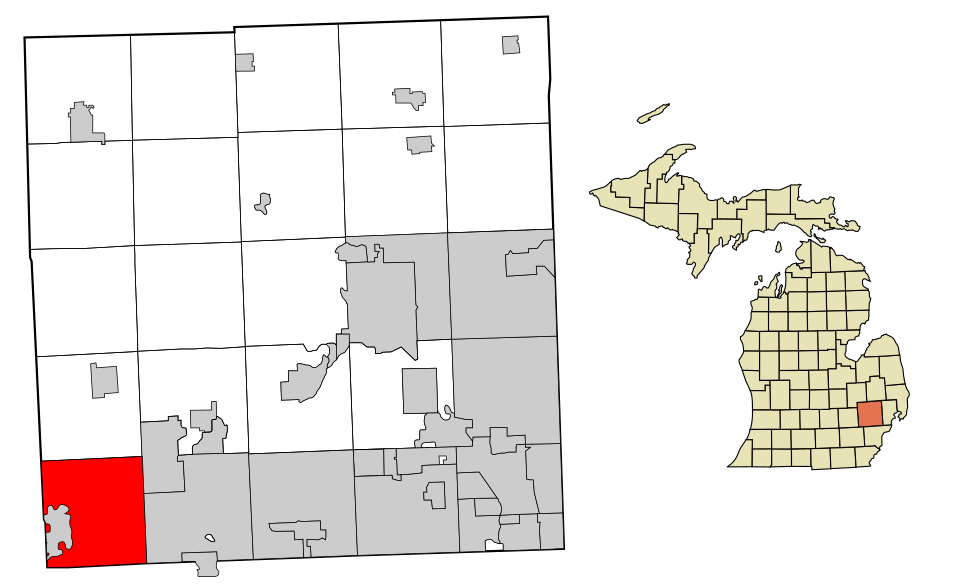
Rochester, MI, when schools and safety count for most of the score.
Peru, IN leads when affordability counts for nearly half the score, without giving up safety and schools.
Pittsburgh, PA scores best when health, safety and affordability lead.