← How Cornfields ranks
Arizona rankings · Health Most active towns in Arizona Ranked by the share of adults who get no exercise outside of work, as estimated by the CDC. 140 towns with 2,500+ residents.
Cornfields Not on this list Cornfields has fewer than 2,500 residents, the floor for AZ lists.
All 140 towns Get no exercise, lowest first.
# Town Get no exercise Likely range Population
T4
Gilbert 280,262 people 15% 14–17% 280,262
T4
Anthem 22,584 people 15% 13–17% 22,584
T4
Page 7,345 people 15% 13–18% 7,345
T12
Carefree 3,683 people 16% 13–19% 3,683
T12
Vail 16,315 people 16% 14–19% 16,315
T18
Tempe 188,065 people 17% 15–19% 188,065
T18
Marana 56,938 people 17% 15–19% 56,938
T18
Chandler 280,136 people 17% 16–19% 280,136
T28
Sedona 9,777 people 19% 17–21% 9,777
T28
Williams 3,369 people 19% 16–22% 3,369
T28
Peoria 196,906 people 19% 17–21% 196,906
T28
Goodyear 107,645 people 19% 17–21% 107,645
T33
Surprise 154,948 people 20% 18–22% 154,948
T33
Taylor 4,183 people 20% 17–23% 4,183
T33
Prescott 47,400 people 20% 18–23% 47,400
T33
Bagdad 2,814 people 20% 17–23% 2,814
T42
Thatcher 5,439 people 21% 17–25% 5,439
T42
Mesa 511,764 people 21% 19–23% 511,764
T42
Catalina 6,489 people 21% 18–24% 6,489
T42
Show Low 12,102 people 21% 18–24% 12,102
T42
Eagar 4,416 people 21% 18–24% 4,416
T42
Linden 2,502 people 21% 18–25% 2,502
T50
Buckeye 104,923 people 22% 20–24% 104,923
T50
Clifton 3,822 people 22% 18–27% 3,822
T50
Red Rock 3,277 people 22% 19–26% 3,277
T50
Pima 2,995 people 22% 18–27% 2,995
T59
Phoenix 1,642,323 people 23% 21–25% 1,642,323
T59
Maricopa 67,163 people 23% 20–26% 67,163
T59
Paulden 4,795 people 23% 20–27% 4,795
T68
Avondale 92,477 people 24% 22–27% 92,477
T68
Ajo 3,107 people 24% 21–28% 3,107
T68
Payson 16,622 people 24% 22–28% 16,622
T80
Glendale 252,833 people 25% 22–27% 252,833
T80
Florence 25,570 people 25% 22–28% 25,570
T80
Tucson 547,073 people 25% 23–28% 547,073
T85
Safford 10,239 people 26% 22–30% 10,239
T85
Parker 3,388 people 26% 21–30% 3,388
T85
Holbrook 4,858 people 26% 23–29% 4,858
T85
Winslow 8,773 people 26% 23–30% 8,773
T85
Globe 7,195 people 26% 23–30% 7,195
T94
Yuma 100,139 people 27% 23–30% 100,139
T94
Sun City 37,486 people 27% 24–29% 37,486
T94
Kingman 34,375 people 27% 23–30% 34,375
T94
Kayenta 4,927 people 27% 22–31% 4,927
T105
Oracle 3,146 people 28% 24–32% 3,146
T105
Wellton 2,527 people 28% 24–33% 2,527
T105
Benson 5,417 people 28% 25–33% 5,417
T112
Bisbee 4,977 people 29% 25–33% 4,977
T116
Rio Rico 22,017 people 30% 26–34% 22,017
T120
Chinle 4,147 people 31% 27–35% 4,147
T120
Coolidge 16,636 people 31% 27–34% 16,636
T122
Willcox 3,222 people 32% 28–37% 3,222
T122
San Luis 37,337 people 32% 28–36% 37,337
T122
Somerton 14,574 people 32% 28–37% 14,574
T125
Superior 2,535 people 33% 29–37% 2,535
129
Eloy 17,433 people 34% 30–38% 17,433
T130
Summit 4,896 people 35% 31–39% 4,896
134
Tolleson 7,668 people 37% 33–41% 7,668
T135
Nogales 19,841 people 38% 33–43% 19,841
T135
Sacaton 3,429 people 38% 33–43% 3,429
138
Douglas 15,981 people 39% 35–44% 15,981
We rank every town by the share of adults who get no exercise outside of work, as estimated by the CDC. The lowest share ranks as the most active. The lowest share ranks #1. Across Arizona it’s 22% .
These are the CDC’s modeled estimates , not a count: national survey answers combined with each area’s age, sex, race and income mix. Each carries a likely range (shown in the table), so we rank on the whole percent and towns at the same figure share a rank (T = tied). Differences of a point or two are within the estimates’ margins.
Cities and villages use the CDC’s own estimate for that place. New England towns and townships, which the CDC doesn’t publish, use the ZIP codes that cover them, weighted by land area.
Only towns with at least 2,500 residents are ranked; Census estimates for smaller places are too uncertain. Population and income: U.S. Census Bureau American Community Survey 5-year estimates. Health estimates: CDC PLACES . Town photos: Wikimedia Commons, credited on each town’s page.
More on health in Cornfields →
Tell Cornfields what the numbers miss Your answer becomes a post in Cornfields’s Town Square.
Weigh in
Should Cornfields be on this list?
Agree Disagree
Ask neighbors
What would you tell someone looking at Cornfields? → Who really deserves #1? → Copyright © 2026 TownTapestry · The town guide for every town in America · In loving memory of John Cullinane whose interest in maps and discovering new places was contagious. Share TownTapestry to support usBrowse by state · Privacy · Terms 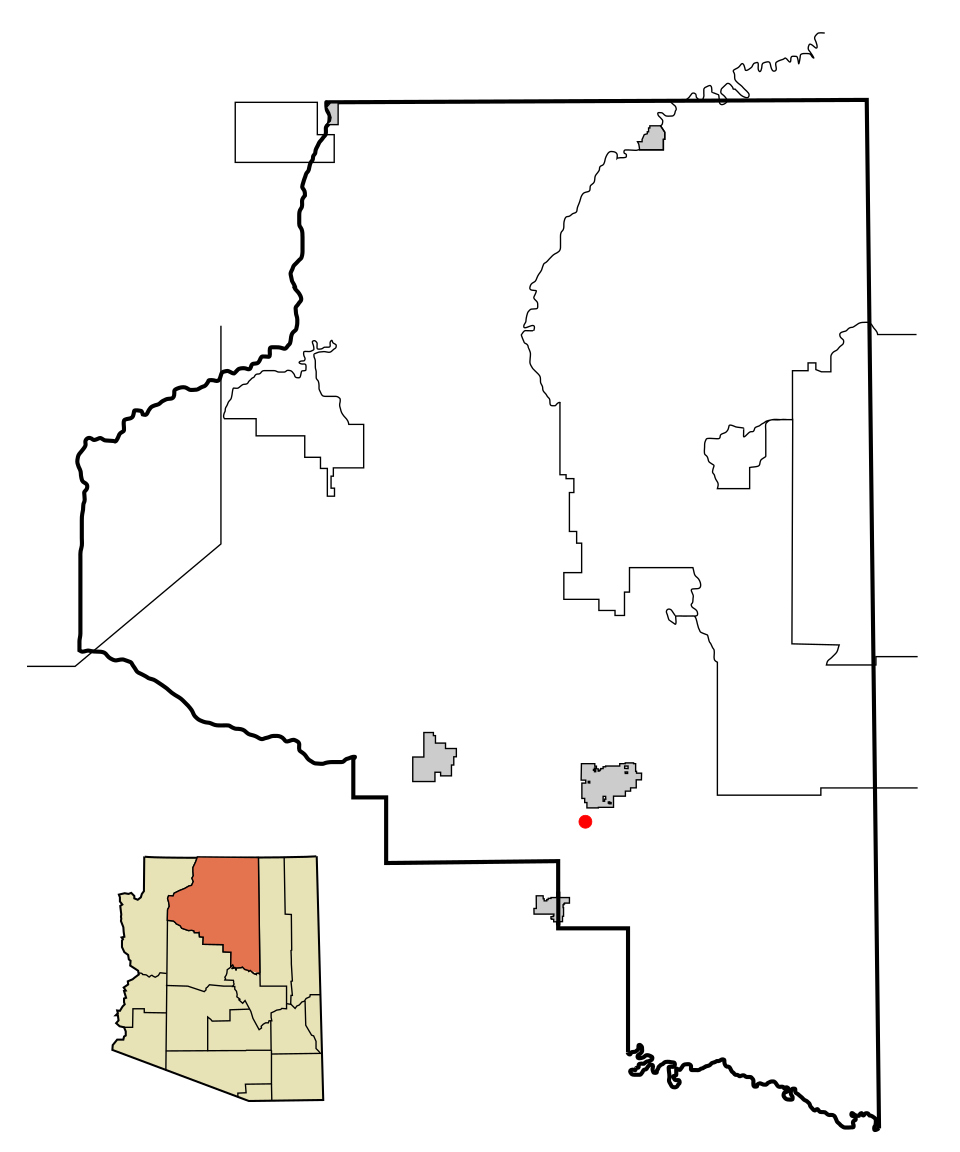 #1
#1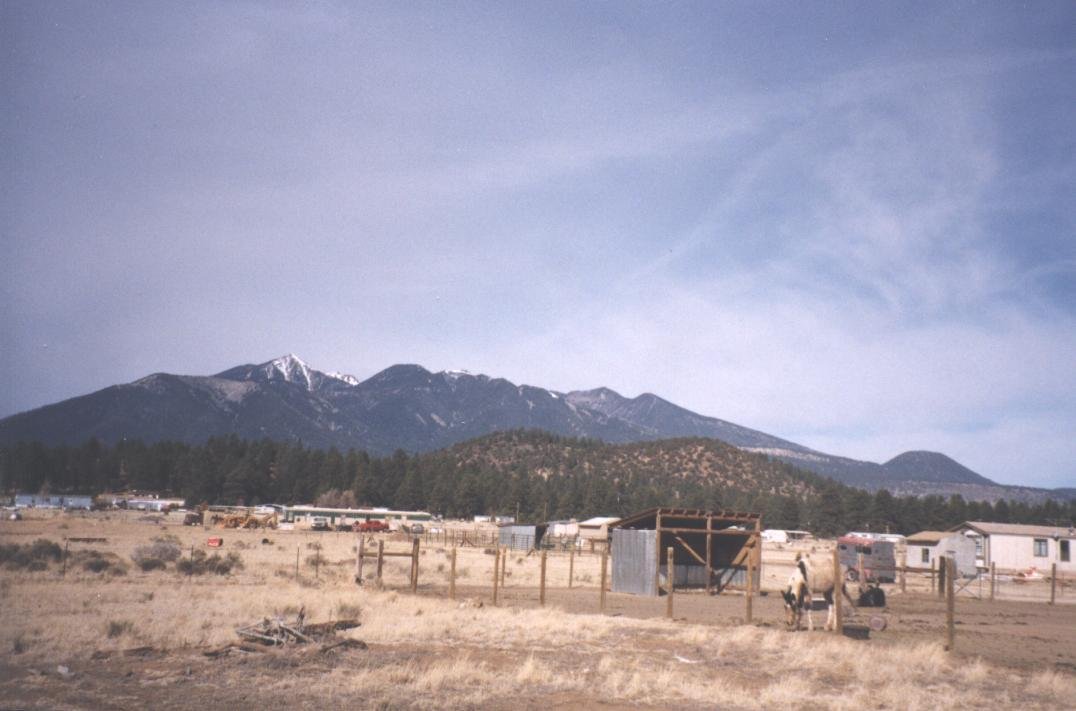 #2
#2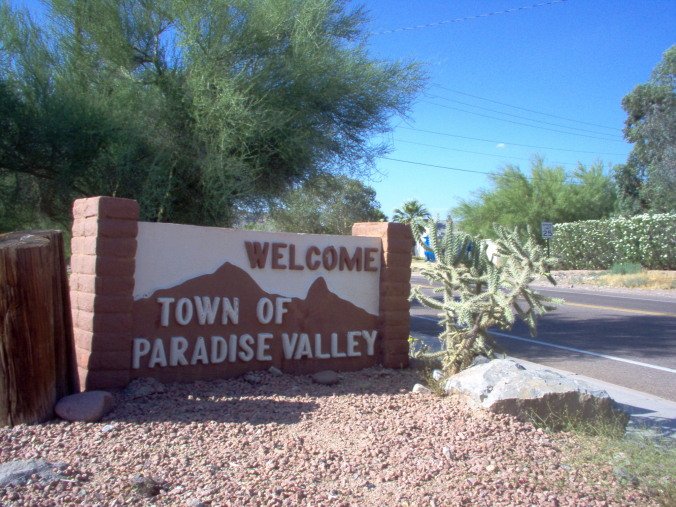 #3
#3