Edinburg’s biggest natural hazard is inland flooding
Most of the natural-hazard damage FEMA expects in Edinburg comes from inland flooding, and overall the risk is high for a U.S. community. Flood insurance has paid 5 claims here since 1996. 1 federal disaster brought FEMA money into town.
What stands out about Edinburg’s weather risks
Read from FEMA’s records below. The page puts what stands out first.
Does Edinburg flood? Rarely: 5 flood claims since 1996
Every paid claim on a federal flood insurance policy in Edinburg, from FEMA’s records.
- Hurricane Fran3 claims · $236K
- Hurricane Isabel1 claim · $1K
Edinburg isn’t in FEMA’s Community Rating System, which cuts flood insurance up to 45% in towns that do extra flood-proofing.
Insurance rates: Shenandoah County.How exposed is Edinburg?
FEMA expects yearly storm and flood damage to homes and buildings here to be higher than in 78% of U.S. communities, mostly from inland flooding.
Rated higher than 645 of the 700 Virginia towns we cover.
Edinburg is smaller than a census tract, so it shares the figures of the tract around its center.
What Edinburg faces
Each hazard’s share of the damage FEMA expects here, and how it compares with the rest of the country.
Inland flooding
Hurricanes
1 federal disaster brought FEMA money to Edinburg
Disasters that paid out in Edinburg itself (aid to households or repair grants to the Town of Edinburg) and its biggest flood years.
- 2003Hurricane Isabel2 households applied for aid$6K aid approved
Shenandoah County has had 21 natural disasters declared since 1953, most often winter storms and hurricanes.
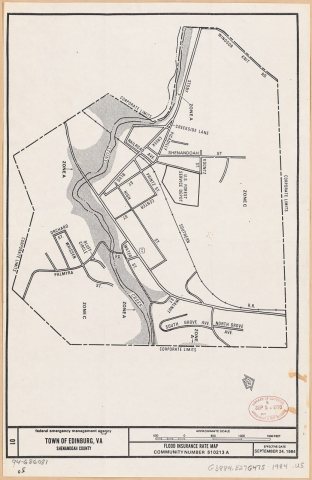 1984 · Town of Edinburg, VA, Shenandoah County, flood insurance rate map
Get ready for what Edinburg actually faces
A short kit for its top hazards, what to check before you buy, and where neighbors get alerts.
- Turn around at flooded roads: a foot of moving water can carry off a car.
- Flood insurance usually takes 30 days to start, so buy it before the forecast.
- Keep papers and medicines up high, in a grab-and-go bag.
- The season runs June through November and peaks from mid-August to mid-October.
- Bring in porch furniture and anything the wind can throw.
- Fill the gas tank and charge phones before the storm arrives.
- Keep a shovel, a blanket and snacks in the car.
- Clear snow from furnace and dryer vents.
- Check on older neighbors when the power goes out.
- Look up the address on FEMA’s flood map.
- Ask the seller or landlord whether it has ever flooded, and what flood insurance costs there.
- Get a flood insurance quote early: policies usually start 30 days after you buy.
Know where neighbors sign up for alerts? Add it to the Handbook so everyone has it.
Disasters here can come any time of year
The month each of Shenandoah County’s 21 declared disasters began, since 1953.
What these numbers can and can’t tell you
- An average, not a forecast. FEMA’s National Risk Index estimates the damage 18 kinds of natural hazards cause in a typical year, from decades of records and models. A quiet decade can follow a bad year.
- Compared by rate. “Higher than N%” compares yearly damage as a share of what’s there, so a big city isn’t rated riskier just for having more buildings.
- Money that reached town. Flood claims are matched to Edinburg’s own flood-insurance community; household aid to the registrant’s city; repair grants to the Town of Edinburg.
- It follows property value. FEMA’s model weighs damage to buildings, so a place that recently lost many homes can rate lower than it feels.
Storm stories
Memories, warnings and help from neighbors in Edinburg.
Your answer becomes a post in Town Square.
Sources: FEMA National Risk Index (December 2025); OpenFEMA: NFIP redacted claims, multiple-loss properties, community status book and residential penetration rates, housing assistance (owners and renters), public assistance funded projects, hazard mitigation properties and disaster declarations. Census tracts: U.S. Census Bureau. Preparedness tips: Ready.gov. An average of past damage, not a forecast.