Guest, Sign inJoin

← How Moab ranks

Moab’s spot
T#43of 119
27%of adults have been diagnosed with depression
The race around Moab

Just behind Holladay, just ahead of Maeser

All 119 towns

Adults with depression, lowest first.

#TownAdults with depressionLikely rangePopulation
T1 Midway6,171 people 22% 19–25%6,171
T1 Park City8,362 people 22% 19–26%8,362
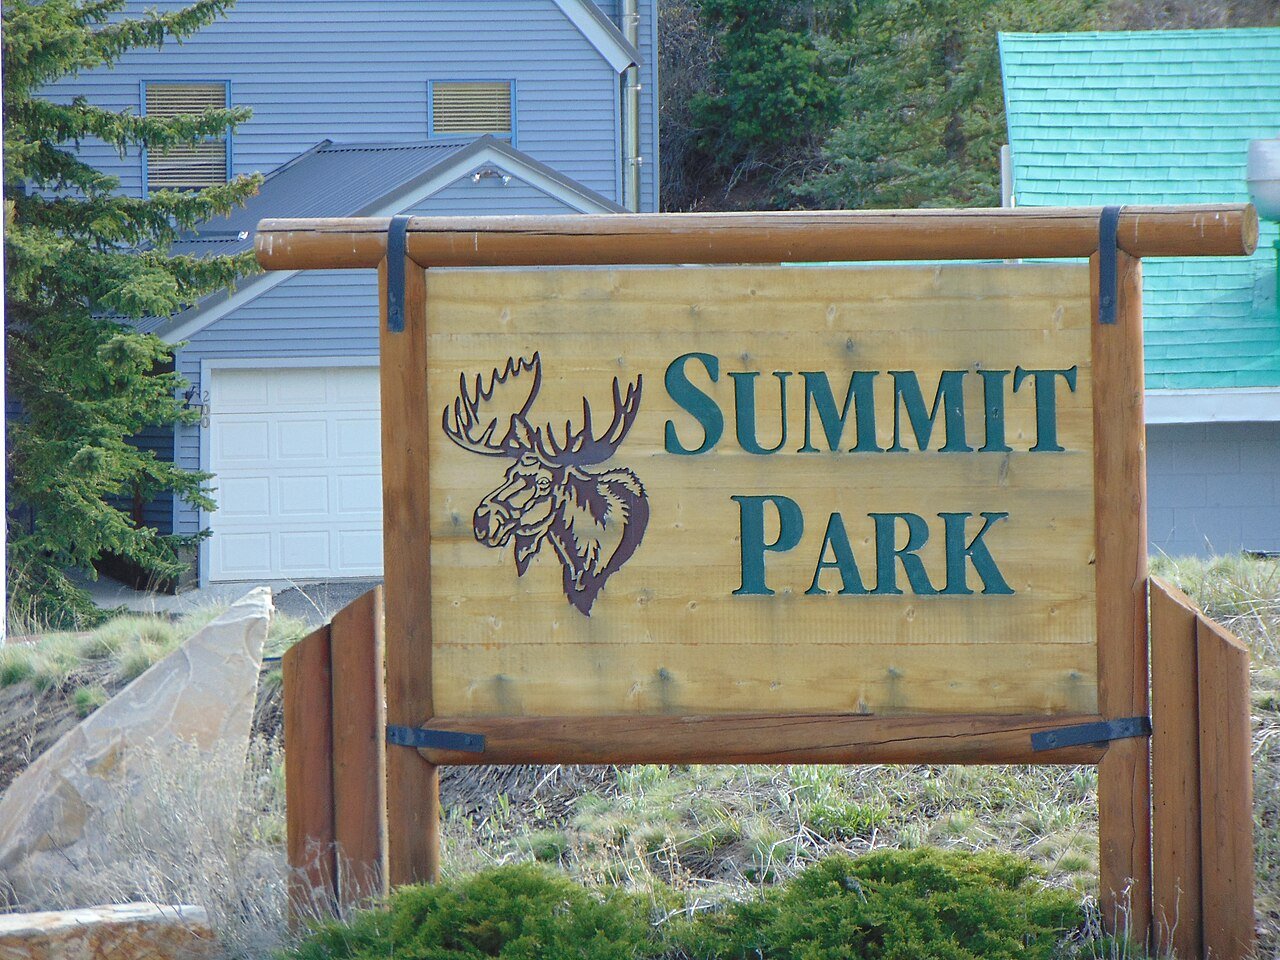
T3 Summit Park8,537 people 23% 20–26%8,537
T3 East Basin4,002 people 23% 19–26%4,002
T3 Snyderville5,948 people 23% 20–26%5,948
T3 Heber18,015 people 23% 20–27%18,015
T7 Ivins9,998 people 24% 21–27%9,998
T7 Gunnison3,562 people 24% 21–28%3,562
T9 Mountain Green3,976 people 25% 21–28%3,976
T9 Fillmore2,676 people 25% 21–29%2,676
T9 Highland20,119 people 25% 22–27%20,119
T9 Alpine10,392 people 25% 22–27%10,392
T9 Lindon11,765 people 25% 23–28%11,765
T9 Kanab5,081 people 25% 21–29%5,081
T9 Mapleton13,114 people 25% 23–28%13,114
T9 Beaver3,681 people 25% 21–29%3,681
T9 Delta3,705 people 25% 21–29%3,705
T9 Cedar Hills9,950 people 25% 23–28%9,950
T9 Washington32,348 people 25% 22–28%32,348
T9 Santa Clara8,152 people 25% 22–29%8,152
T9 Perry5,843 people 25% 22–29%5,843
T22 Elk Ridge4,898 people 26% 23–29%4,898
T22 St. George101,995 people 26% 23–29%101,995
T22 Morgan4,409 people 26% 22–30%4,409
T22 Springville35,849 people 26% 23–28%35,849
T22 Hyde Park5,540 people 26% 23–29%5,540
T22 Payson23,039 people 26% 23–28%23,039
T22 Hurricane22,771 people 26% 23–29%22,771
T22 Providence8,947 people 26% 23–29%8,947
T22 Orem97,182 people 26% 24–29%97,182
T22 American Fork37,109 people 26% 24–29%37,109
T22 Salem10,324 people 26% 24–29%10,324
T22 Nephi6,885 people 26% 22–30%6,885
T22 Lehi85,173 people 26% 24–29%85,173
T22 Pleasant Grove37,852 people 26% 24–29%37,852
T22 Wellsville4,157 people 26% 23–29%4,157
T22 Manti3,594 people 26% 23–30%3,594
T22 Spanish Fork44,946 people 26% 24–29%44,946
T22 North Logan11,460 people 26% 23–29%11,460
T22 Hyrum10,401 people 26% 23–29%10,401
T22 Parowan3,165 people 26% 23–30%3,165
T22 Saratoga Springs48,425 people 26% 24–29%48,425
T43 Brigham City19,992 people 27% 23–31%19,992
T43 Mount Pleasant3,805 people 27% 23–30%3,805
T43 Blanding3,275 people 27% 22–31%3,275
T43 Smithfield14,408 people 27% 24–30%14,408
T43 Roosevelt7,078 people 27% 23–30%7,078
T43 Richmond3,000 people 27% 24–30%3,000
T43 Holladay31,099 people 27% 25–29%31,099
T43 Moab5,312 people 27% 23–31%5,312
T43 Maeser4,435 people 27% 24–30%4,435
T43 Erda3,881 people 27% 24–30%3,881
T43 Santaquin16,436 people 27% 25–30%16,436
T43 Garland2,660 people 27% 24–31%2,660
T43 Monroe2,616 people 27% 24–31%2,616
T43 West Valley City138,437 people 27% 25–30%138,437
T43 Stansbury Park11,242 people 27% 24–31%11,242
T58 Cottonwood Heights32,828 people 28% 25–30%32,828
T58 Tremonton11,477 people 28% 24–31%11,477
T58 Nibley7,952 people 28% 24–31%7,952
T58 Millcreek63,648 people 28% 25–30%63,648
T58 Sandy94,291 people 28% 25–30%94,291
T58 Eagle Mountain53,290 people 28% 25–31%53,290
T58 Kearns37,696 people 28% 25–30%37,696
T58 Fruit Heights6,023 people 28% 25–31%6,023
T58 South Jordan82,686 people 28% 26–30%82,686
T58 Draper50,278 people 28% 26–30%50,278
T58 Naples3,285 people 28% 25–31%3,285
T58 Helper2,698 people 28% 24–32%2,698
T58 South Ogden17,650 people 28% 25–31%17,650
T58 Pleasant View11,217 people 28% 25–31%11,217
T58 Richfield8,224 people 28% 24–32%8,224
T58 Enoch8,144 people 28% 25–32%8,144
T58 Salina2,546 people 28% 24–32%2,546
T58 Taylorsville58,678 people 28% 26–31%58,678
T58 North Ogden21,947 people 28% 25–31%21,947
T58 Vernal10,392 people 28% 25–32%10,392
T58 Ephraim5,949 people 28% 24–32%5,949
T58 La Verkin4,476 people 28% 25–31%4,476
T58 Murray50,188 people 28% 26–31%50,188
T58 Washington Terrace9,182 people 28% 25–31%9,182
T58 Bountiful45,023 people 28% 25–31%45,023
T58 Cedar City38,524 people 28% 25–32%38,524
T58 Centerville16,679 people 28% 25–31%16,679
T58 Vineyard14,446 people 28% 26–31%14,446
T58 Farr West7,952 people 28% 26–32%7,952
T87 Salt Lake City208,007 people 29% 26–31%208,007
T87 Ogden87,413 people 29% 26–31%87,413
T87 Roy38,993 people 29% 26–31%38,993
T87 Tooele38,405 people 29% 25–32%38,405
T87 West Jordan116,692 people 29% 26–31%116,692
T87 South Salt Lake26,352 people 29% 26–31%26,352
T87 Plain City8,396 people 29% 26–32%8,396
T87 Magna30,031 people 29% 26–31%30,031
T87 North Salt Lake23,474 people 29% 26–32%23,474
T87 White City5,669 people 29% 26–32%5,669
T87 Grantsville14,341 people 29% 26–33%14,341
T87 Hooper9,338 people 29% 26–32%9,338
T87 Riverdale9,279 people 29% 26–32%9,279
T87 Kaysville33,053 people 29% 26–32%33,053
T87 Farmington25,389 people 29% 26–32%25,389
T87 West Bountiful5,915 people 29% 26–32%5,915
T87 Midvale35,989 people 29% 27–32%35,989
T87 Layton83,286 people 29% 26–32%83,286
T87 West Haven21,563 people 29% 26–33%21,563
T106 Riverton45,457 people 30% 27–32%45,457
T106 Price8,248 people 30% 26–33%8,248
T106 Syracuse35,488 people 30% 27–33%35,488
T106 Harrisville6,935 people 30% 27–33%6,935
T106 Clinton23,612 people 30% 27–33%23,612
T106 South Weber8,115 people 30% 27–33%8,115
T106 Provo114,766 people 30% 27–33%114,766
T106 West Point11,929 people 30% 27–33%11,929
T106 Woods Cross11,531 people 30% 27–33%11,531
T106 Herriman59,346 people 30% 28–33%59,346
T116 Logan54,907 people 31% 27–34%54,907
T116 Sunset5,587 people 31% 28–34%5,587
T116 Clearfield33,523 people 31% 28–34%33,523
T116 Bluffdale18,797 people 31% 28–34%18,797
How it works

How this ranking works

The UT list, with the map →

We rank every town by the share of adults who have ever been told by a doctor that they have depression, as estimated by the CDC. The lowest share ranks #1. Across Utah it’s 27%.

These are the CDC’s modeled estimates, not a count: national survey answers combined with each area’s age, sex, race and income mix. Each carries a likely range (shown in the table), so we rank on the whole percent and towns at the same figure share a rank (T = tied). Differences of a point or two are within the estimates’ margins.

Cities and villages use the CDC’s own estimate for that place. New England towns and townships, which the CDC doesn’t publish, use the ZIP codes that cover them, weighted by land area.

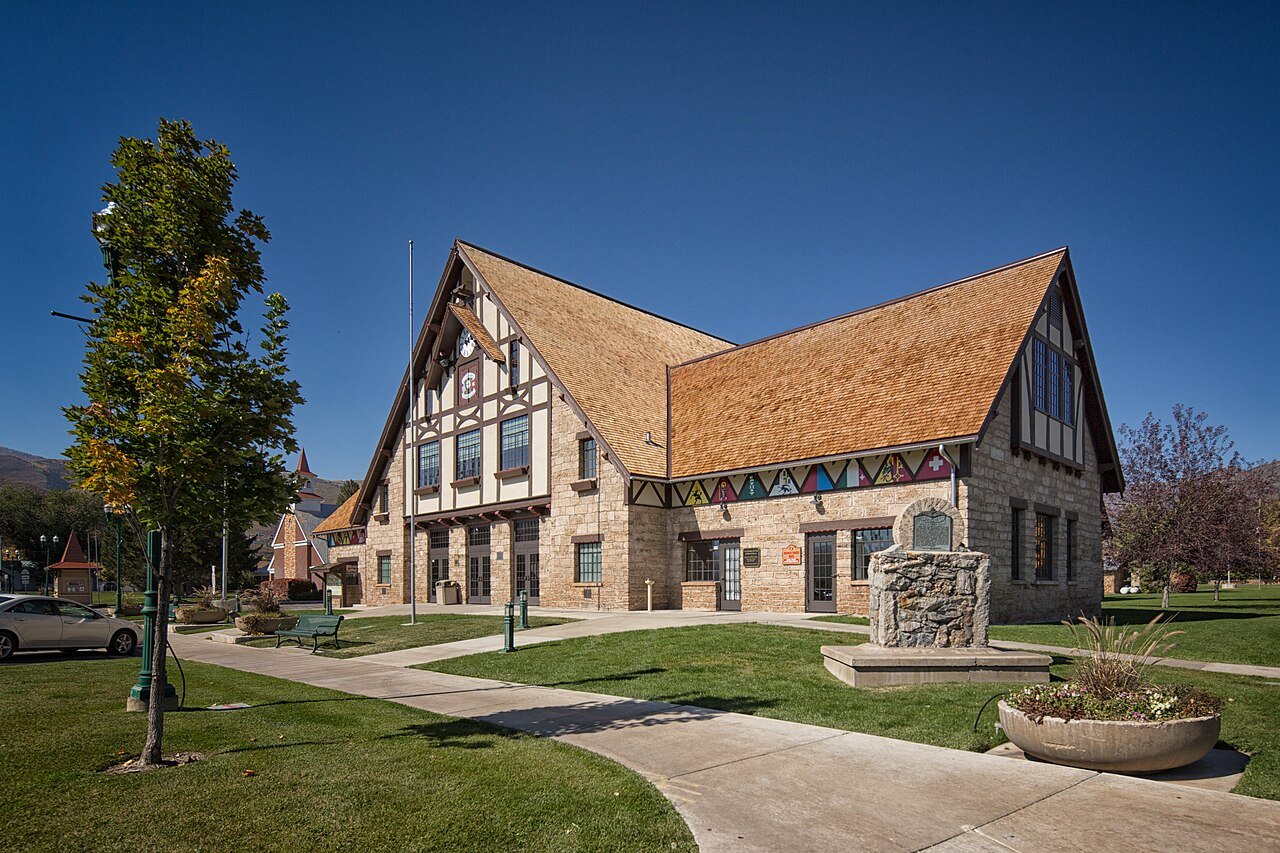
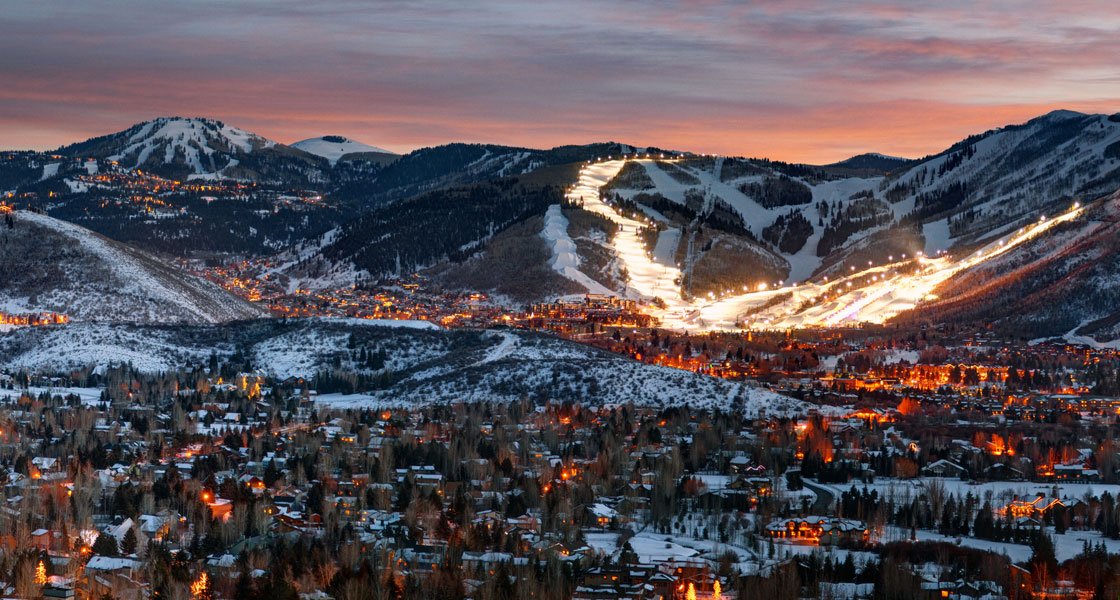
Only towns with at least 2,500 residents are ranked; Census estimates for smaller places are too uncertain. Population and income: U.S. Census Bureau American Community Survey 5-year estimates. Health estimates: CDC PLACES. Town photos: Wikimedia Commons, credited on each town’s page.

More on health in Moab →

Tell Moab what the numbers miss

Your answer becomes a post in Moab’s Town Square.

Weigh in
#43 of 119 for low depression. Does that ring true?
Ask neighbors

Post to Moab

We’ll email a one-tap link to publish your post. No password, and nothing is public until you click it.
Already a member? Sign in