Guest, Sign inJoin

← How Mapleton ranks

South Dakota rankings · Climate

Snowiest towns in South Dakota

Ranked by average snowfall in a normal winter, 1991–2020, at the nearest NOAA weather station. Towns that share a station share its figure and its rank (T = tied). 37 towns with 2,500+ residents that get at least an inch of snow a year.

Other SD lists
MapletonNot on this list

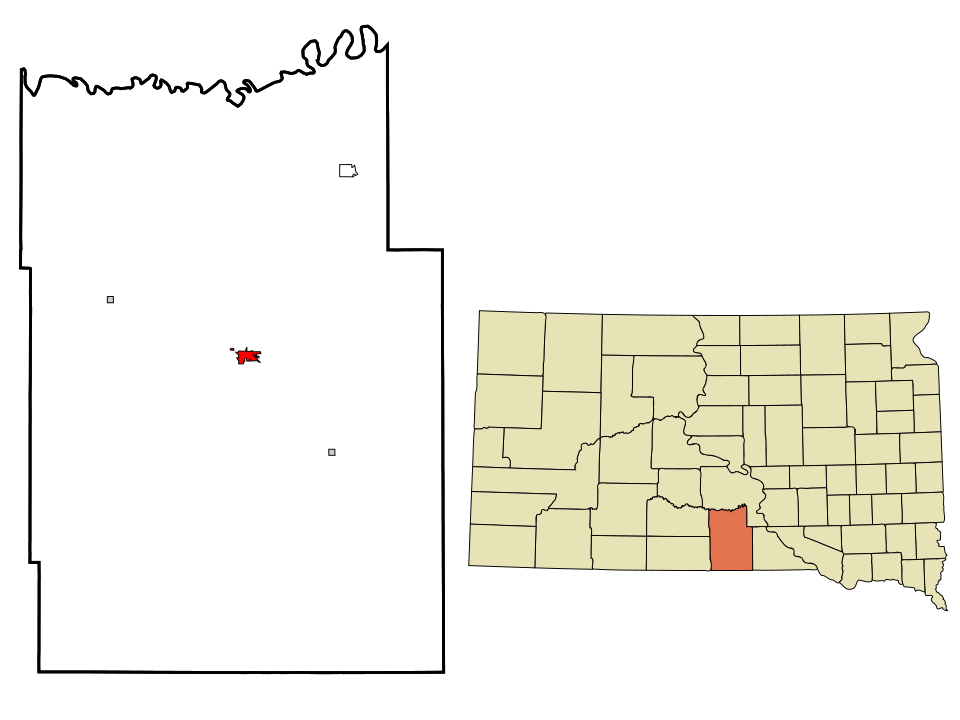
Mapleton has fewer than 2,500 residents, the floor for SD lists.
All 37 towns

Snow a year, highest first. Towns next door to Mapleton are tagged.

#TownSnow a yearDays with 1"+ of snowWeather station
1 Lead3,006 people 184 in 40—
2 Spearfish12,930 people 71 in 18—
3 Winner2,905 people 49 in 15—
T4 Sioux Falls201,469 people · next door 49 in 14—
T4 Brandon10,996 people 49 in 14—
T4 Harrisburg8,519 people 49 in 14—
T4 Tea6,786 people 49 in 14—
T4 Split RockMinnehaha County · 3,143 people 49 in 14—
T9 Box Elder12,902 people 49 in 15—
T9 Rapid Valley6,975 people 49 in 15—
11 Sisseton2,670 people 48 in 14—
12 Sturgis7,086 people 48 in 12—
13 Huron14,385 people 44 in 13—
14 Chamberlain2,588 people 43 in 16—
15 Aberdeen28,189 people 43 in 13—
16 Belle Fourche5,804 people 42 in 12—
17 Watertown23,044 people 41 in 13—
18 Mitchell15,649 people 41 in 12—
T19 Dell Rapids3,905 people 40 in 12—
T19 Hartford3,478 people 40 in 12—
21 Yankton15,540 people 38 in 13—
22 Pierre13,948 people 37 in 12—
23 Madison6,094 people 37 in 13—
24 Mobridge2,932 people 36 in 12—
T25 Vermillion11,878 people 36 in 12—
T25 Elk Point2,537 people 36 in 12—
T27 Rapid City77,946 people 36 in 14—
T27 Canton3,033 people 36 in 13—
T27 Summerset3,022 people 36 in 14—
T27 Blackhawk2,934 people 36 in 14—
T27 Colonial Pine Hills2,609 people 36 in 14—
T32 Big SiouxUnion County · 4,917 people 36 in 11—
T32 Dakota Dunes3,936 people 36 in 11—
T32 North Sioux City3,045 people 36 in 11—
35 Brookings23,948 people 36 in 13—
36 Milbank3,525 people 32 in 9—
37 Hot Springs3,548 people 32 in 13—
How it works

How this ranking works

The SD list, with the map →

We rank every town by average snowfall in a normal winter, 1991–2020, at the nearest NOAA weather station. Towns that get less than an inch a year aren’t ranked. The town with the highest figure ranks #1. Normals are 30-year averages, not a forecast, and each town’s Climate page shows its whole year month by month.

Snow and frost are measured at weather stations, and each town uses the nearest NOAA station with a matching climate (within 25 miles, with temperatures that agree with the town’s own). Towns near the same station share its figure, so they tie.

Only towns with at least 2,500 residents are ranked; Census estimates for smaller places are too uncertain. Population and income: U.S. Census Bureau American Community Survey 5-year estimates. Climate: NOAA NCEI U.S. Climate Normals, 1991–2020. Town photos: Wikimedia Commons, credited on each town’s page.

More on climate in Mapleton →

Tell Mapleton what the numbers miss

Your answer becomes a post in Mapleton’s Town Square.

Weigh in
Should Mapleton be on this list?
Ask neighbors

Post to Mapleton

We’ll email a one-tap link to publish your post. No password, and nothing is public until you click it.
Already a member? Sign in