Sign inJoin

← How Java ranks

South Dakota rankings · Safety

Safest towns in South Dakota

Ranked by crime reported to police per 1,000 residents, averaged over 2023–2025, with violent crimes counted four times as heavily as property crimes. Lower is safer. 23 towns with 2,500+ residents whose police reported every year.

Other SD lists
JavaNot on this list

Java has fewer than 2,500 residents, the floor for SD lists.
All 23 towns

Weighted crime rate, lowest first.

#TownWeighted crime rateViolentProperty
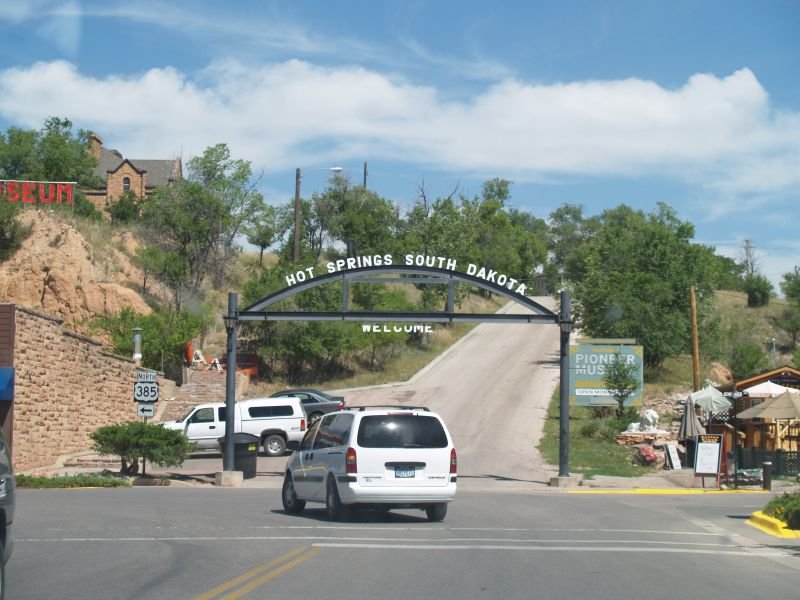
1 Hot Springs3,548 people 5.9 1.2 per 1,0001.2 per 1,000
2 Elk Point2,537 people 8.7 1.0 per 1,0004.8 per 1,000
3 Lead3,006 people 11.2 1.5 per 1,0005.0 per 1,000
4 Summerset3,022 people 11.4 0.9 per 1,0007.9 per 1,000
5 Winner2,905 people 12.2 1.4 per 1,0006.7 per 1,000
6 Madison6,094 people 13.5 1.4 per 1,0008.0 per 1,000
7 Brookings23,948 people 14.7 1.0 per 1,00010.7 per 1,000
8 Tea6,786 people 15.9 1.4 per 1,00010.3 per 1,000
9 Sisseton2,670 people 18.5 2.6 per 1,0007.9 per 1,000
10 Vermillion11,878 people 20.3 1.9 per 1,00012.7 per 1,000
11 Watertown23,044 people 21.7 2.6 per 1,00011.4 per 1,000
12 Belle Fourche5,804 people 23.0 2.2 per 1,00014.3 per 1,000
13 North Sioux City3,045 people 25.1 2.2 per 1,00016.3 per 1,000
14 Huron14,385 people 26.6 2.5 per 1,00016.5 per 1,000
15 Spearfish12,930 people 28.2 2.3 per 1,00019.1 per 1,000
16 Box Elder12,902 people 28.6 3.7 per 1,00014.0 per 1,000
17 Yankton15,540 people 30.3 2.7 per 1,00019.4 per 1,000
18 Aberdeen28,189 people 30.7 4.0 per 1,00014.7 per 1,000
19 Mitchell15,649 people 30.7 2.9 per 1,00019.2 per 1,000
20 Sturgis7,086 people 34.1 3.2 per 1,00021.5 per 1,000
21 Pierre13,948 people 40.7 5.1 per 1,00020.4 per 1,000
22 Sioux Falls201,469 people 42.8 4.4 per 1,00025.1 per 1,000
23 Rapid City77,946 people 67.5 7.4 per 1,00037.8 per 1,000
How it works

How this ranking works

The SD list, with the map →

For each town we add up the violent and property crimes its police reported to the FBI over 2023–2025 and divide by the population they served, giving a rate per 1,000 residents. Violent crimes (homicide, rape, robbery and aggravated assault) count four times as much as property crimes (burglary, theft, vehicle theft and arson), because they weigh more on how safe a place feels. The lowest weighted rate ranks #1.

These are crimes reported to police, not convictions, and towns with a campus, highway, beach or shopping center also count incidents involving visitors. A town is ranked only if its police department reported a full year in every one of these years; towns patrolled by a county sheriff or state police don't have their own figures. There is no “most dangerous” list, on purpose.

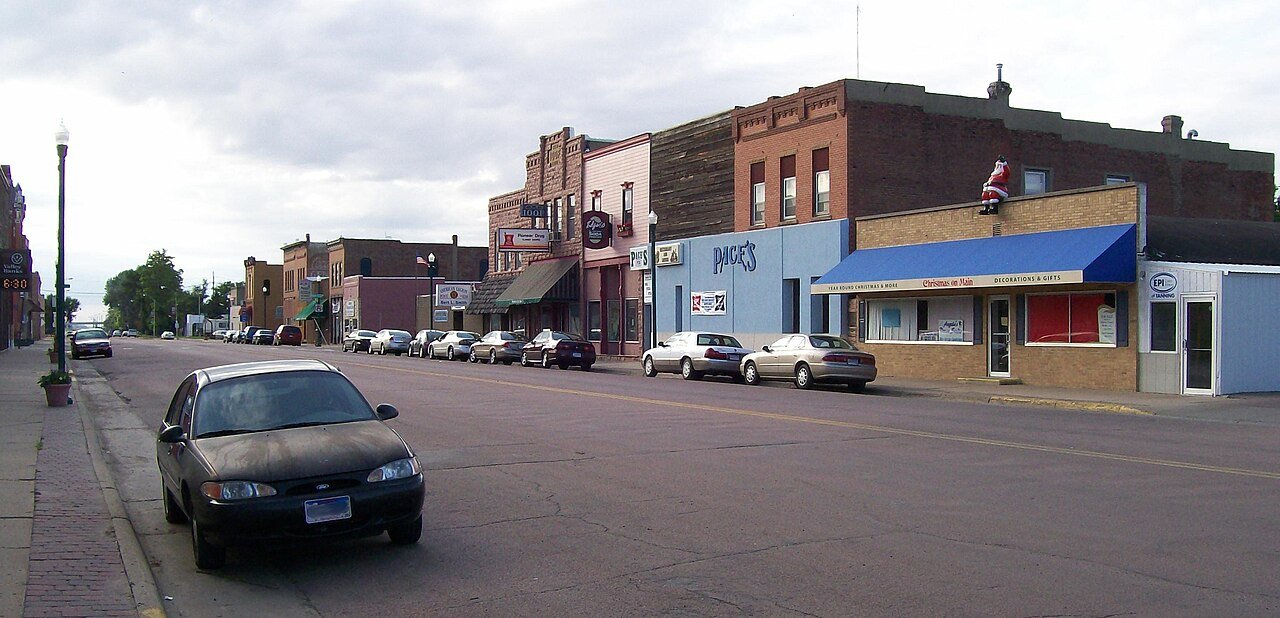
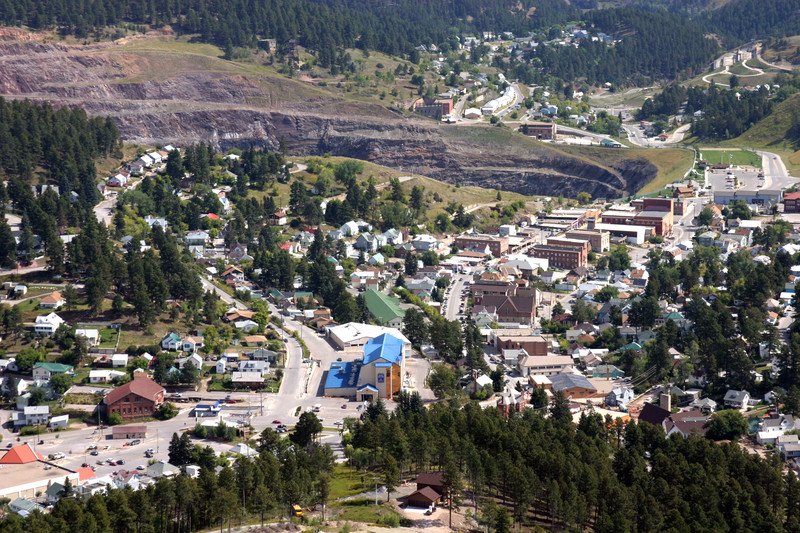
Only towns with at least 2,500 residents are ranked; Census estimates for smaller places are too uncertain. Population and income: U.S. Census Bureau American Community Survey 5-year estimates. Crime: FBI Uniform Crime Reporting Program, offenses known to law enforcement by city. Town photos: Wikimedia Commons, credited on each town’s page.

More on safety in Java →

Tell Java what the numbers miss

Your answer becomes a post in Java’s Town Square.

Weigh in
Should Java be on this list?
Ask neighbors

Post to Java

We’ll email a one-tap link to publish your post. No password, and nothing is public until you click it.
Already a member? Sign in