SCSouth Carolina rankings

Towns where housing hasn't kept up with growth in South Carolina

Ranked by how many new residents each town gained for every new home it permitted between the 2010 and 2020 censuses. 38 towns with 2,500+ residents.
U.S. Census ACS 2020–2024 5-year

#TownNew residents per new homeResidents gainedHomes permitted
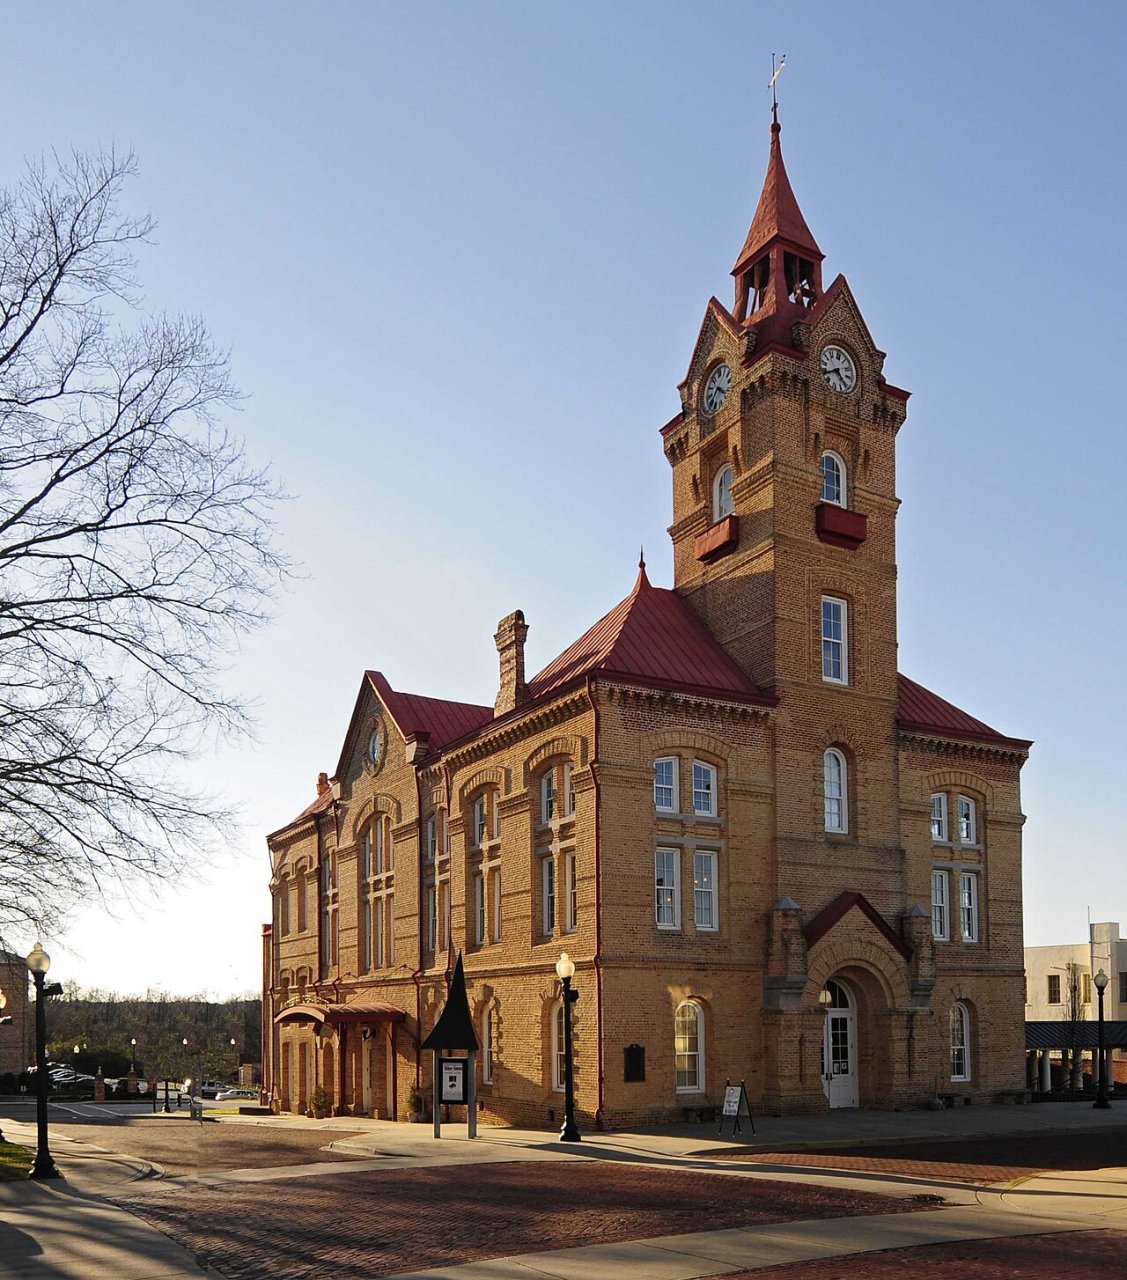
1 Newberry Newberry10,790 people 13.8 per home 414 30
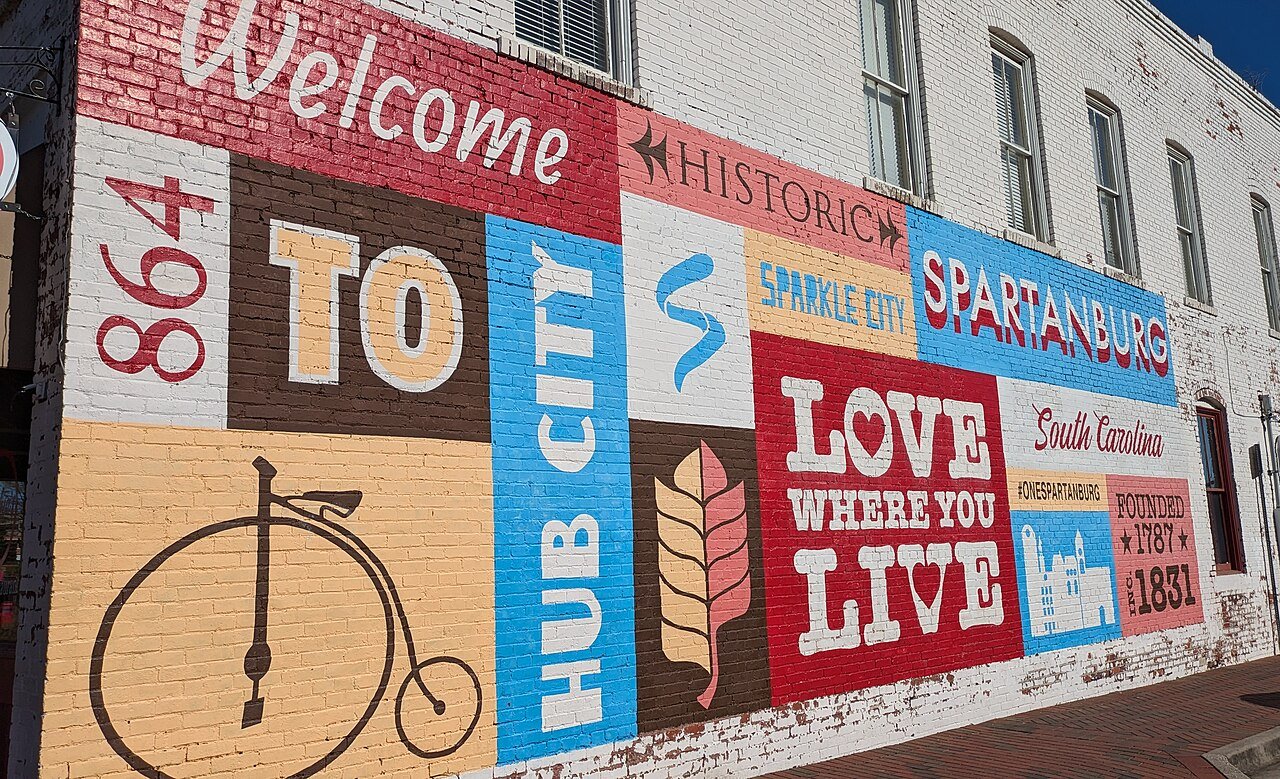
2 Spartanburg Spartanburg38,910 people 7.1 per home 1,719 241
3 Goose Creek Goose Creek48,078 people 4.4 per home 10,008 2,265
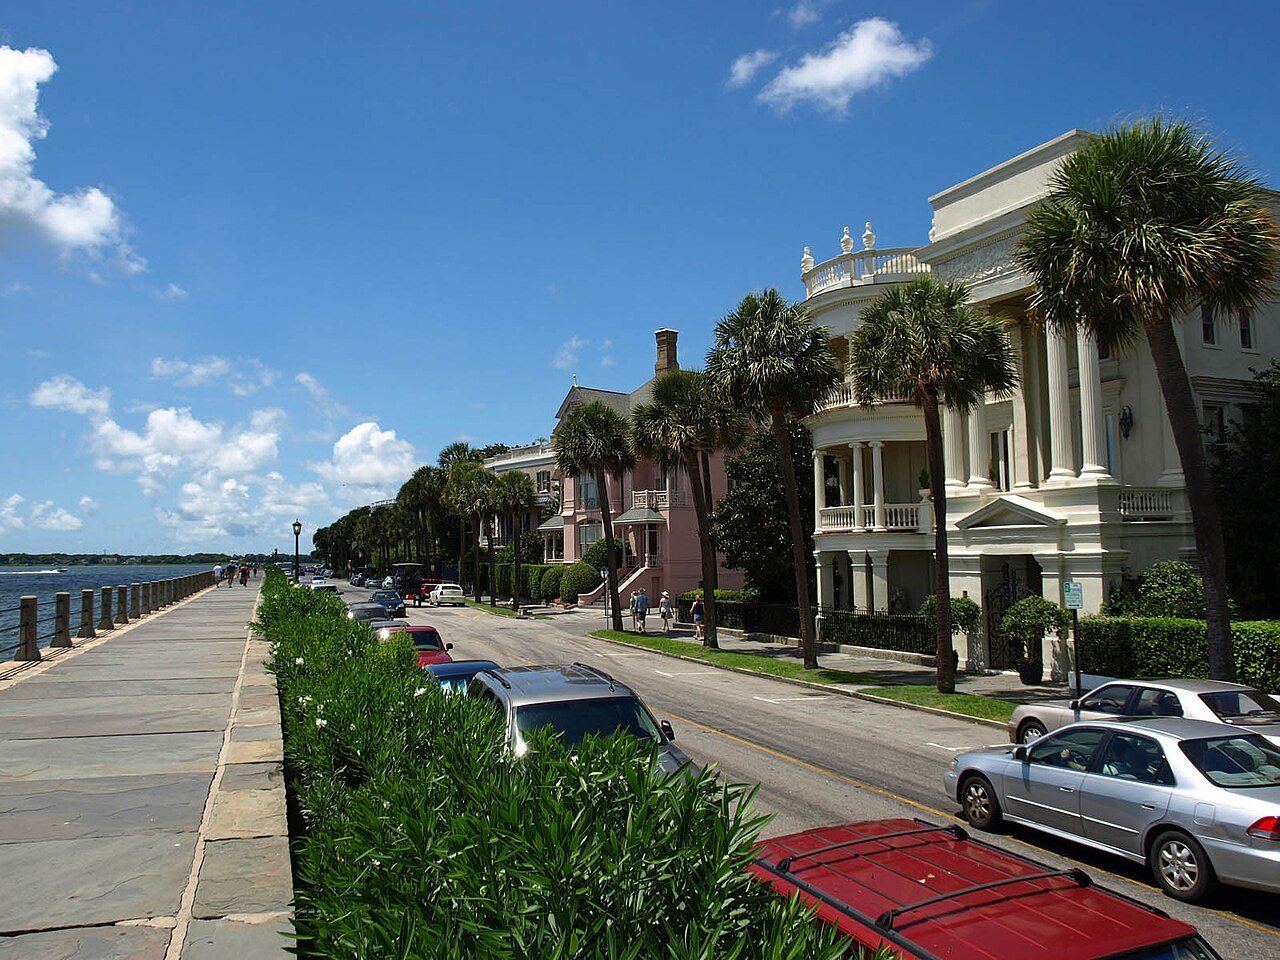
4 Charleston Charleston154,338 people 3.2 per home 30,144 9,407
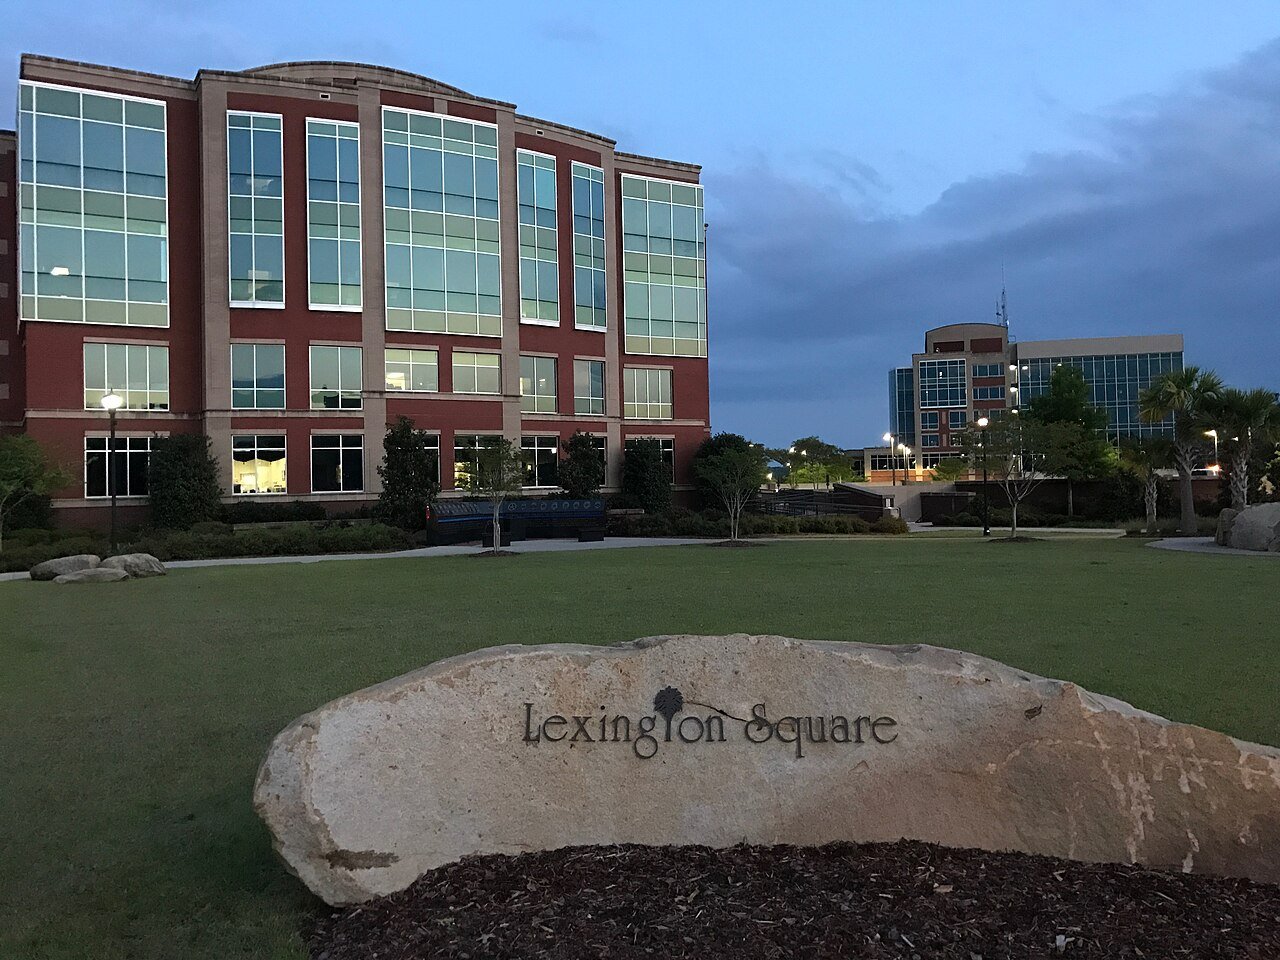
5 Lexington Lexington24,585 people 3.1 per home 5,698 1,844
6 West Columbia West Columbia17,963 people 3.1 per home 2,428 786
7 Moncks Corner Moncks Corner15,485 people 3.0 per home 5,412 1,836
8 Camden Camden8,267 people 2.8 per home 950 345
9 Beaufort Beaufort13,747 people 2.7 per home 1,246 454
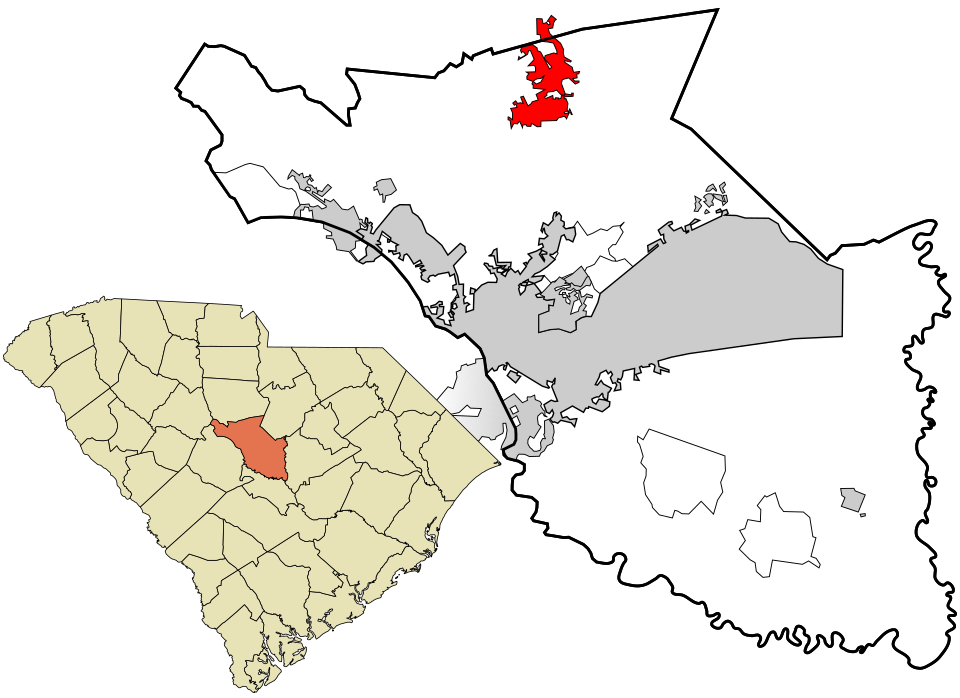
10 Map of Blythewood Blythewood5,731 people 2.7 per home 2,738 1,006
11 Fort Mill Fort Mill30,775 people 2.7 per home 13,710 5,179
12 Greer Greer41,536 people 2.6 per home 9,793 3,773
13 York York8,969 people 2.6 per home 767 295
14 Clover Clover7,234 people 2.6 per home 1,577 607
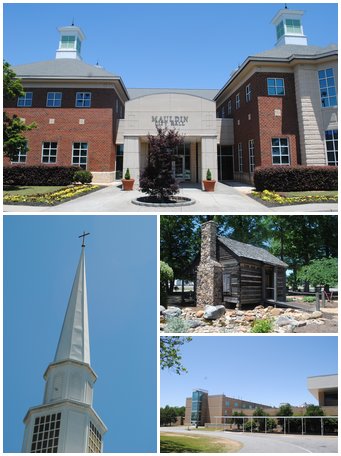
15 Mauldin Mauldin27,055 people 2.6 per home 1,835 720
16 Easley24,841 people 2.5 per home 2,928 1,169
17 Seneca Seneca8,993 people 2.5 per home 748 302
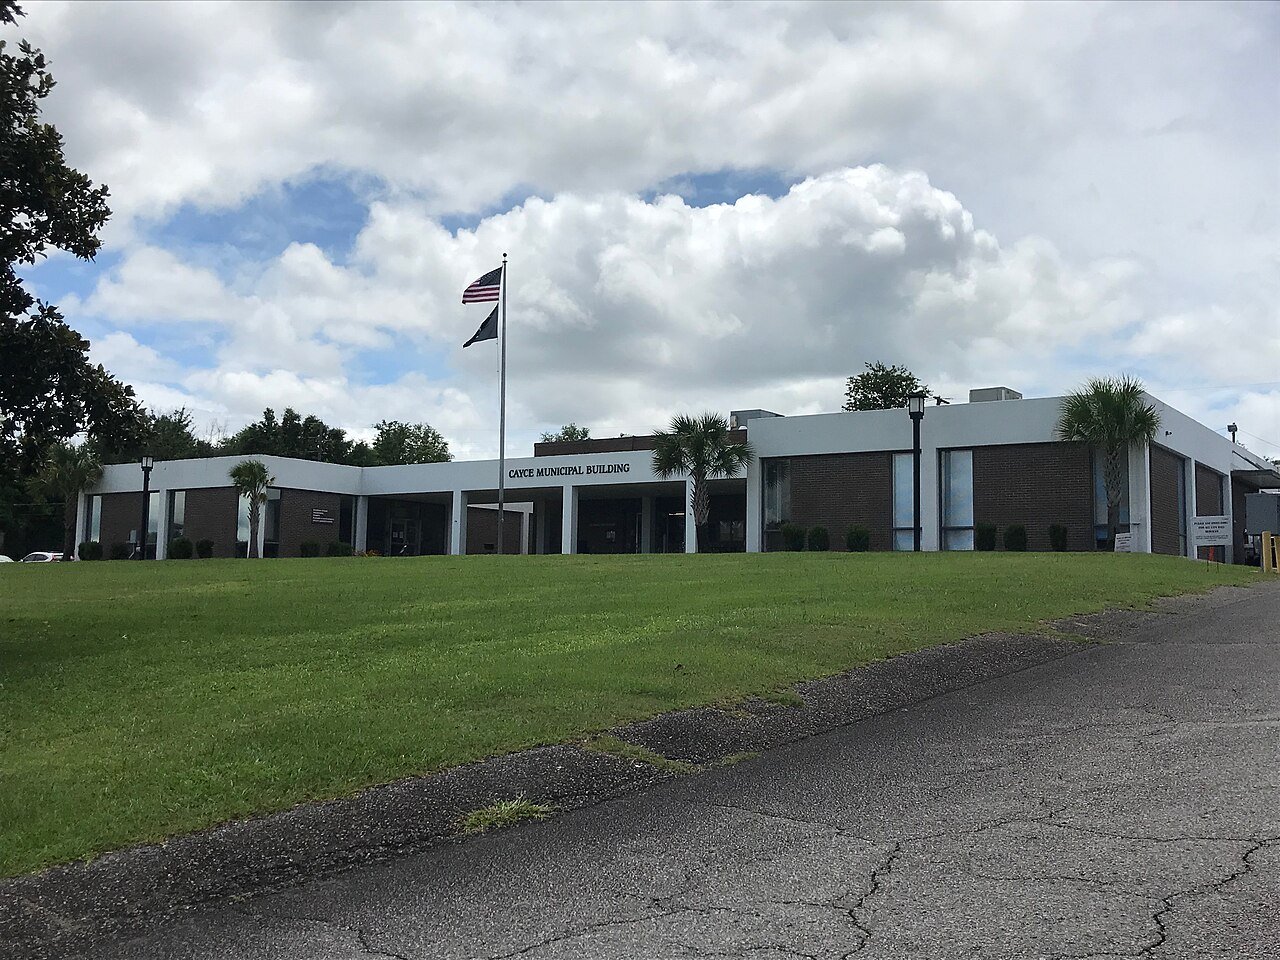
18 Cayce Cayce13,741 people 2.5 per home 1,253 512
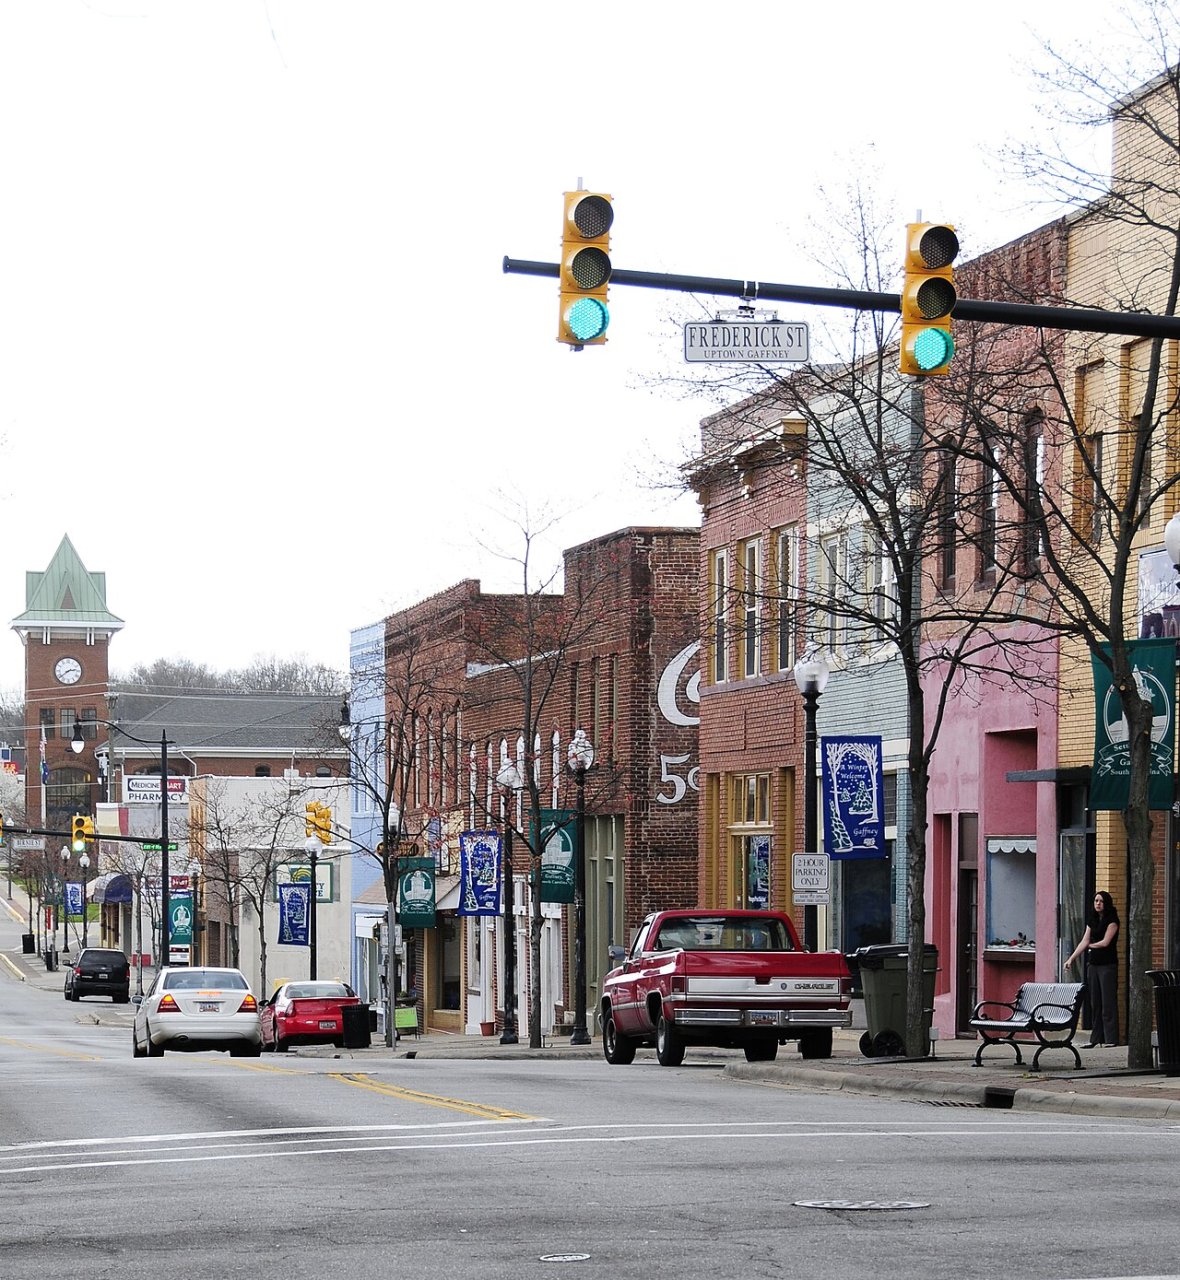
19 Gaffney Gaffney12,596 people 2.4 per home 350 147
20 Rock Hill Rock Hill75,259 people 2.3 per home 8,218 3,545
21 Summerville Summerville51,654 people 2.3 per home 7,523 3,270
22 Map of Mount Pleasant Mount Pleasant93,993 people 2.1 per home 22,958 10,852
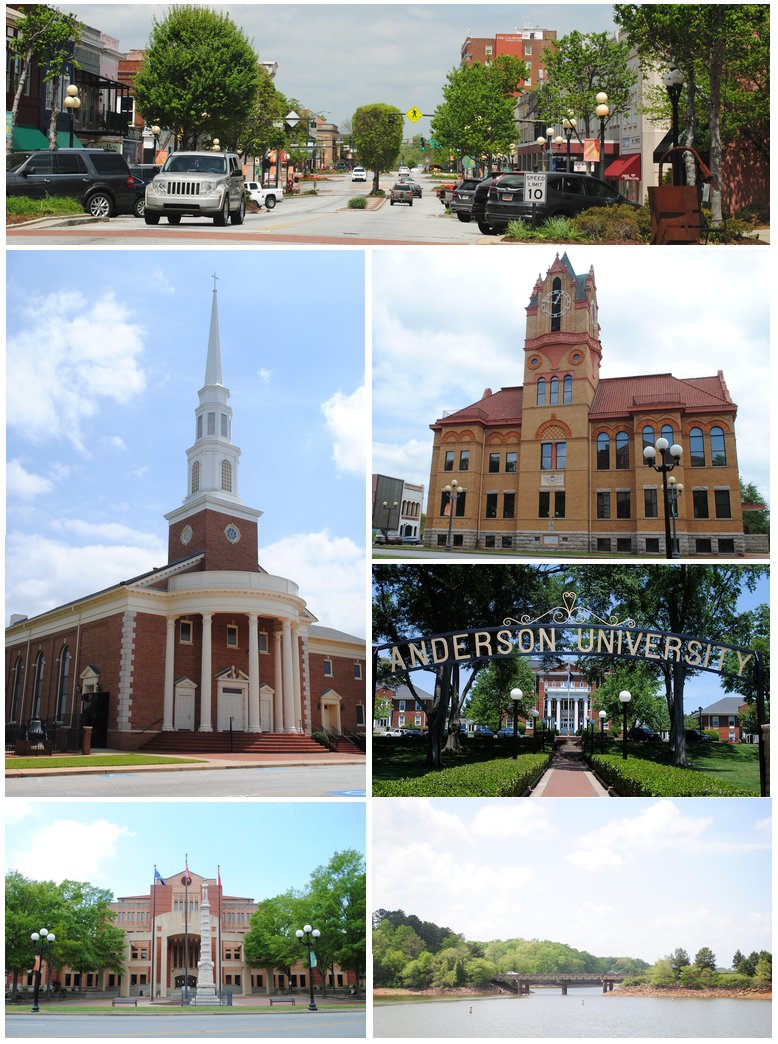
23 Anderson Anderson30,051 people 2.1 per home 1,420 686
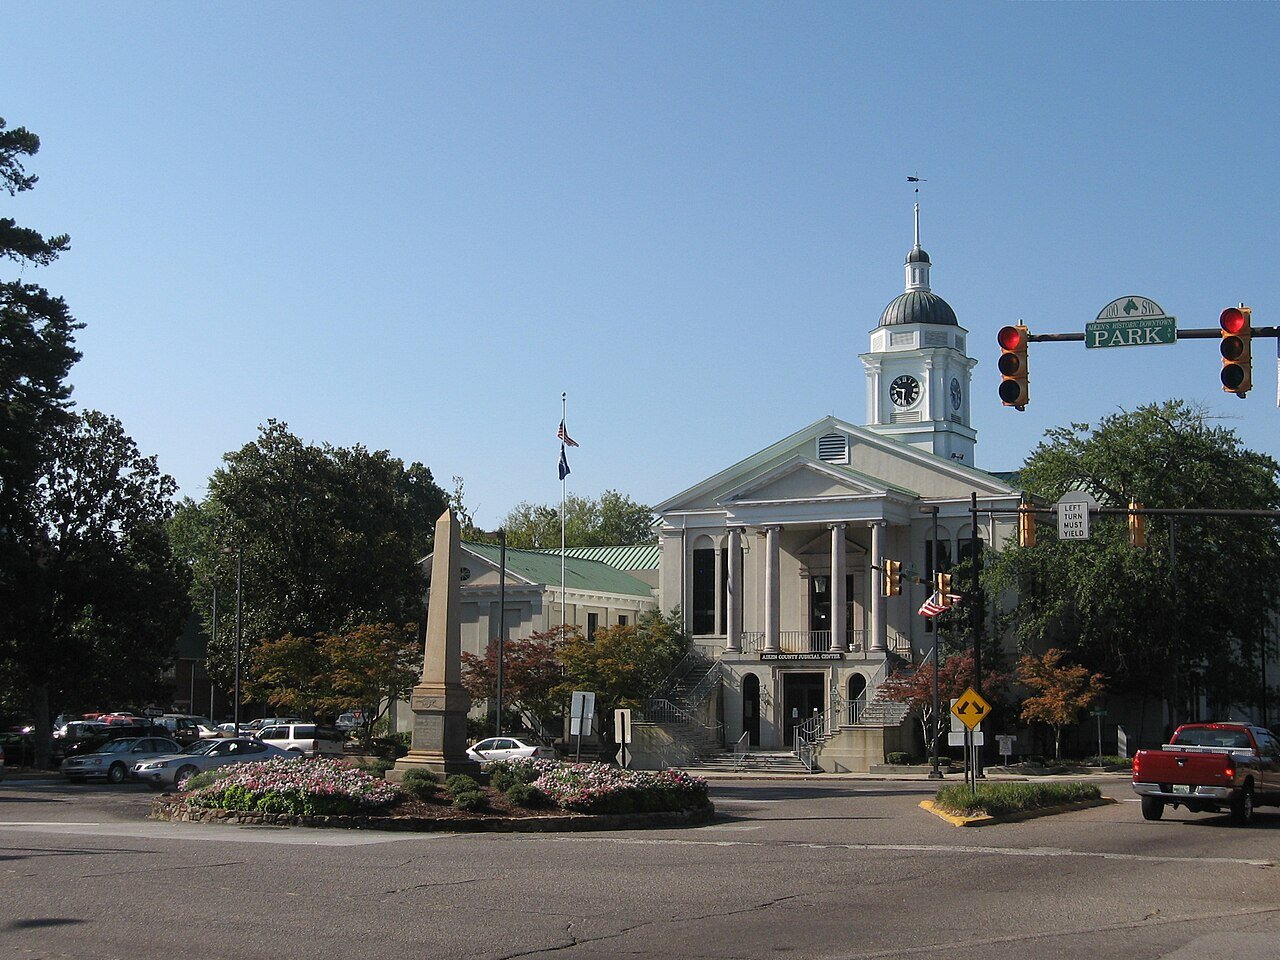
24 Aiken Aiken32,521 people 2.1 per home 2,501 1,222
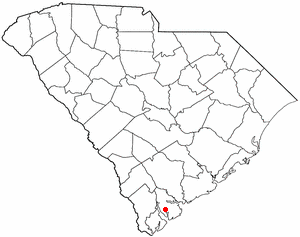
25 Map of Port Royal Port Royal15,579 people 2.1 per home 3,542 1,724
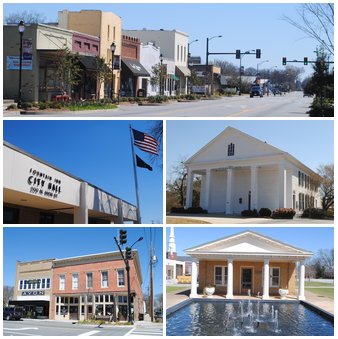
26 Fountain Inn Fountain Inn12,020 people 2.1 per home 2,617 1,278
27 Myrtle Beach Myrtle Beach38,371 people 2.0 per home 8,573 4,198
28 North Charleston North Charleston119,913 people 2.0 per home 17,381 8,668
29 Simpsonville Simpsonville26,144 people 2.0 per home 5,116 2,566
30 Columbia Columbia139,643 people 1.9 per home 7,360 3,803
31 Hardeeville Hardeeville10,871 people 1.9 per home 4,521 2,392
32 North Myrtle Beach North Myrtle Beach19,855 people 1.9 per home 5,038 2,716
33 Greenville Greenville72,935 people 1.8 per home 12,311 6,706
34 North Augusta North Augusta25,653 people 1.8 per home 3,031 1,715
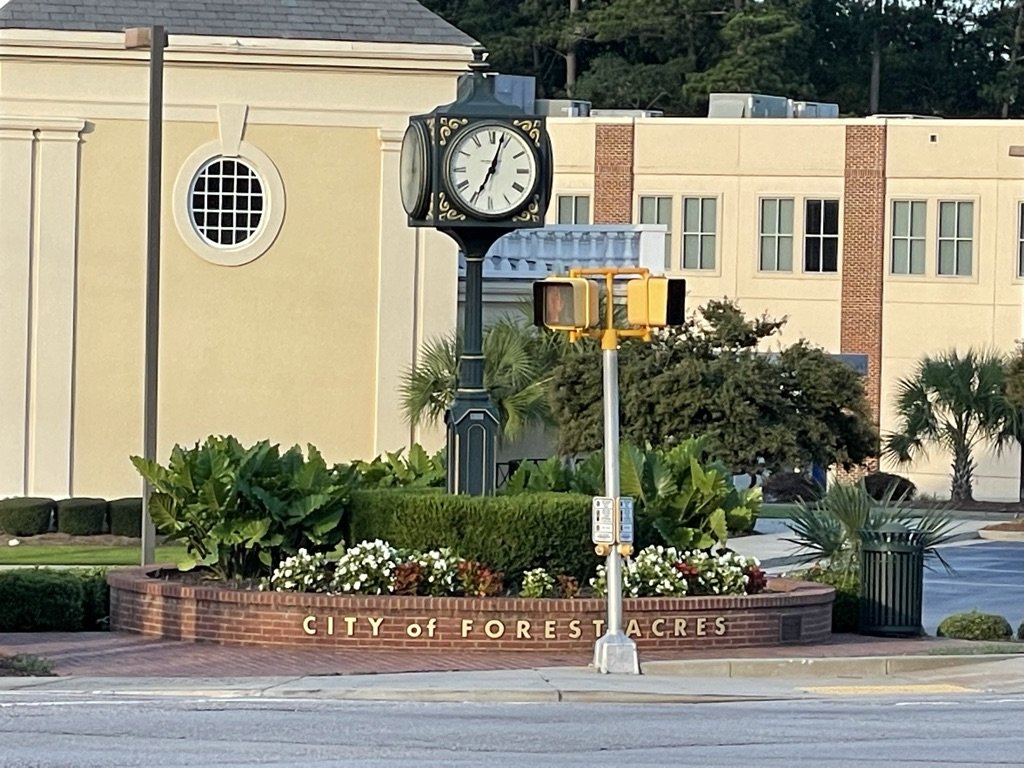
35 Forest Acres Forest Acres10,530 people 1.7 per home 256 150
36 Surfside Beach4,270 people 1.1 per home 318 283
37 Hanahan21,452 people 0.6 per home 2,328 3,780
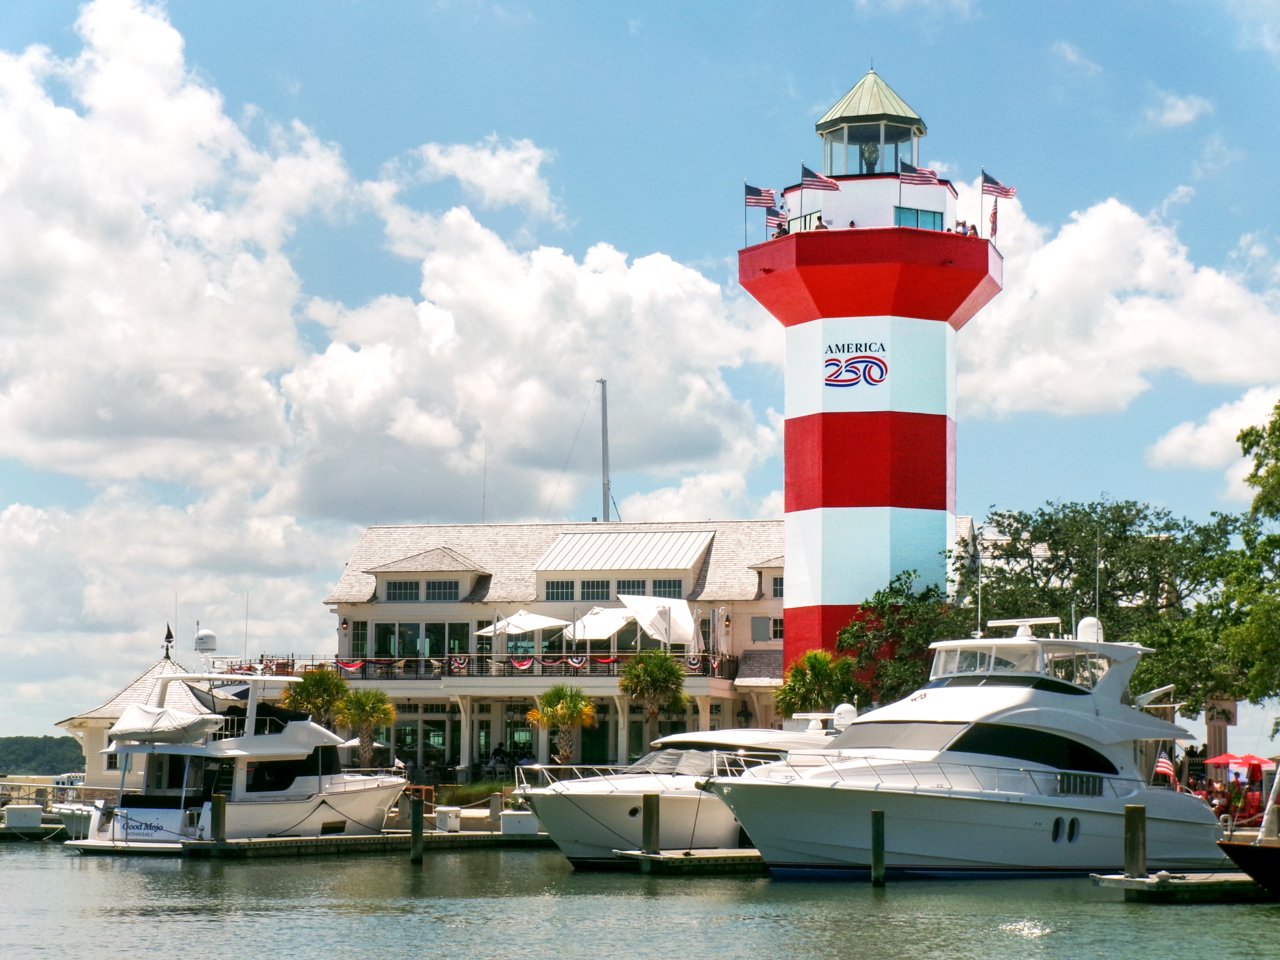
38 Hilton Head Island Hilton Head Island37,911 people 0.5 per home 562 1,211

How this ranking works

We take each town’s population change between the 2010 and 2020 censuses and divide it by the new homes its building permits authorized over 2010–2019. The result is how many new residents arrived for every new home. A high number means people came faster than homes were built, so existing homes filled up: larger households, fewer vacancies and tighter supply. The highest ratio ranks #1. Across South Carolina it’s 1.8 per home.

Only towns that gained at least 250 residents and permitted at least 10 homes are ranked, because a ratio built on a handful of either is noise. College towns, where 20% or more of residents are enrolled in college, are left out: a growing college adds dorm students as residents, but dorms never show up as permitted homes.

Only towns with at least 2,500 residents are ranked; Census estimates for smaller places are too uncertain. Population and income: U.S. Census Bureau American Community Survey 5-year estimates. New homes: U.S. Census Bureau Building Permits Survey. Residents: 2010 and 2020 decennial censuses. Town photos: Wikimedia Commons, credited on each town’s page.

Same ranking in other states