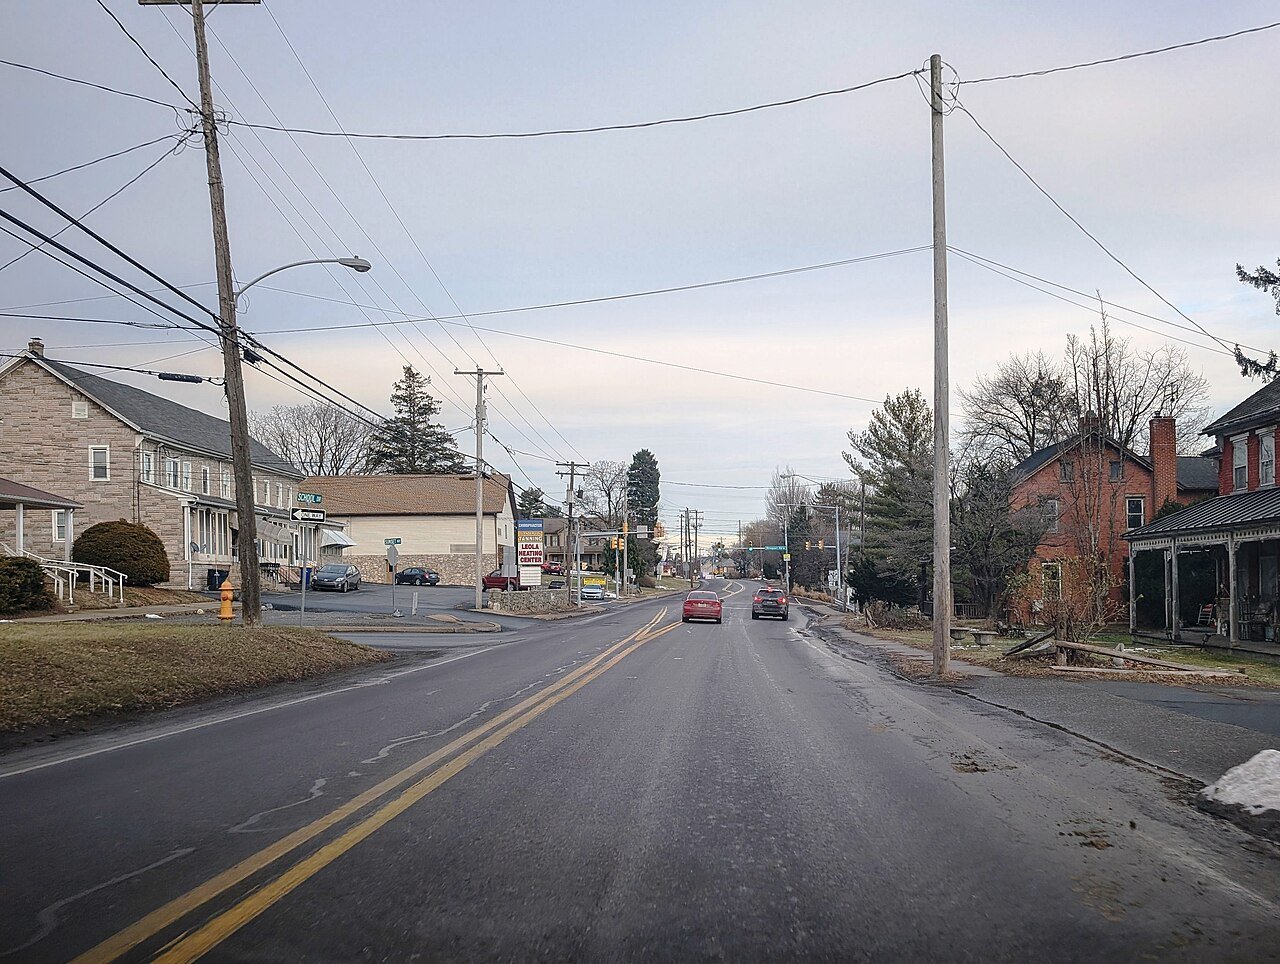
Leola has chilly winters and warm summers
A typical July afternoon reaches 86°, a January night drops to 22°, and about 21 inches of snow falls in a normal winter.
A year in Leola at a glance
Each month’s typical high and low, and what it brings.
What stands out about Leola’s climate
Read from where Leola sits among Pennsylvania’s towns. The page puts what stands out first.
What a year in Leola feels like
Typical highs and lows by season and by month, from NOAA’s 30-year normals.
21 inches of snow, 45 of rain and melt
September is the wettest month and February the driest. Rain or snow falls on about 124 days a year.
Rain + melted snow by month
Inches of water
Snowfall by month
Inches of snow
About 186 frost-free days a year
In half of years the last 32° night comes by April 19 and the first by October 24.
Freezing nights by month
Average nights at or below 32°
90° days by month
Average days at 90° or more
Living with Leola’s climate
What the numbers mean for a garden, a driveway, a furnace and a free afternoon.
186 frost-free days. The last frost comes by Apr 19 in half of years, so many gardeners wait a week or two past that to set out tomatoes. The first fall frost comes by Oct 24.
About 21" a winter over 6 days with an inch or more, most in February. Snow covers the ground about 22 days a year.
Months averaging under 55° run from October through April. Heating is 83% of the year’s heating-and-cooling load.
About 20 days a year reach 90°, and July afternoons average 86°.
The nicest months are April, May, June, August, September and October. 0.5 miles of trails are waiting.
Parks & trails →Normals are averages. Ice storms, nor’easters, floods and heat waves are on the natural hazards page.
Natural hazards →Leola and its neighbors
Upper Leacock has the coldest January nights next door (22°) and Upper Leacock the hottest July afternoons (86°). Tap a town to see its climate.
Temperatures and rain come from NOAA’s 5 km grid, so each town gets its own value. Snow and frost-free days come from the nearest weather station, so neighbors often share them.
Warmer than it used to be
The last 30 years in Leola averaged 1.8° warmer than the 1900s. The biggest change is in December (+3.3°).
A bigger shift than in 85% of U.S. towns.
Change by month
How Leola compares
Against every U.S. town on TownTapestry, each counted once, with its place in Pennsylvania.
Leola weather by month
Average highs, lows, rain and snow for every month, from NOAA’s 1991–2020 normals.
| Month | High | Low | Rain + melt | Snow | Wet days | Snow on ground | 30-yr range |
|---|---|---|---|---|---|---|---|
| January | 39° | 22° | 3.1" | 6.1" | 10 | 7 | 21° – 39° |
| February | 42° | 24° | 2.5" | 7.4" | 9 | 9 | 21° – 41° |
| March | 51° | 31° | 3.7" | 3.4" | 11 | 3 | 35° – 51° |
| April | 64° | 40° | 3.7" | 0.2" | 11 | 0 | 47° – 57° |
| May | 73° | 51° | 3.7" | 0 | 13 | 0 | 57° – 68° |
| June | 82° | 60° | 4.2" | 0 | 11 | 0 | 67° – 74° |
| July | 86° | 65° | 4.5" | 0 | 10 | 0 | 71° – 79° |
| August | 84° | 63° | 4.2" | 0 | 10 | 0 | 69° – 77° |
| September | 77° | 56° | 4.6" | 0 | 10 | 0 | 64° – 70° |
| October | 65° | 44° | 4.2" | 0.3" | 10 | 0 | 50° – 61° |
| November | 54° | 34° | 3.1" | 0.6" | 10 | 0 | 38° – 49° |
| December | 44° | 27° | 3.6" | 3.4" | 11 | 2 | 27° – 46° |
| Year | 63° | 43° | 45.2" | 21.4" | 124 | 22 |
Heating and cooling a home in Leola
83% of the work is heating, so the furnace matters far more than the air conditioner.
Degree days add up how far each day’s average falls below (heating) or rises above (cooling) 65° over a year. Source: NOAA station normals.
How much a month can swing
A normal is an average. February swings the most: from 1991 to 2020 its average ranged from 21° to 41°. June is the most reliable, staying within 7°.
Common questions about Leola’s climate
What is the coldest month in Leola?
January, with a typical high of 39° and a low of 22°.
What is the hottest month in Leola?
July, with a typical high of 86° and a low of 65°. About 20 days a year reach 90°.
How much snow does Leola get?
About 21 inches in a normal winter, most of it in February.
When is the first frost in Leola?
In half of years the first 32° night comes by October 24, and the last spring frost by April 19.
What is the rainiest month in Leola?
September, with 4.6 inches of rain and melted snow. The year totals 45 inches.
Neighbors talk weather
Gardens, snow, and the best days of the year in Leola.
Your answer becomes a post in Town Square.
Temperatures and rainfall come from NOAA’s gridded climate normals for Leola itself (about a 3-mile square). Snow, frost dates and day counts come from NOAA’s weather station at Lancaster 2ne Fltr Plt, PA (5 mi) away. Normals are 30-year averages, not a forecast. Source: NOAA NCEI U.S. Climate Normals, 1991–2020 and 1901–2000. Today’s forecast: National Weather Service.