OROregon rankings

Towns where housing hasn't kept up with growth in Oregon

Ranked by how many new residents each town gained for every new home it permitted between the 2010 and 2020 censuses. 67 towns with 2,500+ residents.
U.S. Census ACS 2020–2024 5-year

#TownNew residents per new homeResidents gainedHomes permitted
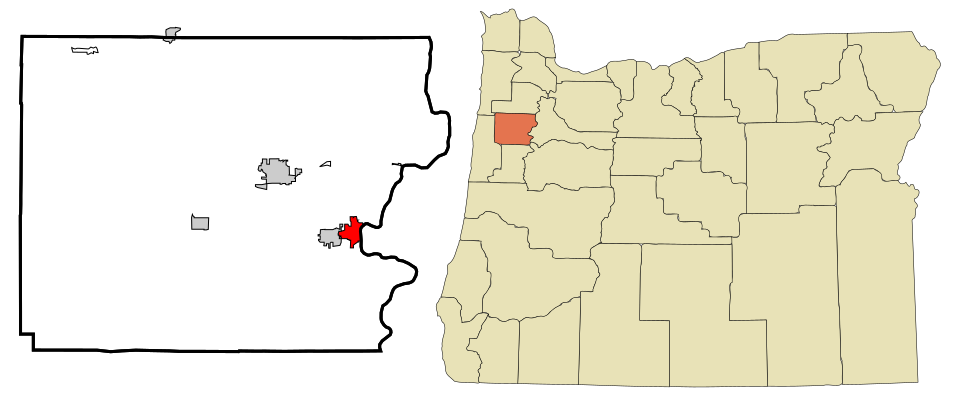
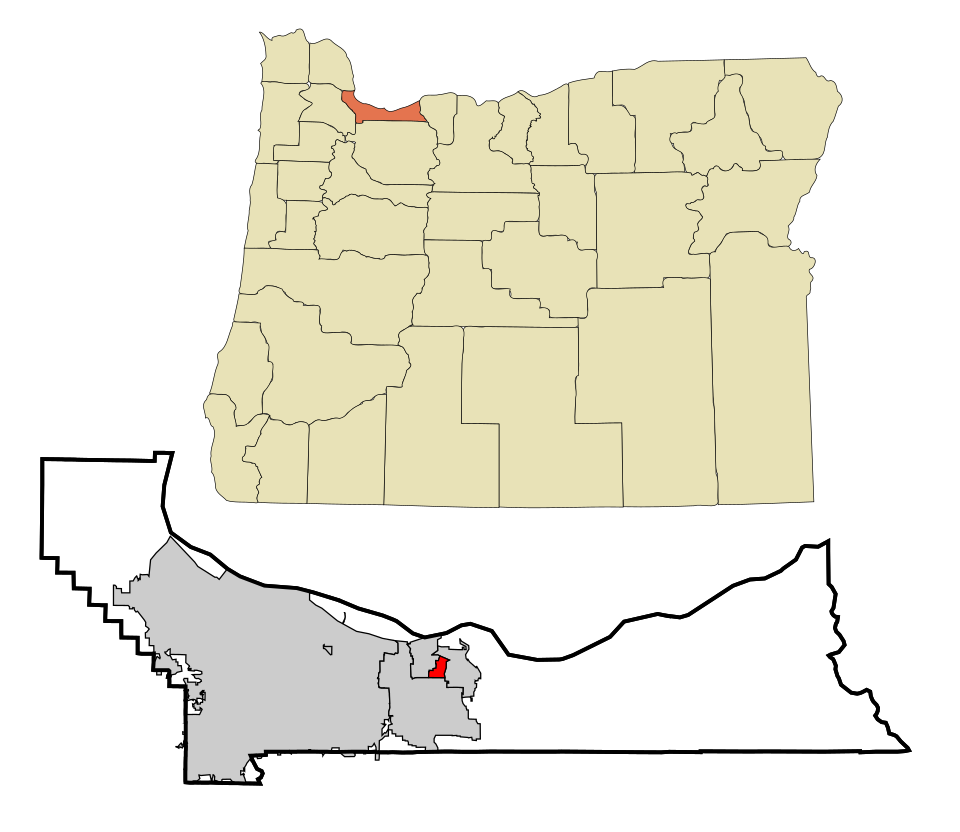
1 Map of Wood Village Wood Village4,696 people 8.2 per home 509 62
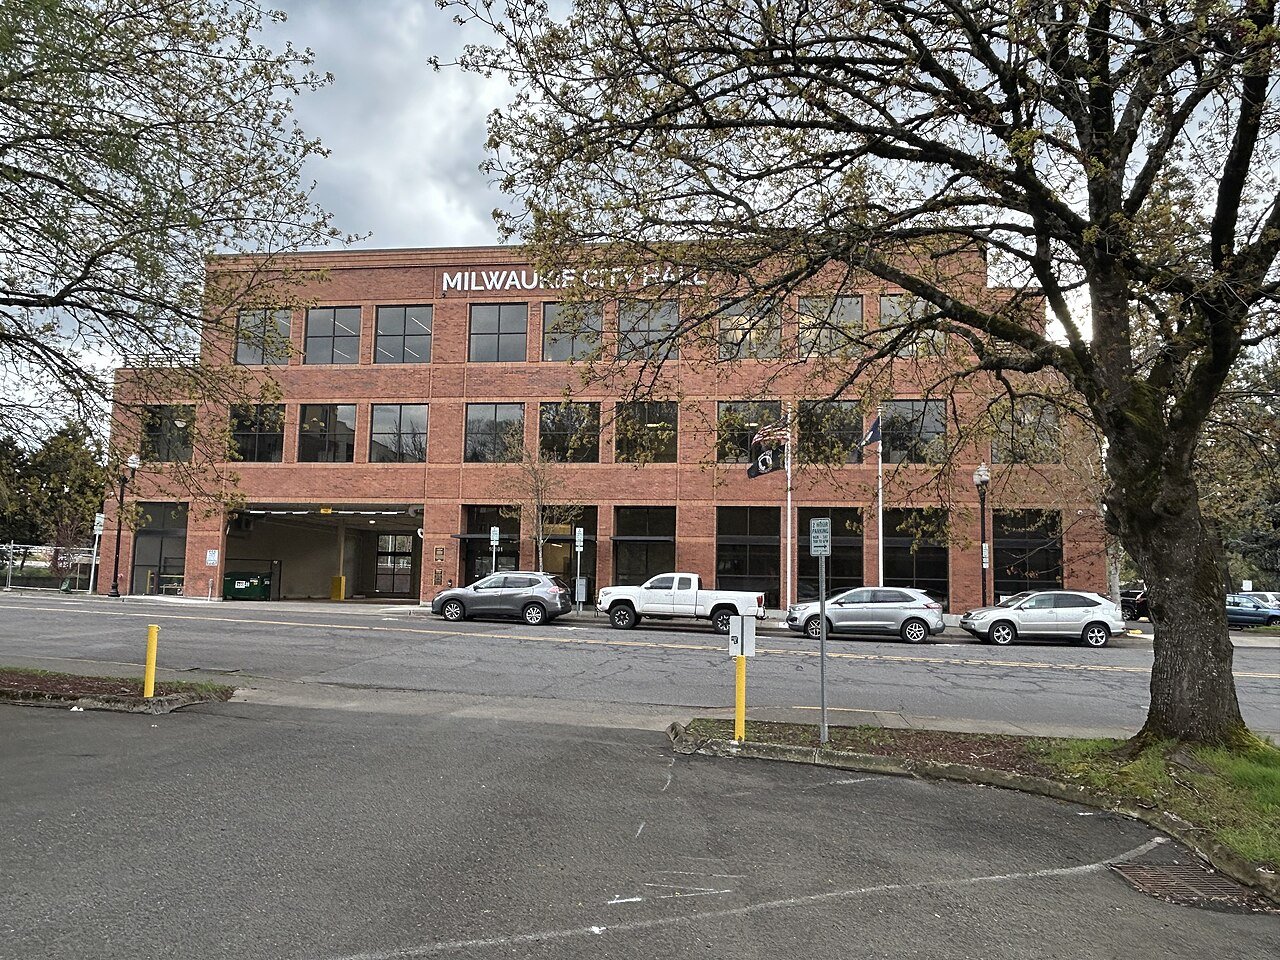
2 Milwaukie Milwaukie21,392 people 6.9 per home 828 120
3 Sherwood Sherwood20,307 people 6.1 per home 2,256 369
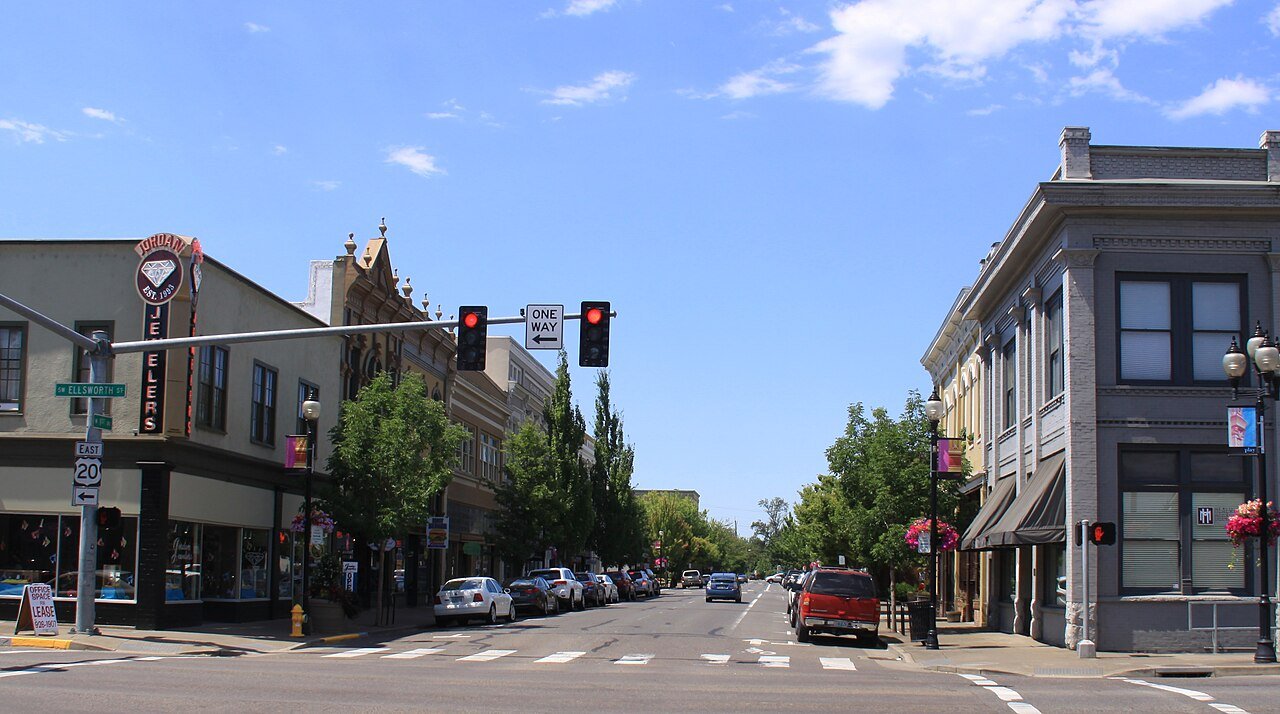
4 Lebanon Lebanon19,344 people 5.8 per home 2,929 508
5 Fairview Fairview10,735 people 5.6 per home 1,504 267
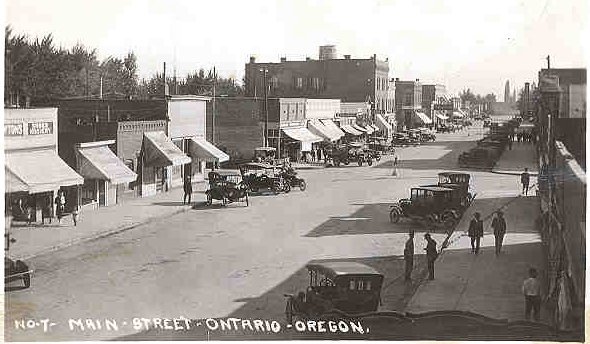
6 Ontario Ontario11,842 people 5.5 per home 279 51
7 Monmouth Monmouth11,428 people 5.3 per home 1,576 295
8 North Bend North Bend10,171 people 5.2 per home 622 119
9 Tualatin Tualatin27,763 people 5.1 per home 1,888 367
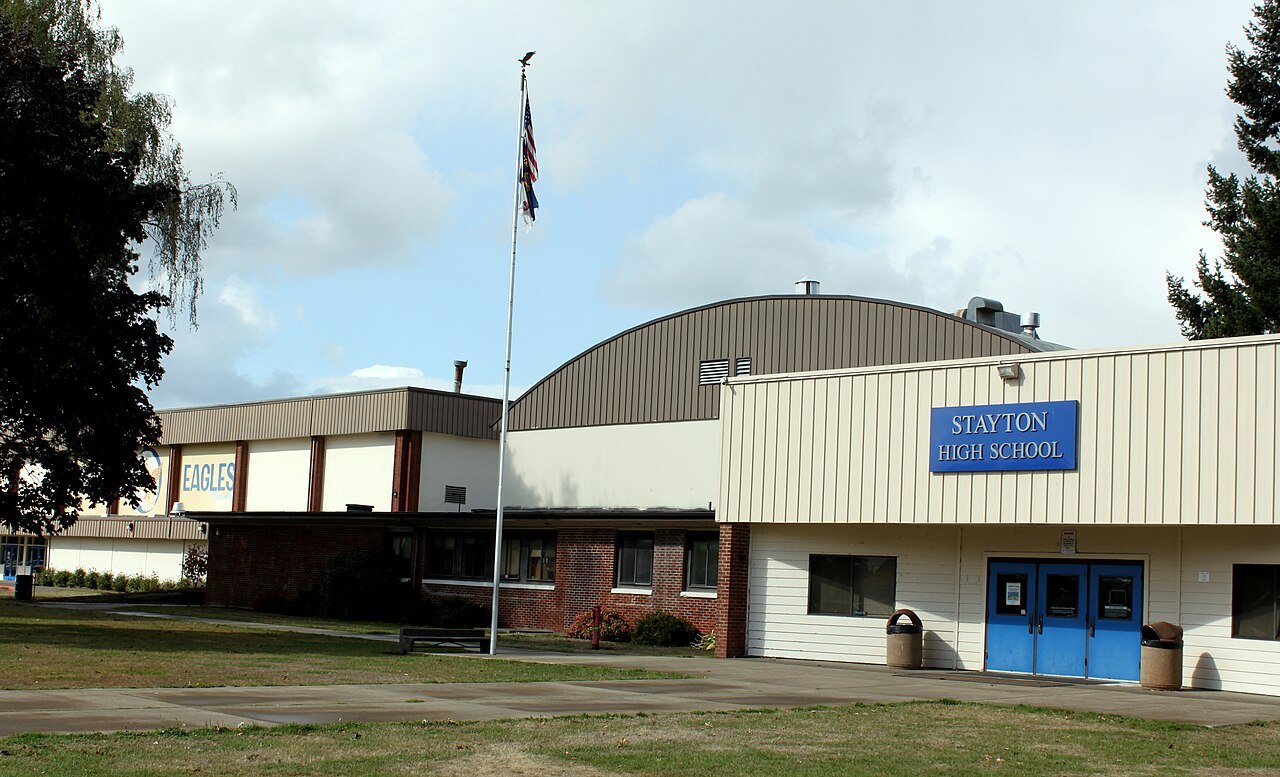
10 Stayton Stayton8,292 people 5.0 per home 600 119
11 Newberg Newberg26,066 people 5.0 per home 3,070 614
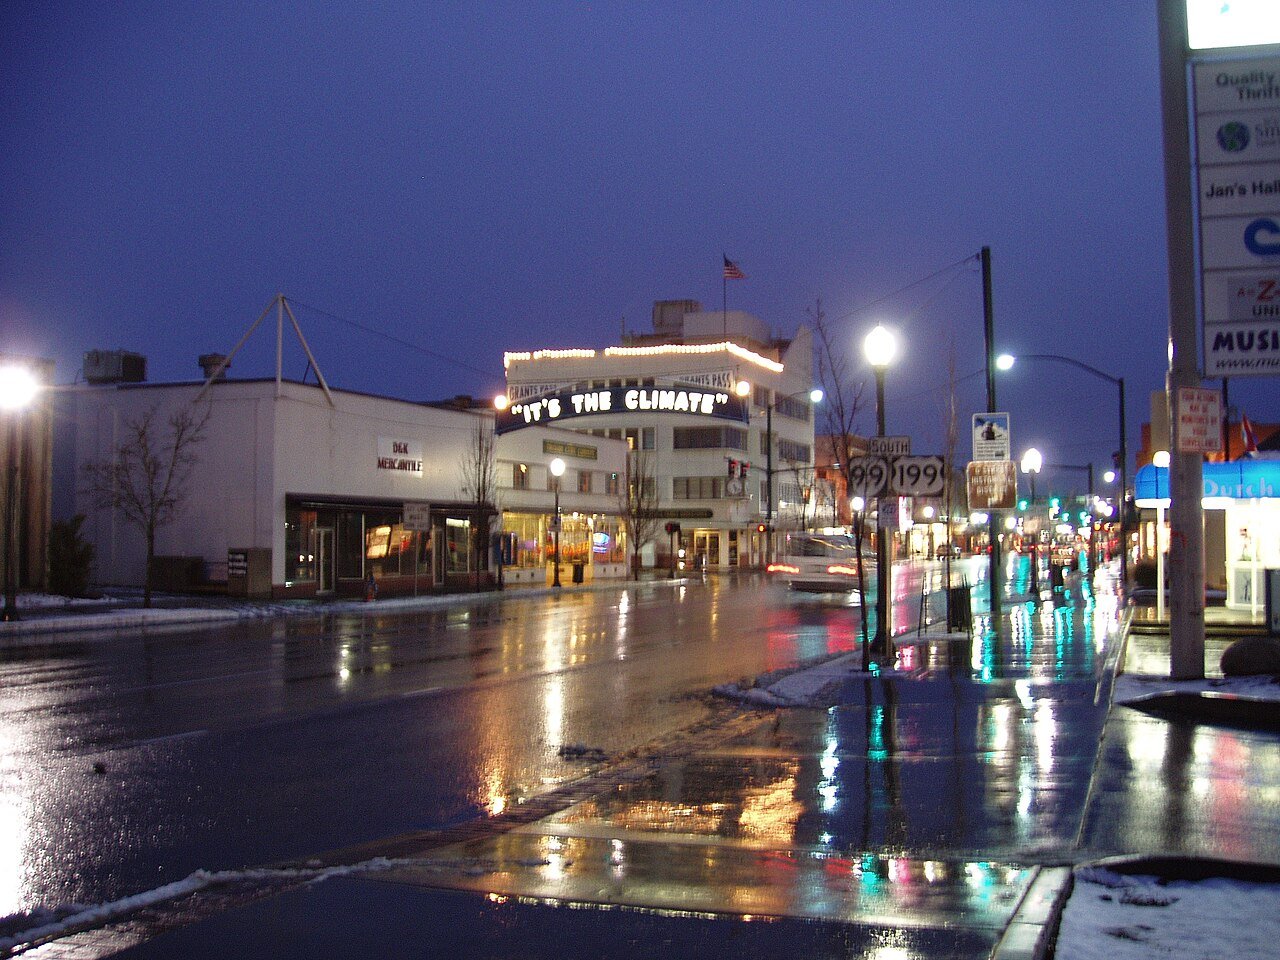
12 Grants Pass Grants Pass39,311 people 4.9 per home 4,656 957
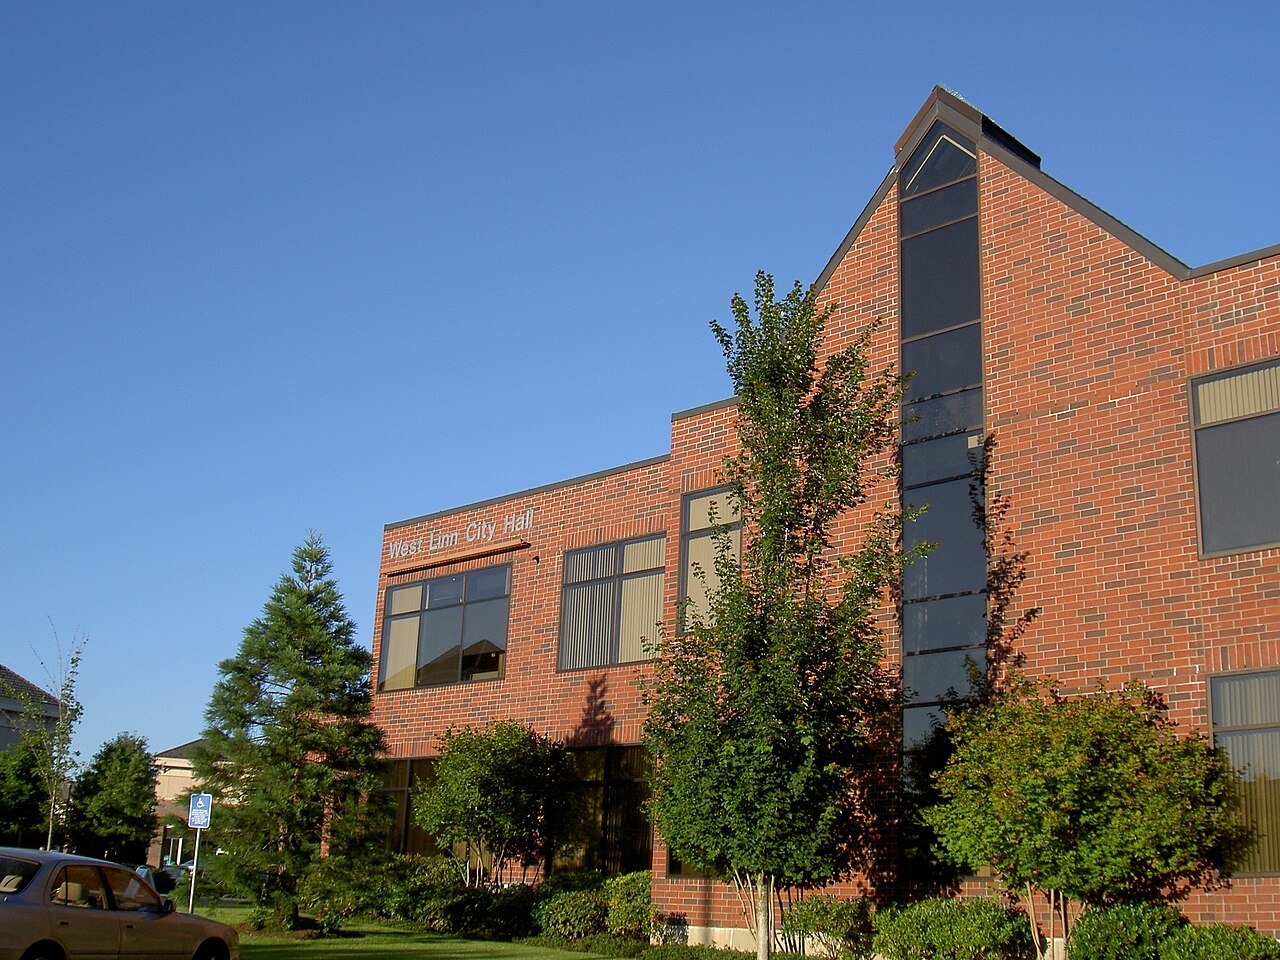
13 West Linn West Linn26,935 people 4.9 per home 2,264 467
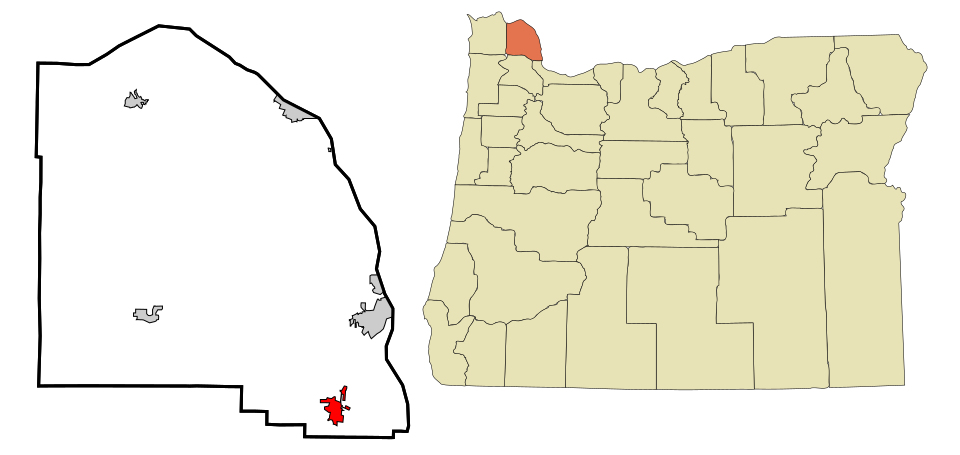
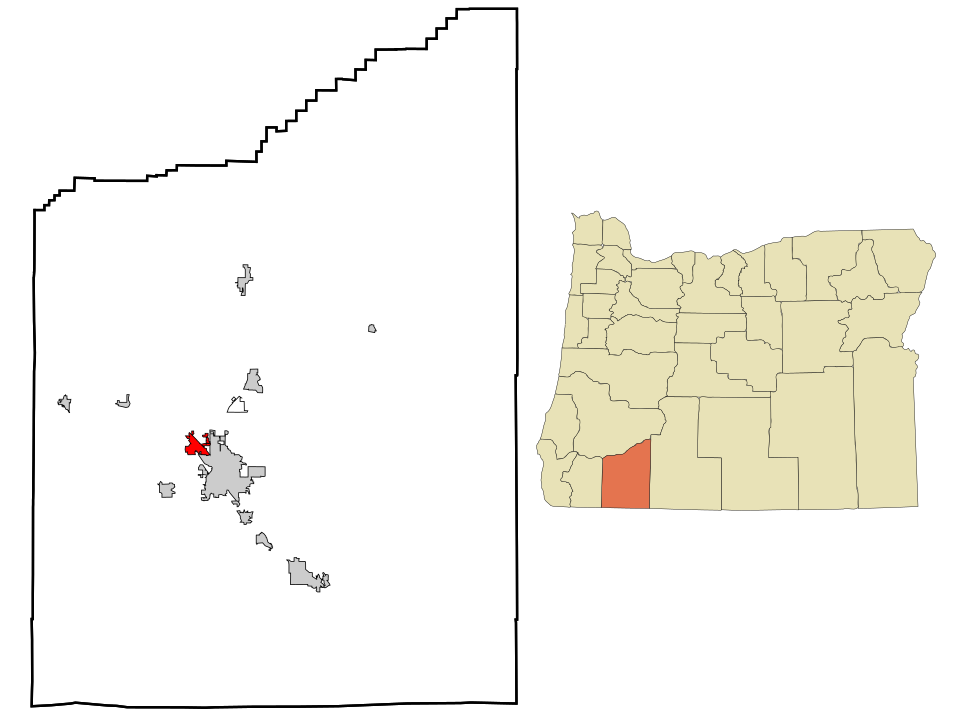
14 Map of Scappoose Scappoose8,179 people 4.6 per home 1,418 307
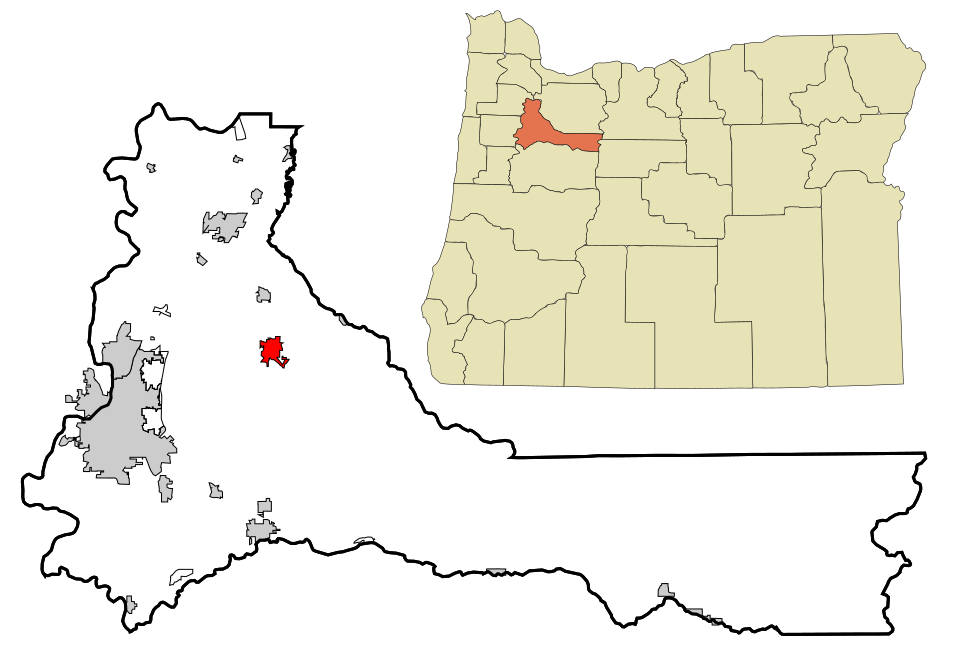
15 Woodburn Woodburn27,875 people 4.6 per home 1,933 420
16 Sandy Sandy12,854 people 4.6 per home 3,042 661
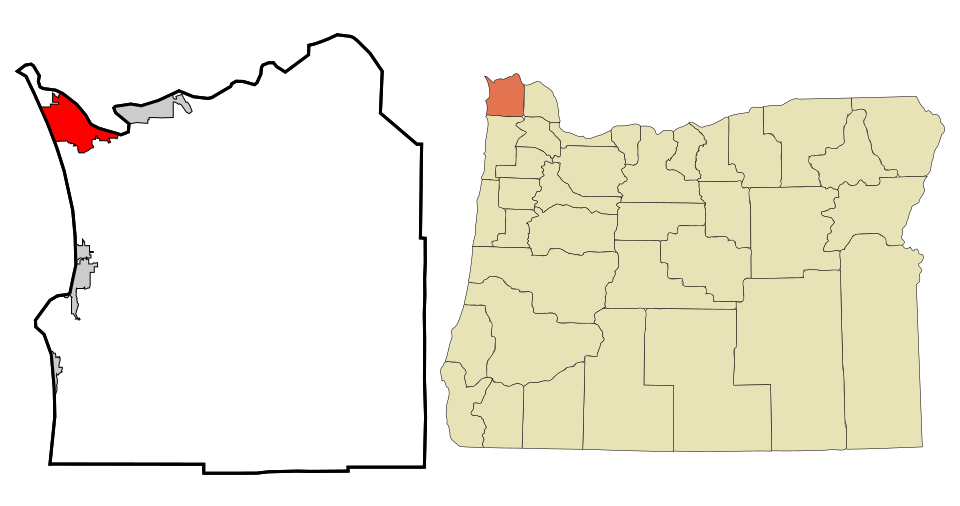
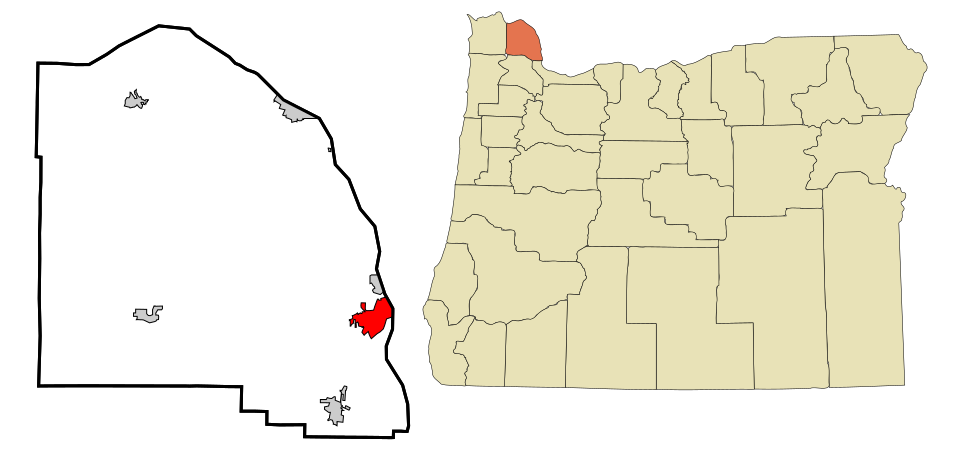
17 Map of Warrenton Warrenton6,327 people 4.6 per home 1,288 282
18 Junction City Junction City6,947 people 4.5 per home 1,395 311
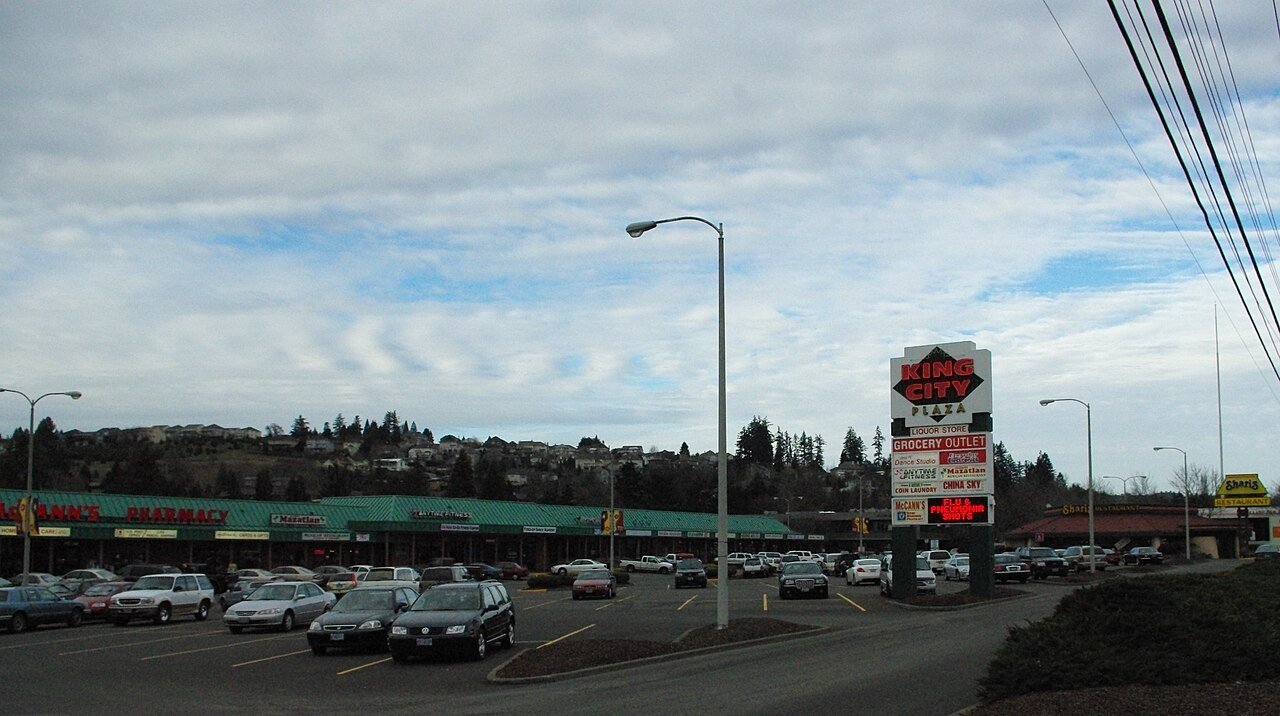
19 King City King City5,073 people 4.4 per home 2,073 469
20 Hermiston Hermiston19,546 people 4.4 per home 2,609 593
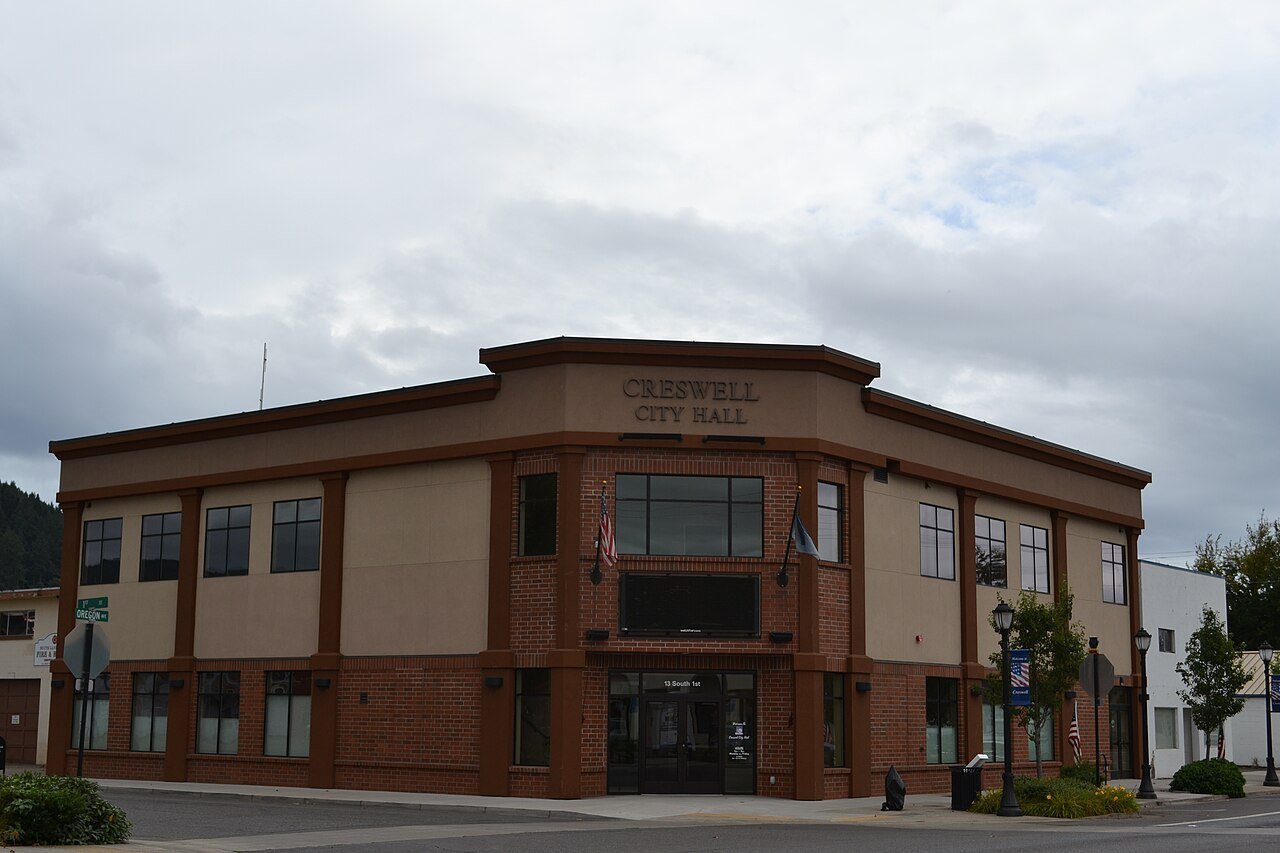
21 Creswell Creswell5,621 people 4.2 per home 610 144
22 Veneta Veneta5,200 people 4.2 per home 653 155
23 Florence Florence9,482 people 3.9 per home 930 237
24 Keizer Keizer39,082 people 3.9 per home 2,898 745
25 Cottage Grove Cottage Grove10,698 people 3.8 per home 888 232
26 Gresham Gresham112,378 people 3.8 per home 8,653 2,275
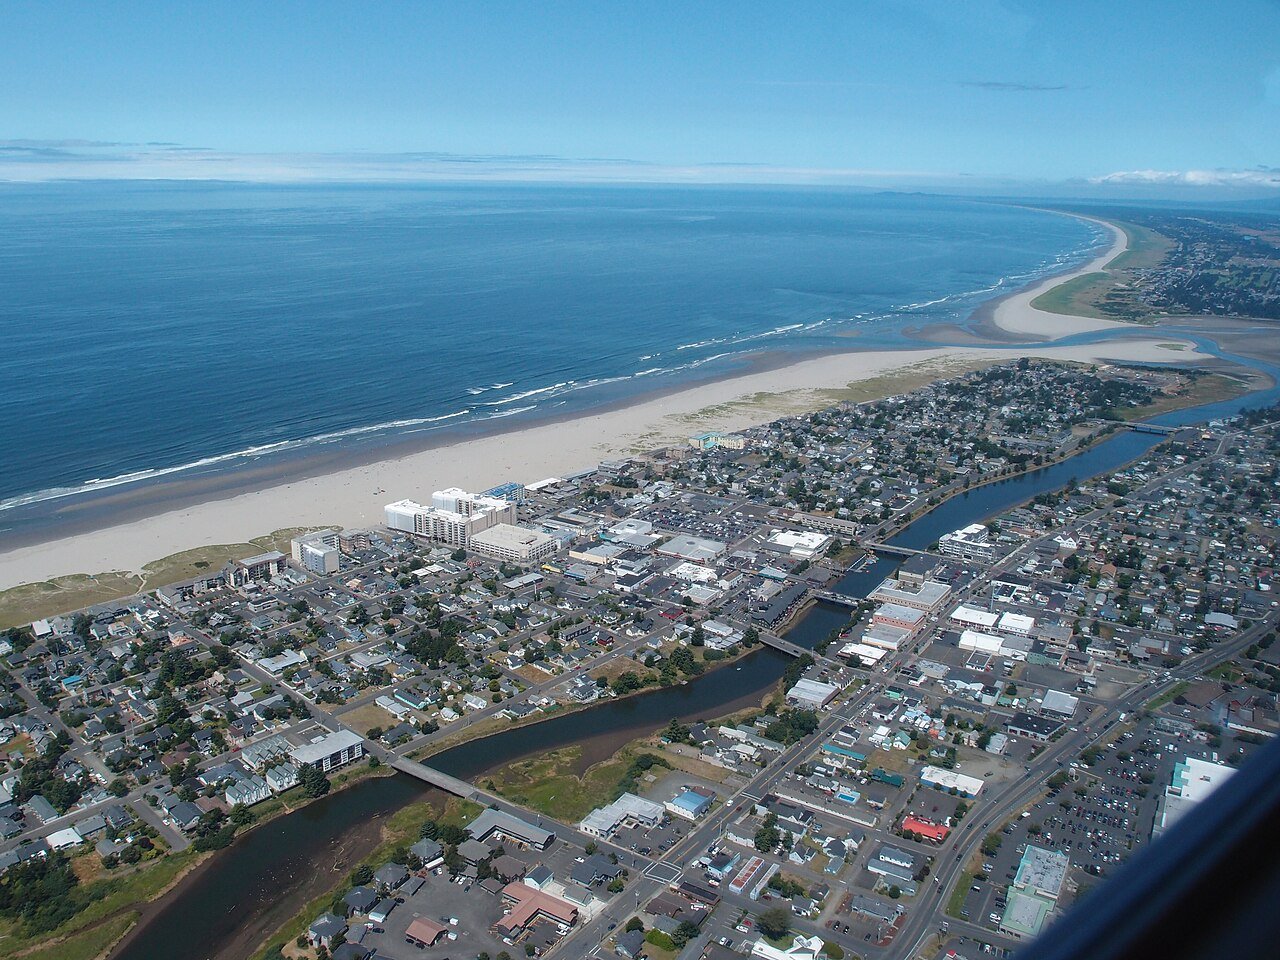
27 Seaside Seaside7,192 people 3.8 per home 658 174
28 Sweet Home Sweet Home10,078 people 3.8 per home 903 240
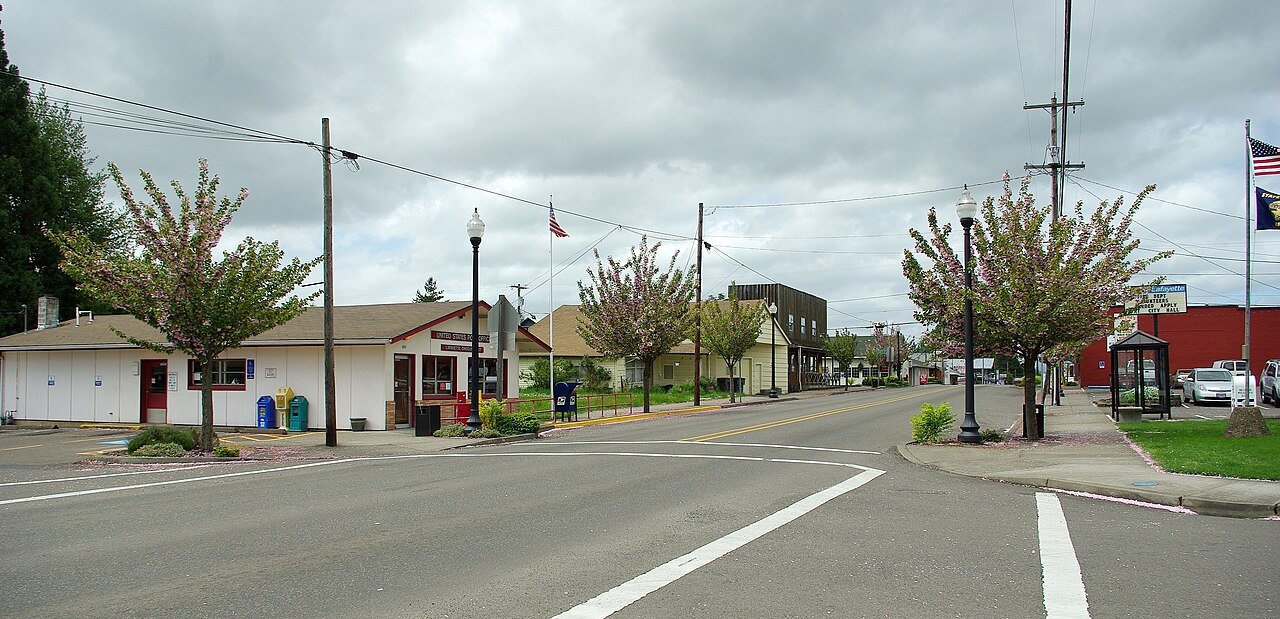
29 Lafayette Lafayette4,490 people 3.8 per home 681 181
30 Forest Grove Forest Grove26,529 people 3.7 per home 5,142 1,380
31 Lincoln City Lincoln City9,968 people 3.6 per home 1,885 523
32 Salem Salem178,865 people 3.6 per home 20,898 5,850
33 Cornelius Cornelius14,255 people 3.6 per home 825 232
34 Happy Valley Happy Valley26,738 people 3.5 per home 9,830 2,843
35 Eugene Eugene179,591 people 3.4 per home 20,469 6,031
36 Medford Medford86,315 people 3.3 per home 10,917 3,358
37 Albany Albany56,839 people 3.3 per home 6,314 1,944
38 Lake Oswego Lake Oswego40,381 people 3.3 per home 4,112 1,266
39 Brookings Brookings6,703 people 3.2 per home 408 126
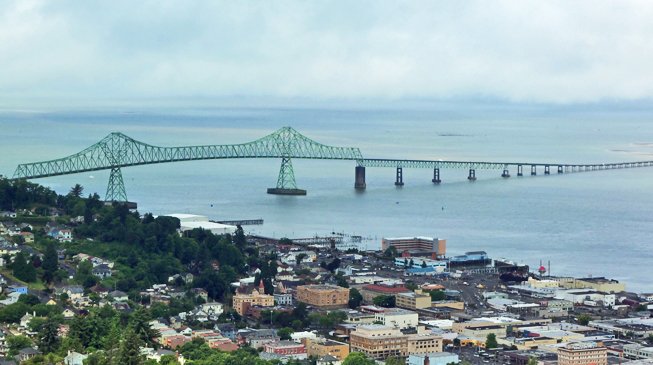
40 Astoria Astoria10,109 people 3.1 per home 704 224
41 Wilsonville Wilsonville26,974 people 3.0 per home 7,155 2,355
42 Map of Silverton Silverton10,456 people 2.9 per home 1,262 434
43 Dallas Dallas17,531 people 2.9 per home 2,271 787
44 Oregon City Oregon City37,755 people 2.9 per home 5,713 2,006
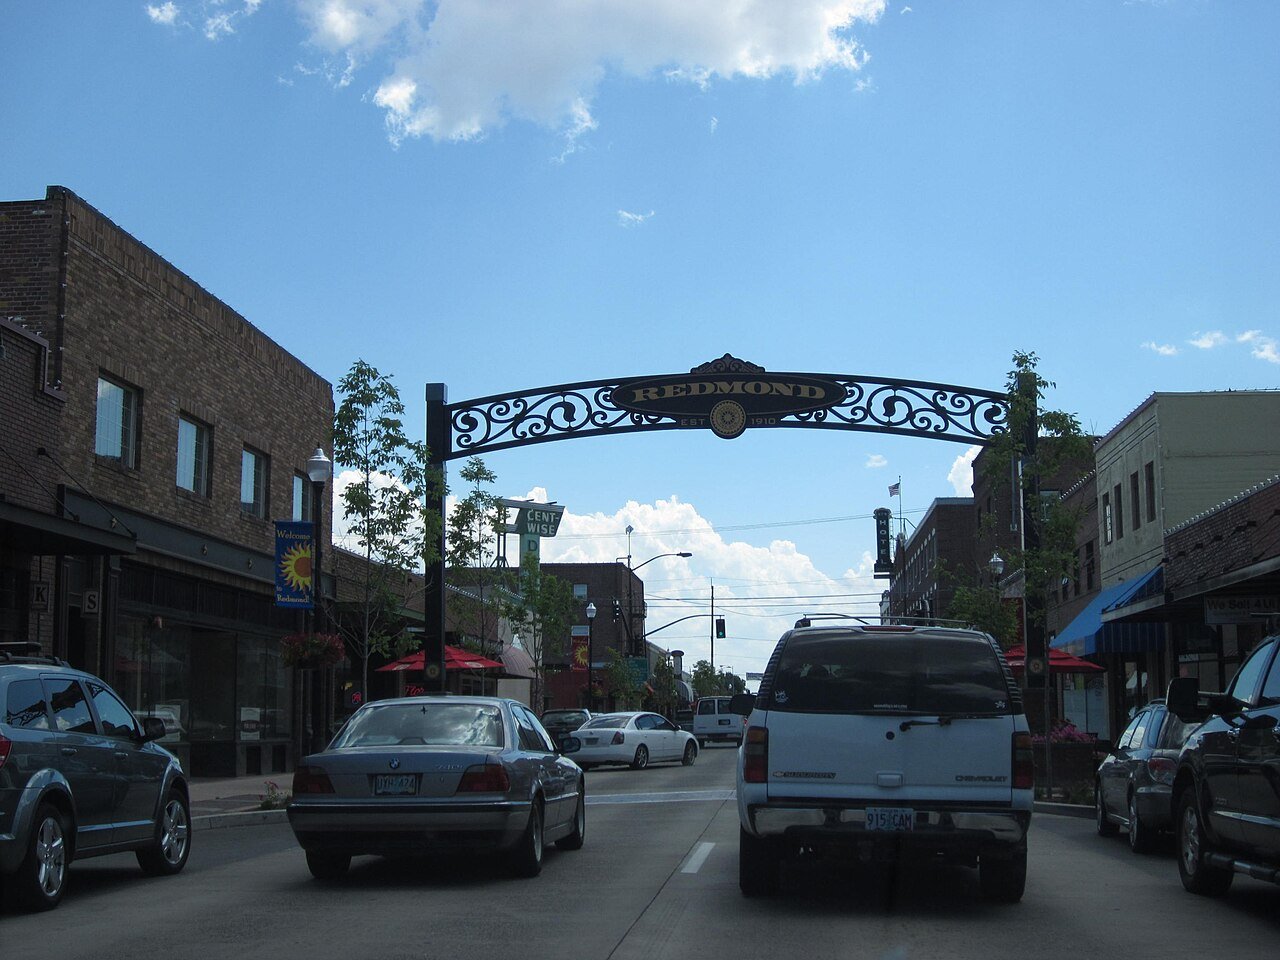
45 Redmond Redmond36,092 people 2.8 per home 7,059 2,507
46 Boardman Boardman4,064 people 2.8 per home 608 216
47 Map of Central Point Central Point19,216 people 2.7 per home 1,828 671
48 Map of St. Helens St. Helens14,258 people 2.7 per home 934 347
49 Estacada5,152 people 2.7 per home 1,661 617
50 Springfield Springfield61,499 people 2.7 per home 2,448 918
51 Eagle Point Eagle Point9,839 people 2.6 per home 1,217 461
52 Bend Bend103,390 people 2.6 per home 22,539 8,690
53 Umatilla Umatilla7,508 people 2.6 per home 457 177
54 Beaverton Beaverton97,812 people 2.3 per home 7,691 3,280
55 Ashland Ashland21,259 people 2.3 per home 1,282 551
56 Hood River Hood River8,361 people 2.3 per home 1,146 493
57 Pendleton Pendleton16,950 people 2.2 per home 495 227
58 Hillsboro Hillsboro108,231 people 2.2 per home 14,836 6,844
59 Tigard Tigard56,011 people 2.1 per home 6,504 3,073
60 Prineville Prineville11,470 people 2.1 per home 1,483 701
61 Map of Independence Independence10,199 people 1.9 per home 1,238 642
62 Philomath Philomath5,642 people 1.7 per home 766 440
63 McMinnville McMinnville34,596 people 1.7 per home 2,132 1,233
64 Map of Portland Portland641,165 people 1.7 per home 68,727 40,404
65 Troutdale Troutdale15,923 people 1.6 per home 338 214
66 Baker City Baker City10,210 people 1.1 per home 271 253
67 Newport Newport10,583 people 0.8 per home 267 334

How this ranking works

We take each town’s population change between the 2010 and 2020 censuses and divide it by the new homes its building permits authorized over 2010–2019. The result is how many new residents arrived for every new home. A high number means people came faster than homes were built, so existing homes filled up: larger households, fewer vacancies and tighter supply. The highest ratio ranks #1. Across Oregon it’s 2.6 per home.

Only towns that gained at least 250 residents and permitted at least 10 homes are ranked, because a ratio built on a handful of either is noise. College towns, where 20% or more of residents are enrolled in college, are left out: a growing college adds dorm students as residents, but dorms never show up as permitted homes.

Only towns with at least 2,500 residents are ranked; Census estimates for smaller places are too uncertain. Population and income: U.S. Census Bureau American Community Survey 5-year estimates. New homes: U.S. Census Bureau Building Permits Survey. Residents: 2010 and 2020 decennial censuses. Town photos: Wikimedia Commons, credited on each town’s page.

Same ranking in other states