OKOklahoma rankings

Towns where housing hasn't kept up with growth in Oklahoma

Ranked by how many new residents each town gained for every new home it permitted between the 2010 and 2020 censuses. 49 towns with 2,500+ residents.
U.S. Census ACS 2020–2024 5-year

#TownNew residents per new homeResidents gainedHomes permitted
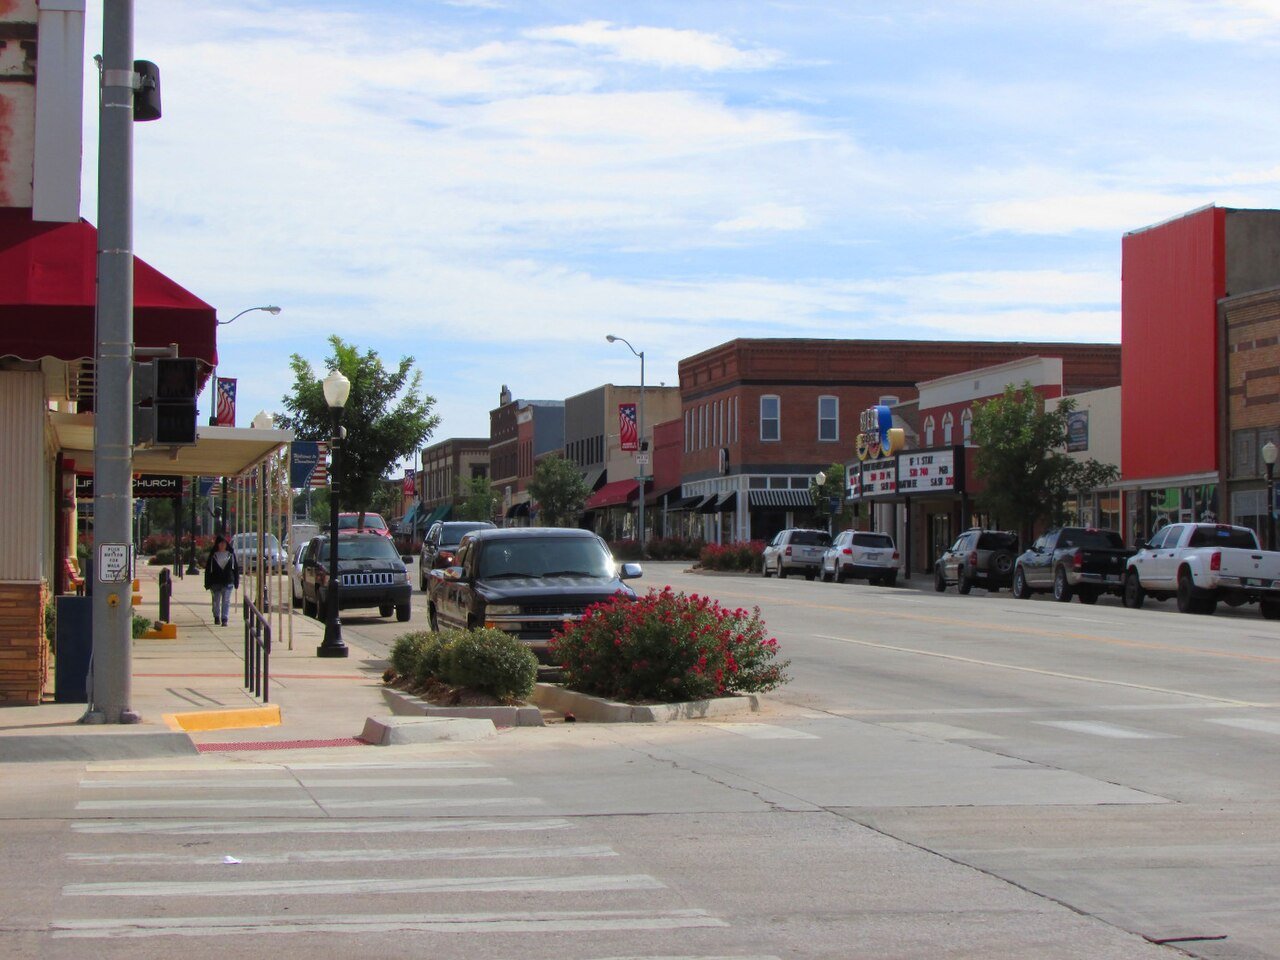
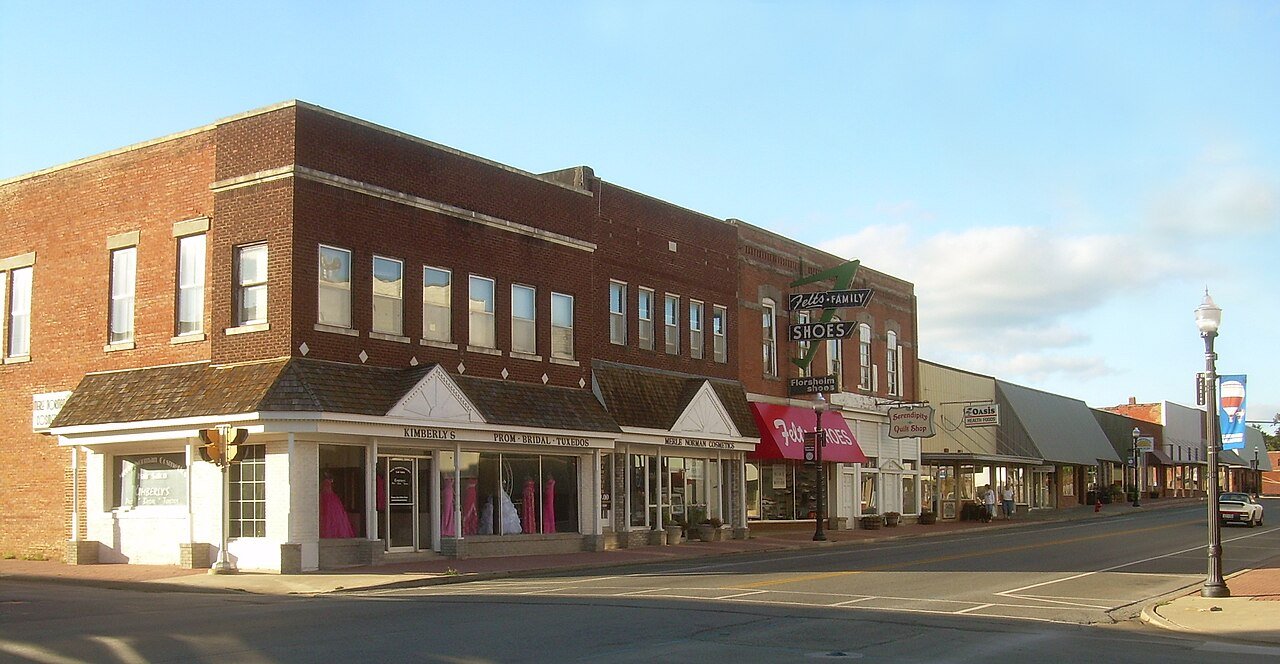
1 Map of Guymon Guymon12,539 people 41.2 per home 1,523 37
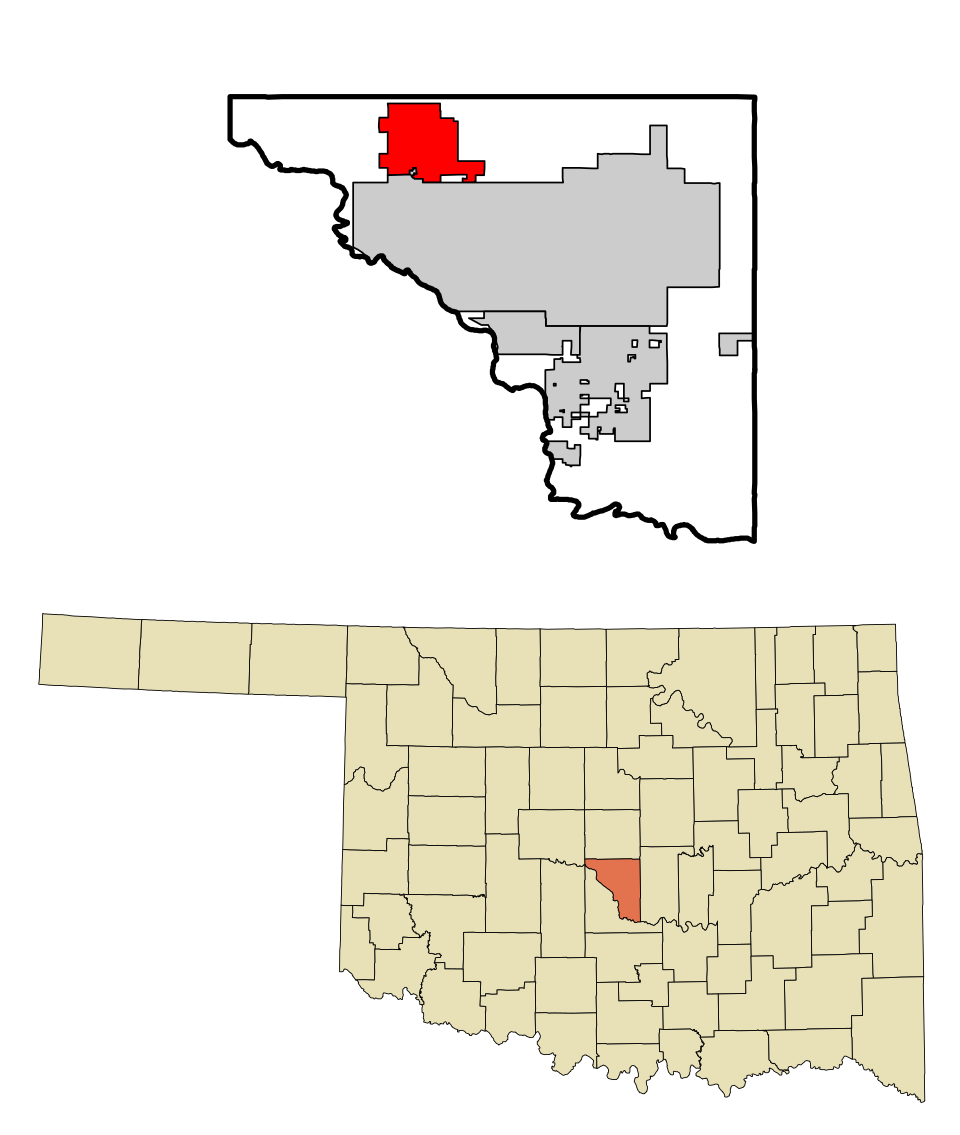
2 Map of Hinton Hinton4,909 people 30.2 per home 1,721 57
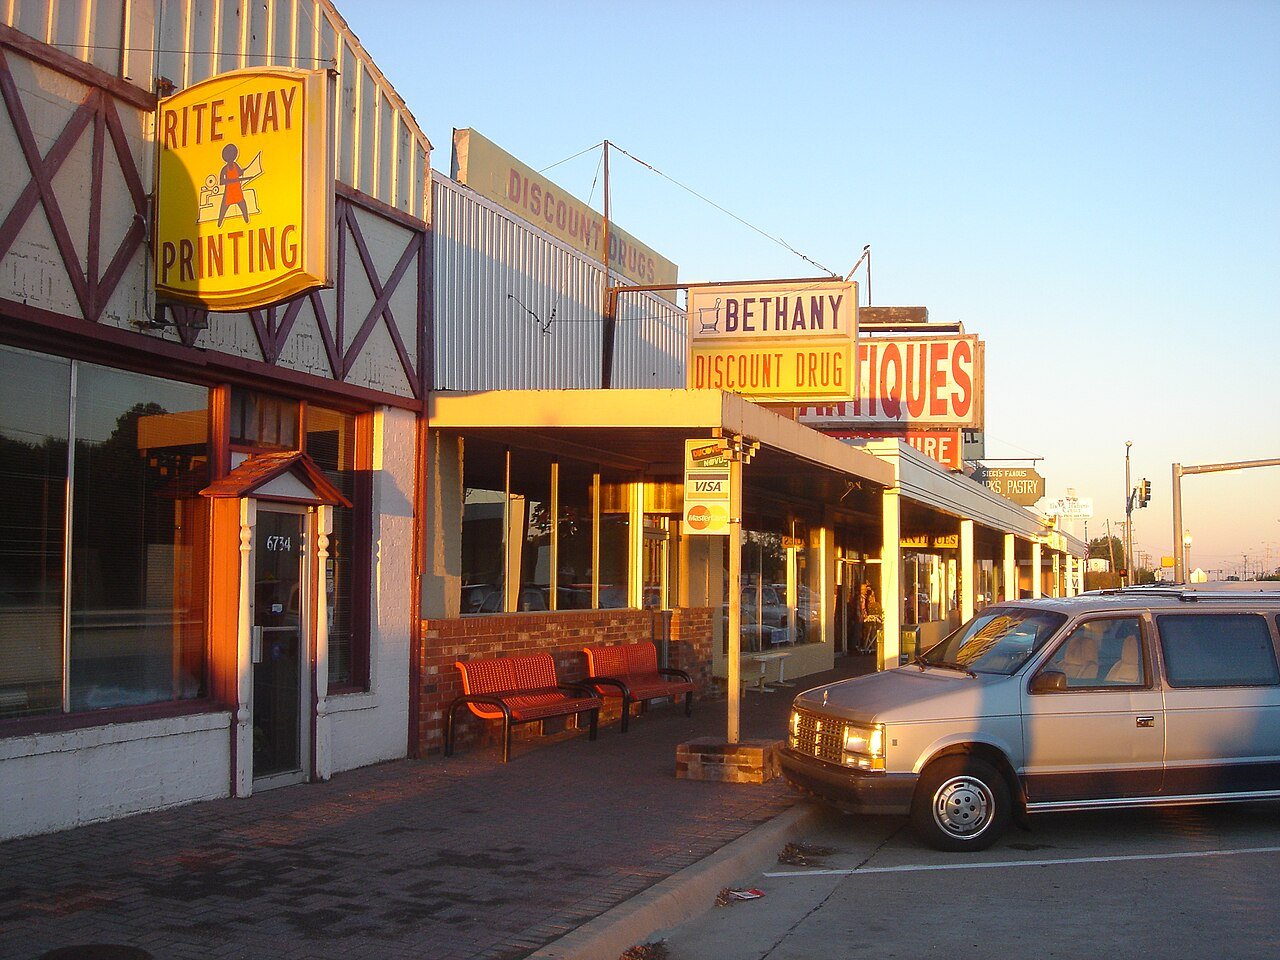
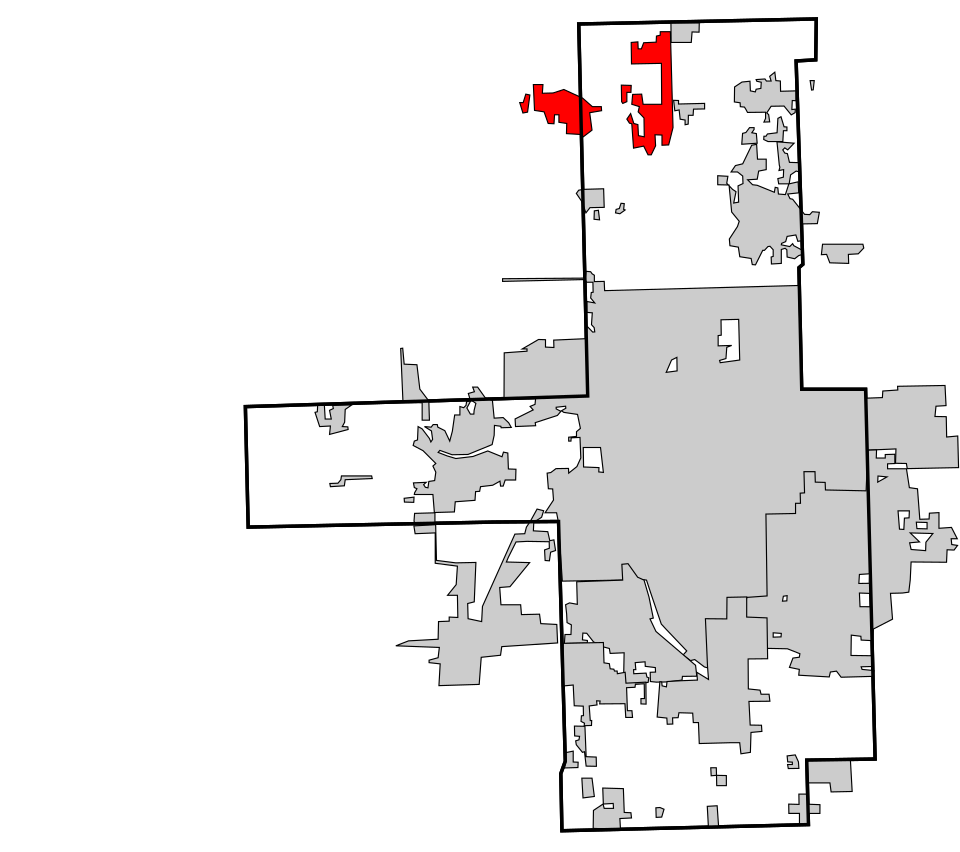
3 Bethany Bethany20,560 people 28.3 per home 1,780 63
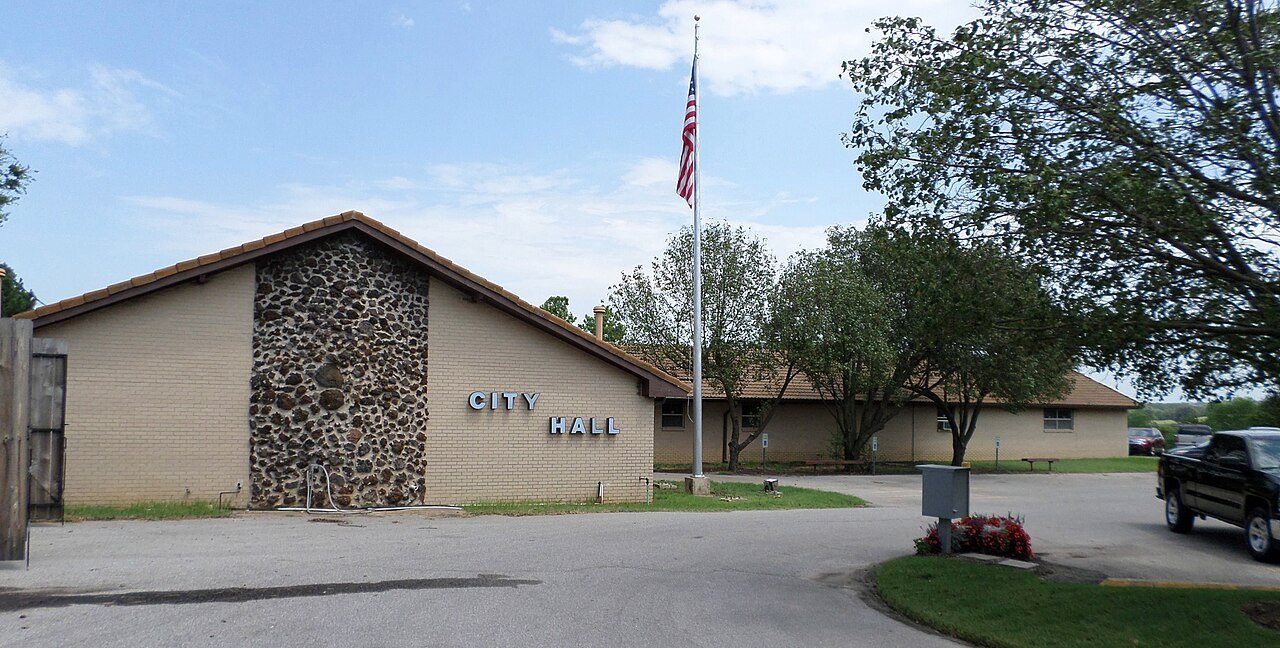
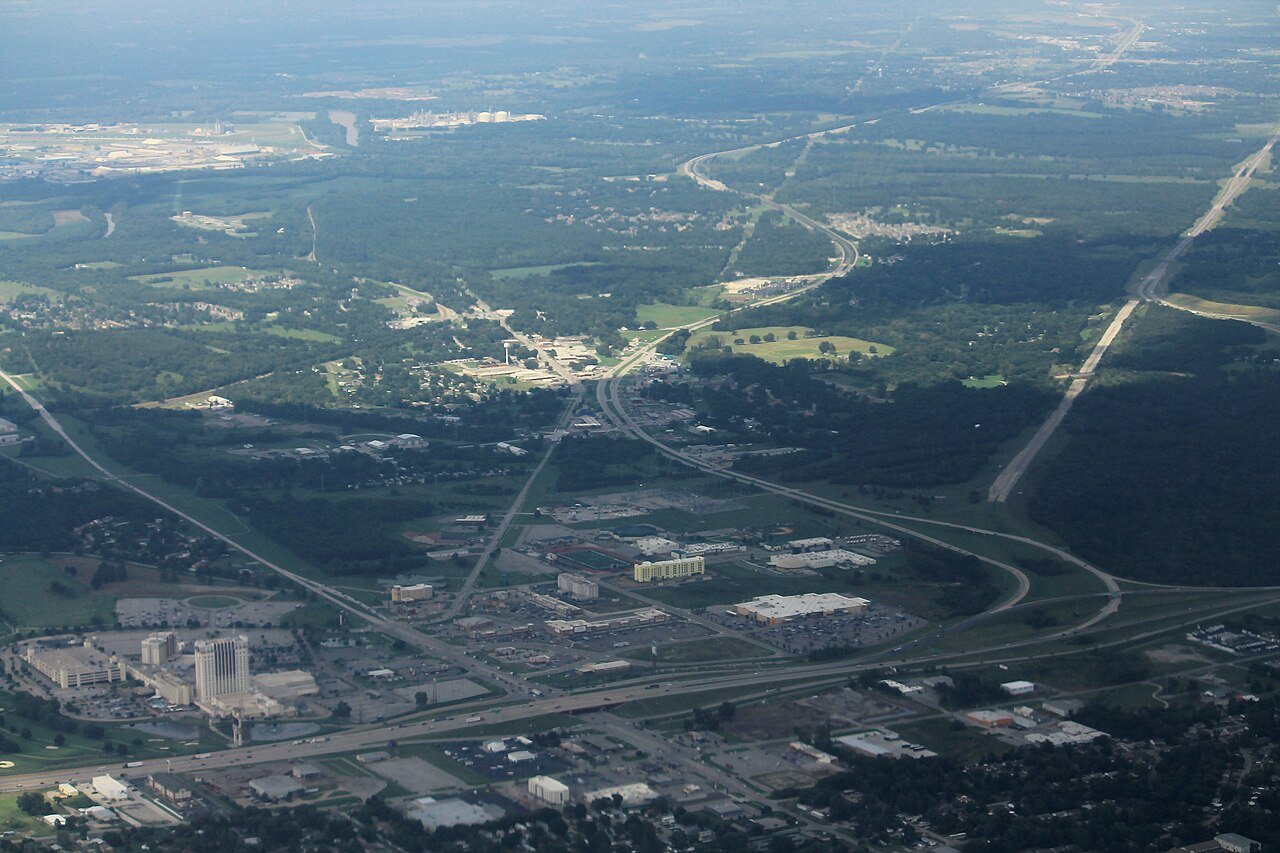
4 Catoosa Catoosa7,496 people 10.0 per home 289 29
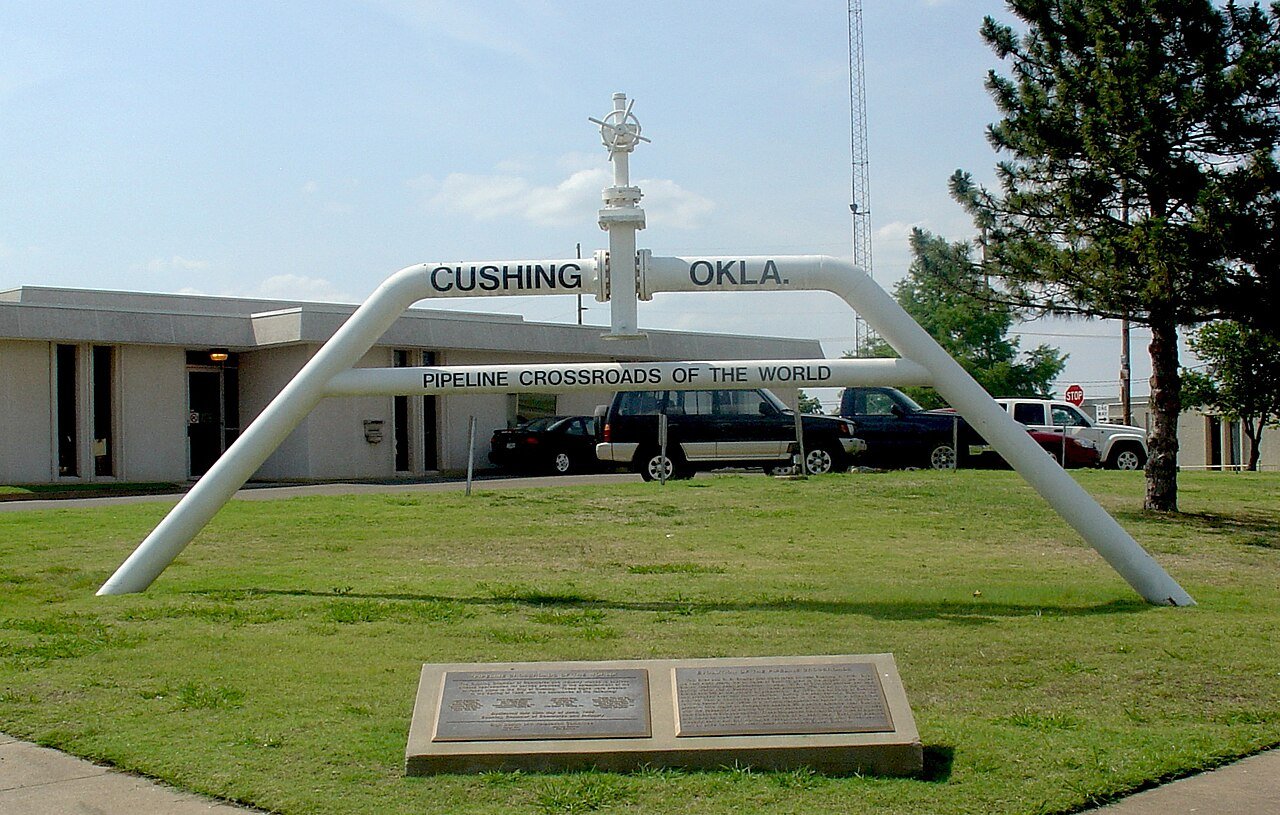
5 Cushing Cushing8,367 people 9.8 per home 501 51
6 Purcell Purcell6,803 people 5.2 per home 767 149
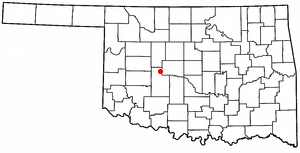
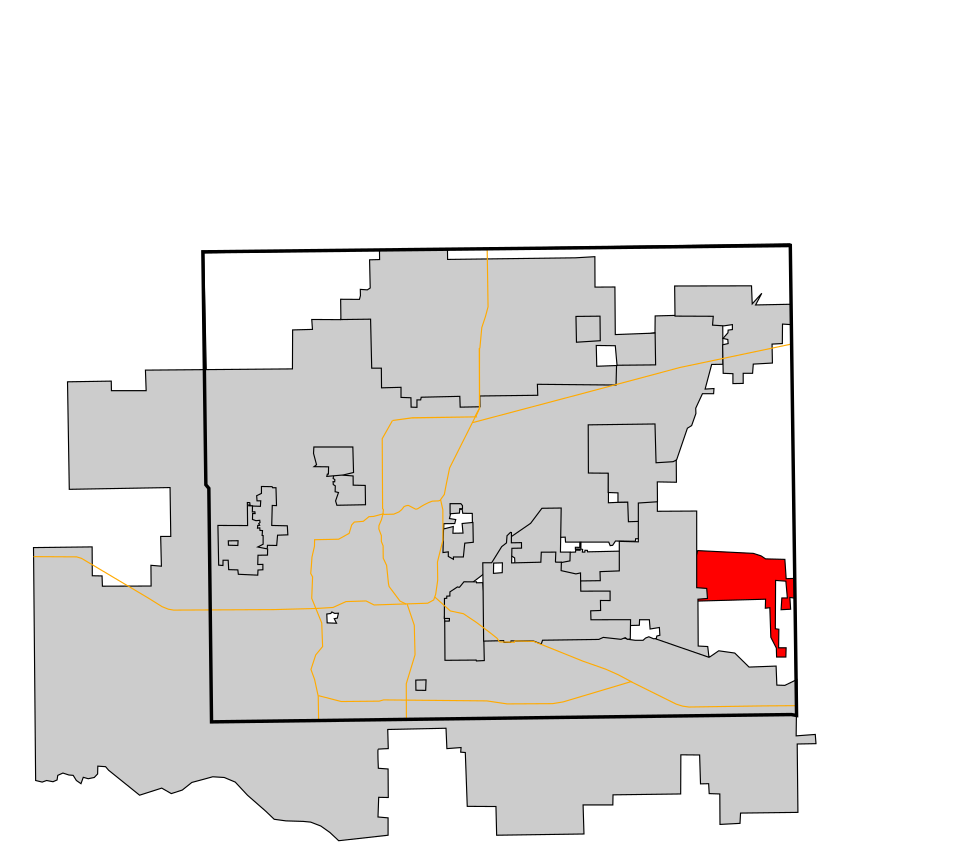
7 Map of Warr Acres Warr Acres10,466 people 4.9 per home 409 84
8 Map of Del City Del City21,494 people 4.2 per home 490 118
9 Map of Kiefer Kiefer2,639 people 3.7 per home 502 135
10 Enid Enid50,653 people 3.7 per home 1,929 522
11 McLoud4,425 people 3.3 per home 307 92
12 Map of Midwest City Midwest City58,297 people 3.3 per home 4,038 1,216
13 Jenks Jenks27,102 people 3.3 per home 9,025 2,739
14 Oklahoma City Oklahoma City697,125 people 3.3 per home 101,055 30,816
15 Map of Goldsby Goldsby3,085 people 3.2 per home 893 282
16 Map of Owasso Owasso40,151 people 3.1 per home 9,325 2,983
17 Verdigris Verdigris5,637 people 3.0 per home 1,263 415
18 Map of Elgin Elgin3,608 people 3.0 per home 1,500 497
19 Broken Arrow Broken Arrow118,180 people 2.9 per home 14,690 5,102
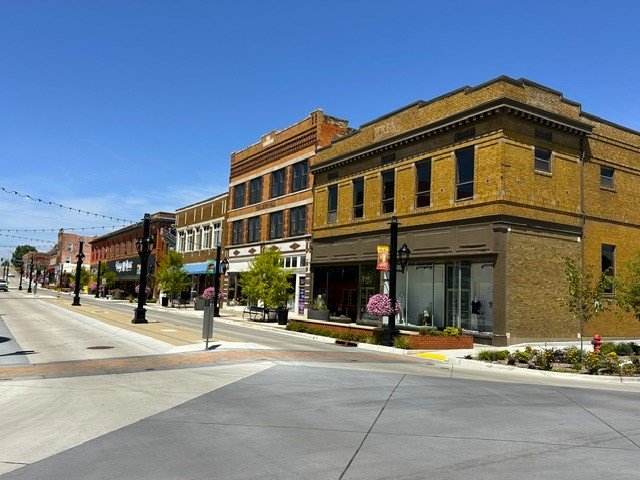
20 Map of Collinsville Collinsville8,878 people 2.7 per home 2,275 829
21 Durant Durant19,746 people 2.7 per home 2,733 1,014
22 Map of Bixby Bixby30,155 people 2.6 per home 7,725 2,926
23 Map of Piedmont Piedmont8,342 people 2.6 per home 1,682 636
24 Map of Edmond Edmond96,825 people 2.6 per home 13,023 5,113
25 Map of Tuttle Tuttle8,040 people 2.6 per home 1,394 547
26 Glenpool Glenpool14,151 people 2.5 per home 2,883 1,144
27 Map of Sayre Sayre4,796 people 2.5 per home 434 175
28 Map of Guthrie Guthrie11,243 people 2.5 per home 558 228
29 Tulsa Tulsa413,794 people 2.4 per home 21,160 8,770
30 Map of Mustang Mustang22,192 people 2.4 per home 2,484 1,046
31 Map of Norman Norman129,672 people 2.2 per home 17,101 7,655
32 Map of Newcastle Newcastle13,001 people 2.2 per home 3,299 1,481
33 Bartlesville Bartlesville37,878 people 2.1 per home 1,540 729
34 Kingfisher Kingfisher5,026 people 2.1 per home 270 132
35 Map of Moore Moore63,420 people 2.0 per home 7,712 3,776
36 Map of Skiatook Skiatook8,632 people 2.0 per home 1,053 518
37 Map of Harrah Harrah6,684 people 1.9 per home 1,150 610
38 Choctaw Choctaw12,303 people 1.9 per home 1,036 551
39 Shawnee Shawnee31,671 people 1.7 per home 1,520 878
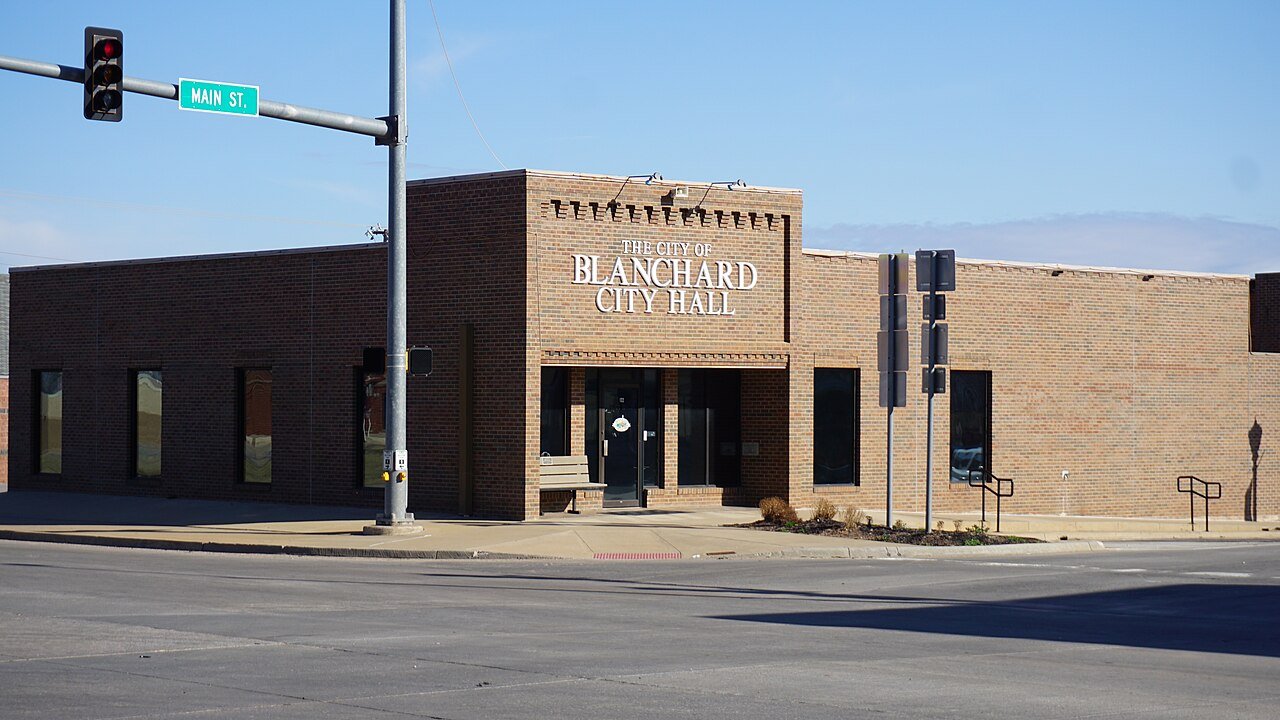
40 Blanchard Blanchard9,215 people 1.7 per home 1,209 714
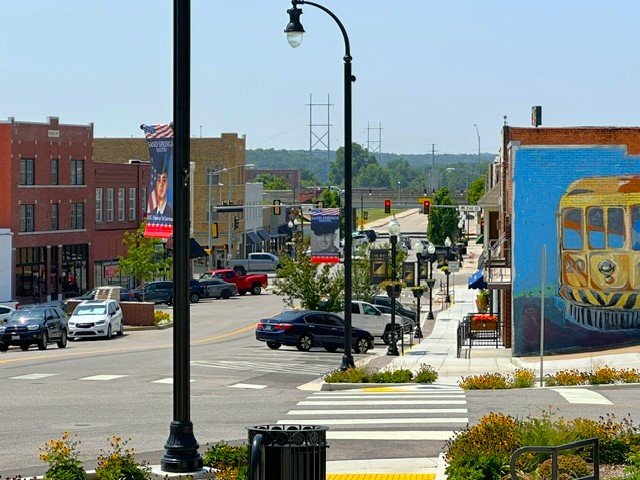
41 Sand Springs Sand Springs20,117 people 1.7 per home 968 582
42 Map of The Village The Village9,447 people 1.6 per home 609 379
43 Sapulpa Sapulpa22,570 people 1.5 per home 1,385 911
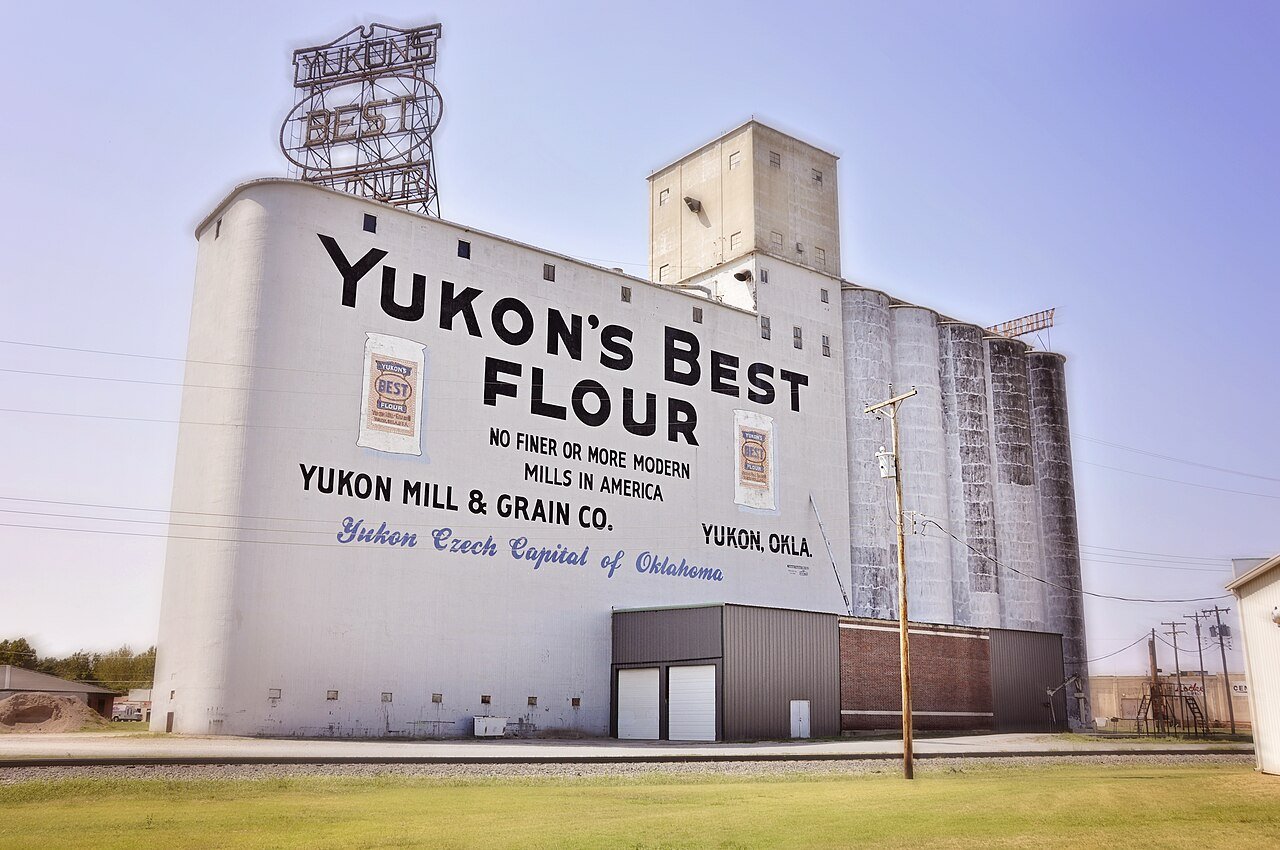
44 Yukon Yukon25,529 people 1.5 per home 921 612
45 Map of Noble Noble7,493 people 1.5 per home 504 346
46 Map of Grove Grove7,176 people 1.0 per home 333 340
47 Poteau Poteau8,959 people 0.7 per home 287 424
48 Ardmore Ardmore24,877 people 0.7 per home 442 680
49 Tahlequah Tahlequah16,935 people 0.6 per home 456 771

How this ranking works

We take each town’s population change between the 2010 and 2020 censuses and divide it by the new homes its building permits authorized over 2010–2019. The result is how many new residents arrived for every new home. A high number means people came faster than homes were built, so existing homes filled up: larger households, fewer vacancies and tighter supply. The highest ratio ranks #1. Across Oklahoma it’s 1.8 per home.

Only towns that gained at least 250 residents and permitted at least 10 homes are ranked, because a ratio built on a handful of either is noise. College towns, where 20% or more of residents are enrolled in college, are left out: a growing college adds dorm students as residents, but dorms never show up as permitted homes.

Only towns with at least 2,500 residents are ranked; Census estimates for smaller places are too uncertain. Population and income: U.S. Census Bureau American Community Survey 5-year estimates. New homes: U.S. Census Bureau Building Permits Survey. Residents: 2010 and 2020 decennial censuses. Town photos: Wikimedia Commons, credited on each town’s page.

Same ranking in other states