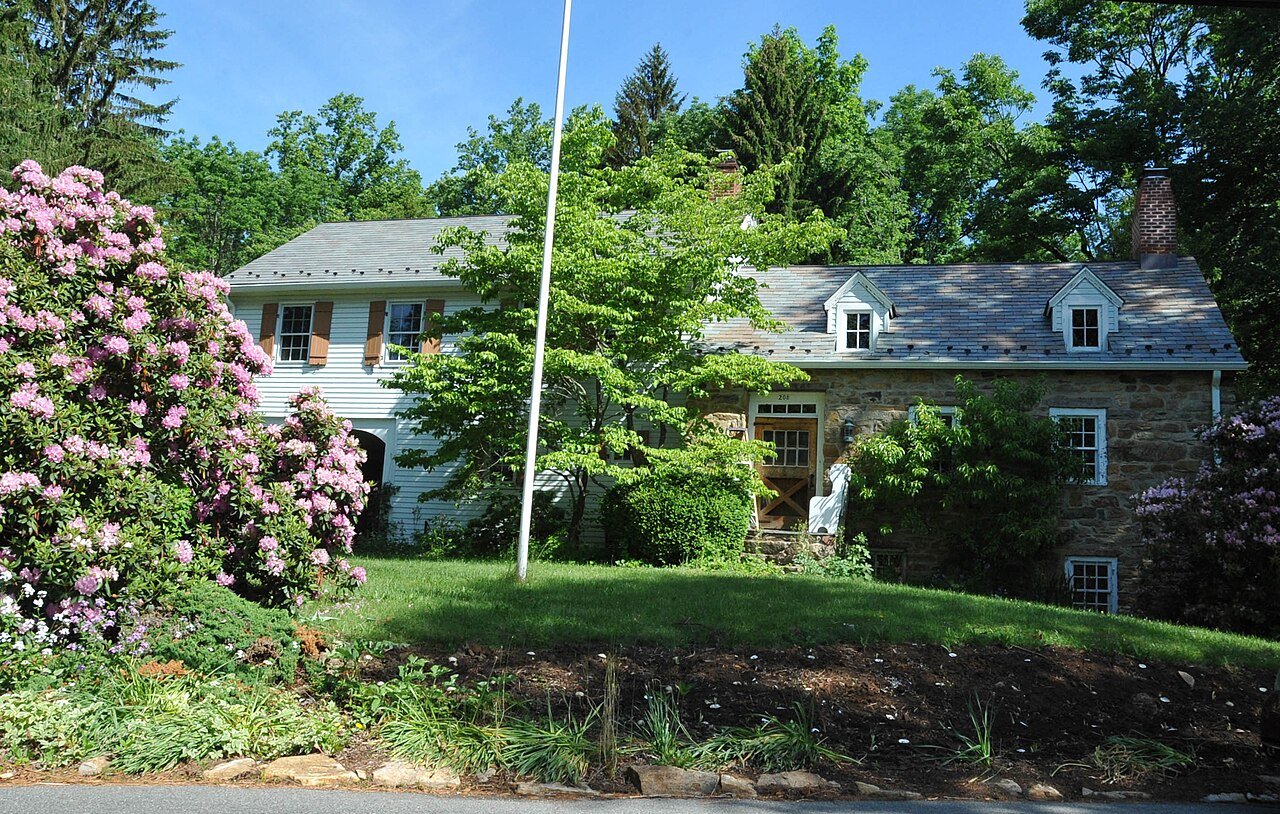
Mount Olive ranks #24 in New Jersey for trails
Mount Olive is ranked on 40 lists against the 468 New Jersey towns with 2,500+ residents. It makes the top 10 on 0 and the top quarter on 5.
Wetter than 100% of New Jersey
Not better or worse, just Mount Olive’s character, from the lists where neither end is the “good” one. The most distinctive come first.
The lists Mount Olive does best on
Each list ranks every NJ town with 2,500+ residents. Tap one to see the whole list with Mount Olive marked.
Mount Olive lands in the top half on 19 of 26 lists
Each dot is Mount Olive’s spot on one list: the left end is #1 in NJ, the right end is last. Areas where Mount Olive does best come first.
Mount Olive out-ranks 6 of its 7 ranked neighbors
Head to head on the lists where both towns are ranked: a point for each list where one town places higher. Tap a town for its own rankings.
Where Mount Olive lands in every NJ ranking
41 lists from Census, school, health, library, crime, climate and land data. Tap any list to see every town on it.
Outdoors
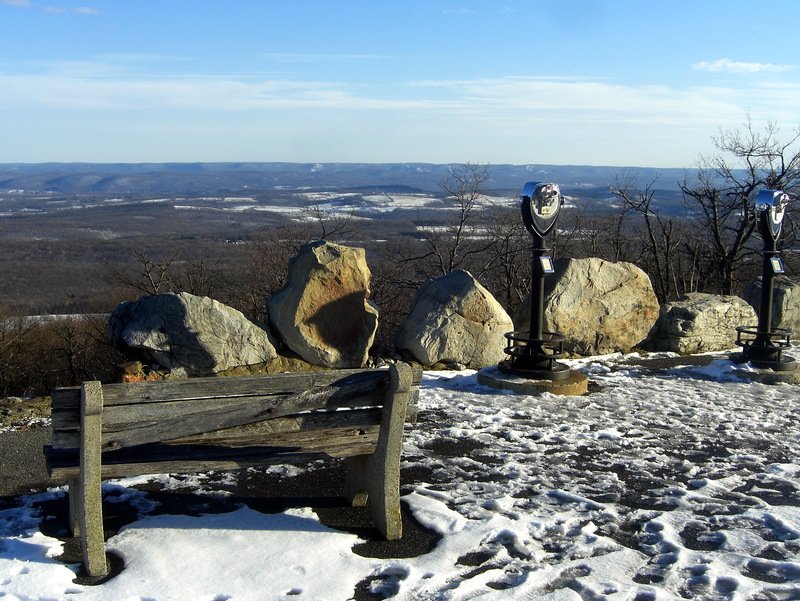 Most conserved land#1 Montague · 68.2%
#70
Most conserved land#1 Montague · 68.2%
#70
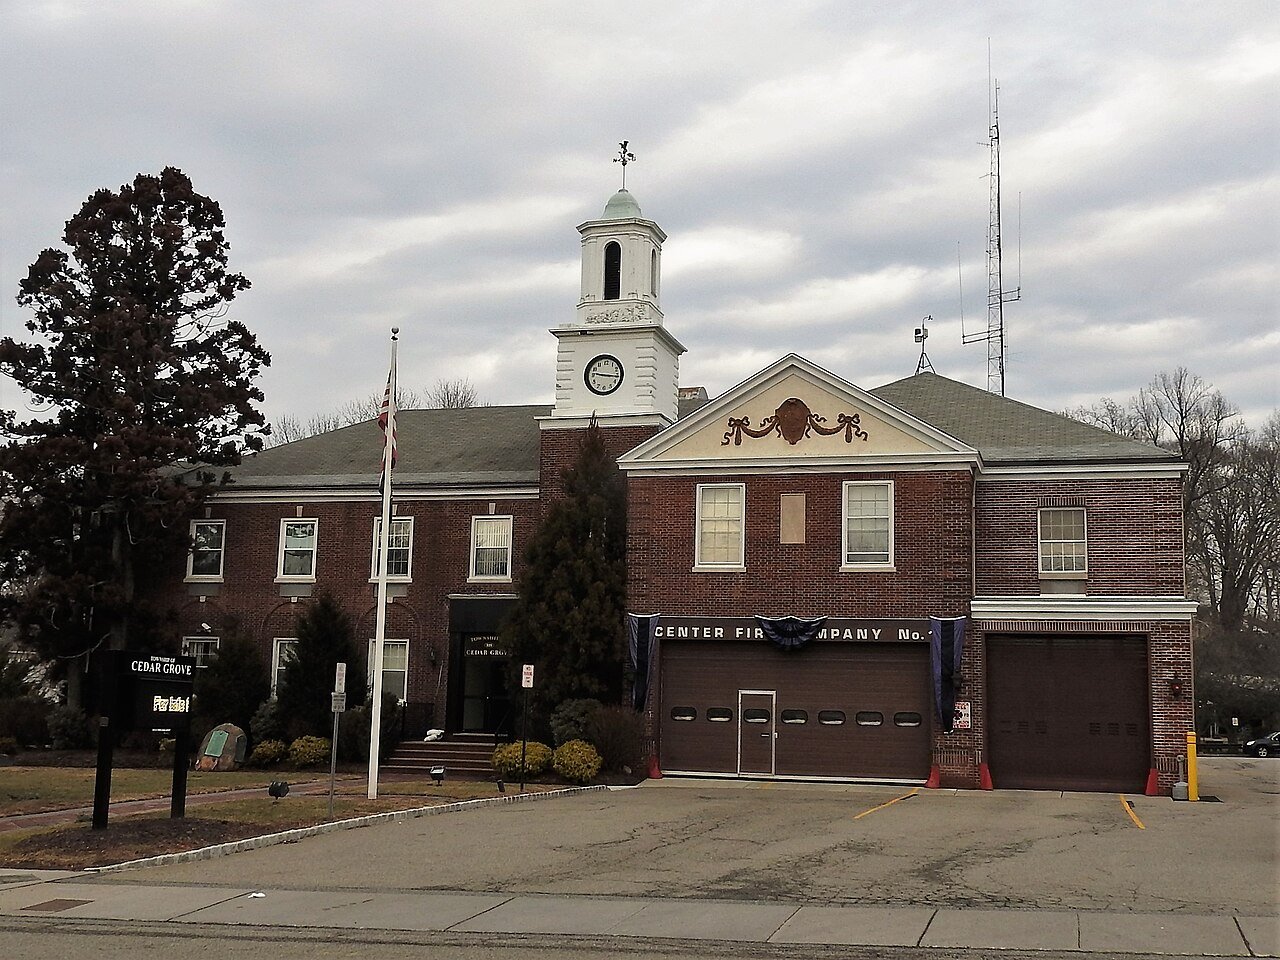 Most trails#1 Cedar Grove · 6.4 mi / sq mi
#24
Most trails#1 Cedar Grove · 6.4 mi / sq mi
#24
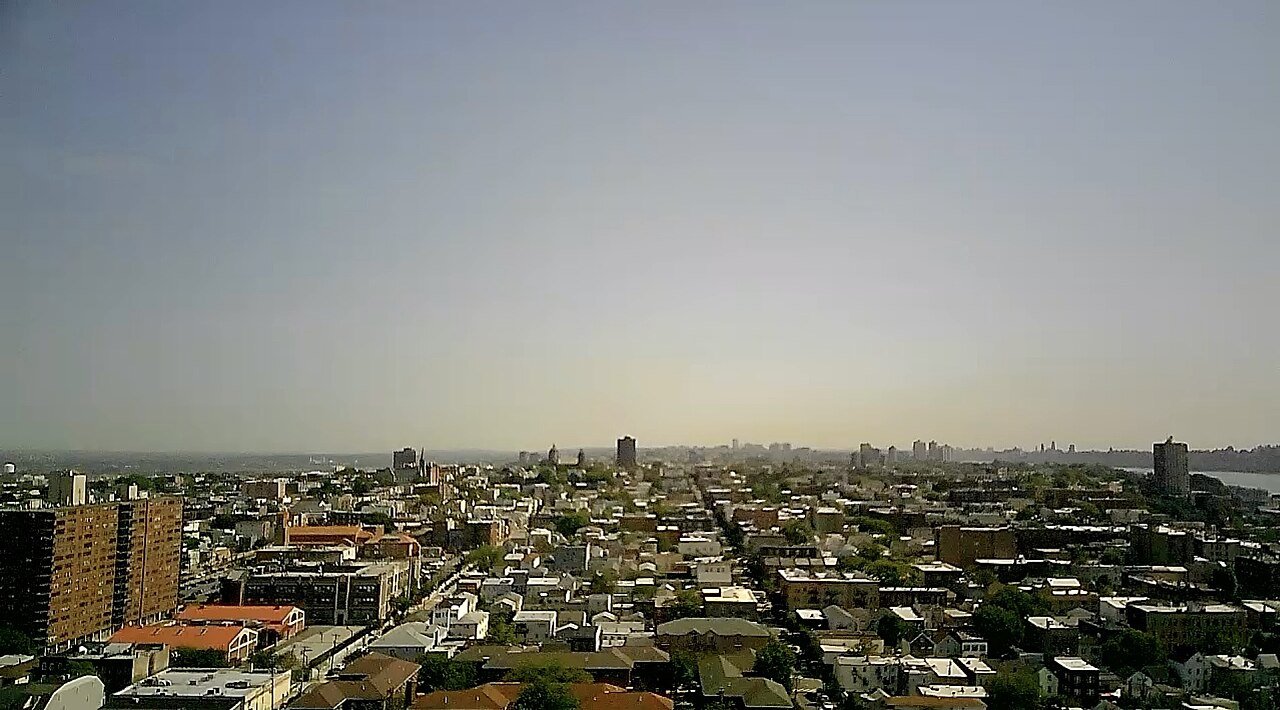 Most walkable#1 Union City · 295 / sq mi
#347
Most walkable#1 Union City · 295 / sq mi
#347 Safety
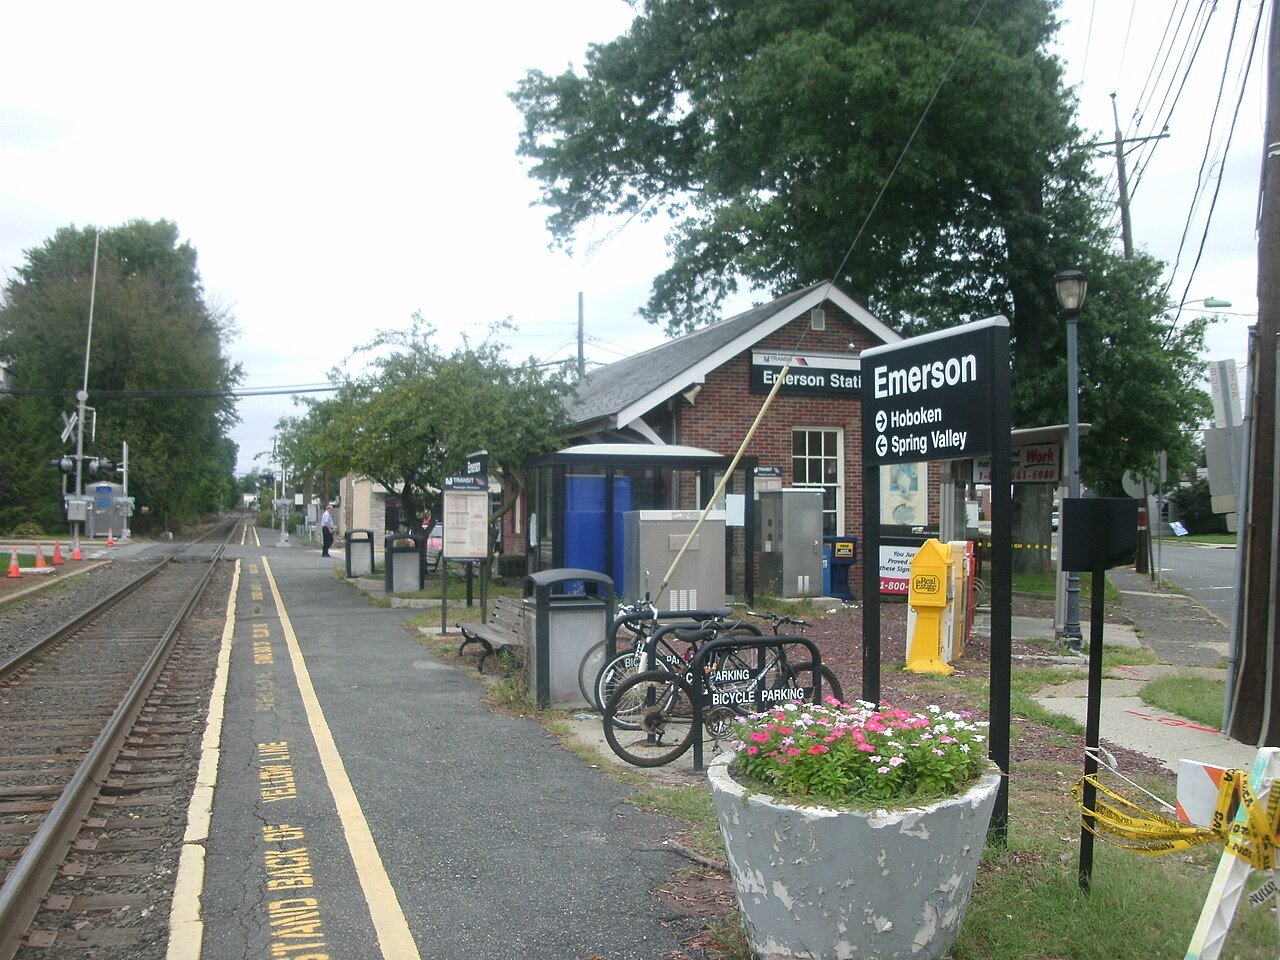 Safest#1 Emerson · 1.5
#56
Safest#1 Emerson · 1.5
#56 Health
 Healthiest#1 Millburn · 100 / 100
#136
Healthiest#1 Millburn · 100 / 100
#136
 Lowest obesity#1 West Windsor · 17%
#100
Fewest smokers#1 West Windsor · 5%
#182
Lowest obesity#1 West Windsor · 17%
#100
Fewest smokers#1 West Windsor · 5%
#182
 Most active#1 Fair Haven · 13%
#143
Most active#1 Fair Haven · 13%
#143
 Fewest uninsured#1 Spring Lake · 4%
#176
Fewest uninsured#1 Spring Lake · 4%
#176
 Lowest depression#1 Palisades Park · 11%
#188
Lowest depression#1 Palisades Park · 11%
#188
 Closest to a top hospital#1 Englewood · 0.0 mi
#131
Closest to a top hospital#1 Englewood · 0.0 mi
#131 Cost of living
 Most affordable#1 Salem · 0.8 yrs
#272
Most affordable#1 Salem · 0.8 yrs
#272
 Cheapest rent#1 Alloway · $749/mo
#185
Cheapest rent#1 Alloway · $749/mo
#185
 Lowest property tax#1 Camden · $2,302/yr
#283
Lowest property tax#1 Camden · $2,302/yr
#283
 Rent easiest to afford#1 Matawan · 29.4%
#34
Rent easiest to afford#1 Matawan · 29.4%
#34 
People
Most educated#1 Millburn · 90%
#201
 Youngest#1 Lakewood · 18.1
#125
Youngest#1 Lakewood · 18.1
#125
 Oldest#1 North Wildwood · 65.6
#337
Most residents 65+#1 North Wildwood · 51.5%
#408
Most kids#1 Lakewood · 49.8%
#151
Oldest#1 North Wildwood · 65.6
#337
Most residents 65+#1 North Wildwood · 51.5%
#408
Most kids#1 Lakewood · 49.8%
#151 Libraries
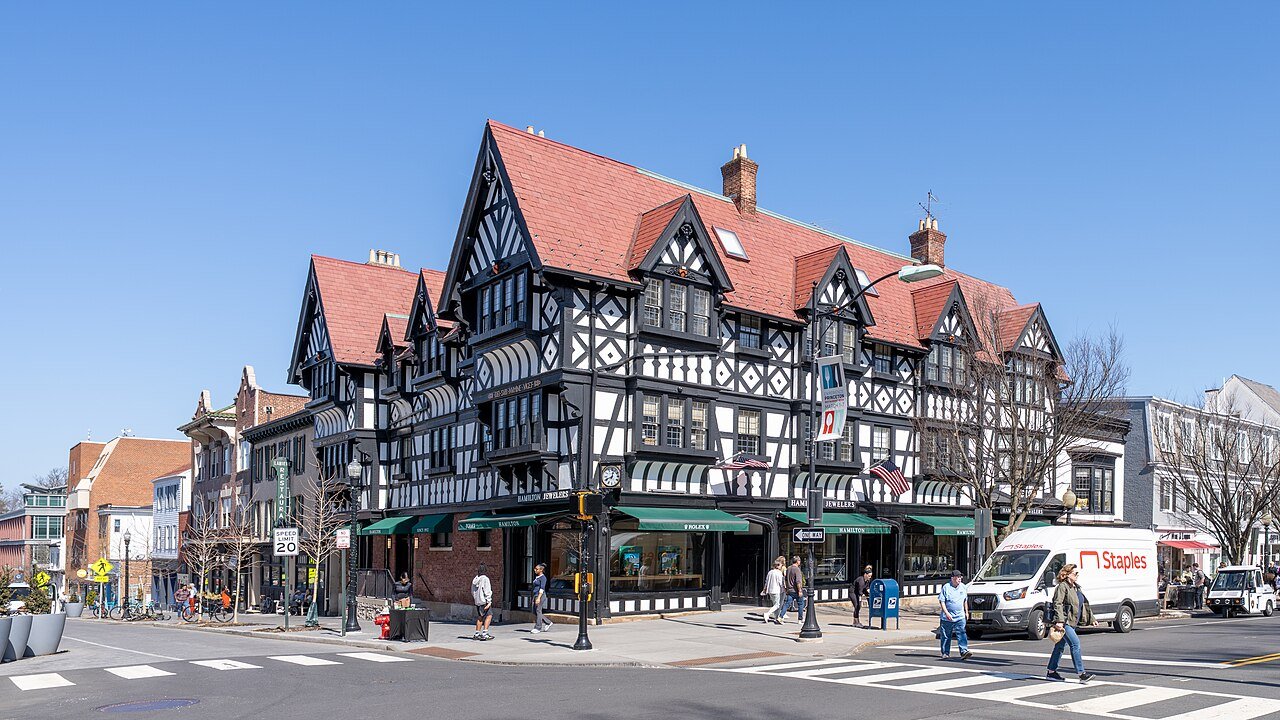 Most-used libraries#1 Princeton · 22.4 per resident
#140
Most-used libraries#1 Princeton · 22.4 per resident
#140
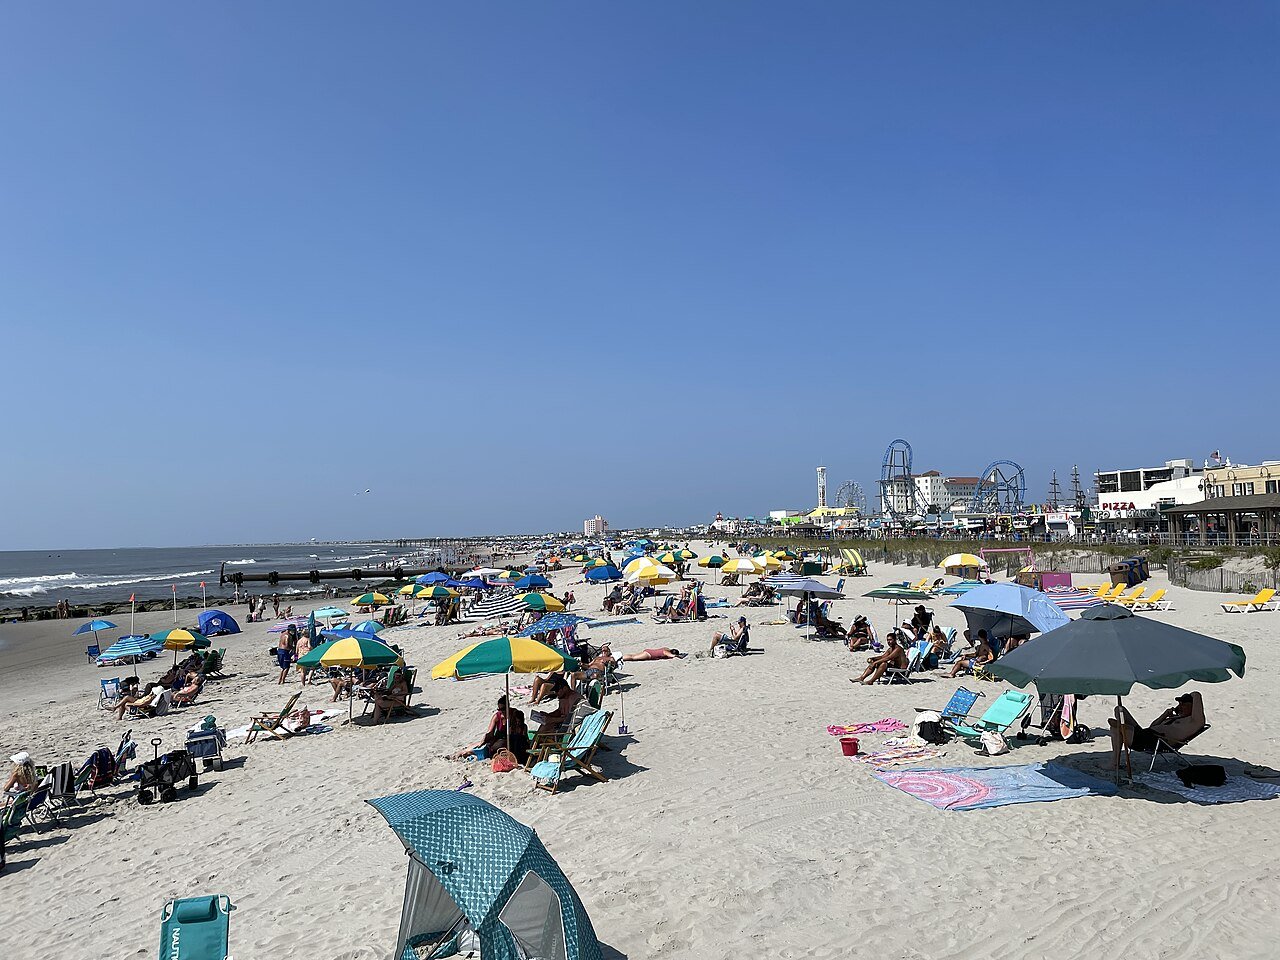 Most library borrowing#1 Ocean City · 31.3 per resident
#107
Best libraries for kids#1 Ocean City · 44.2 per child
#105
Most library borrowing#1 Ocean City · 31.3 per resident
#107
Best libraries for kids#1 Ocean City · 44.2 per child
#105 Housing
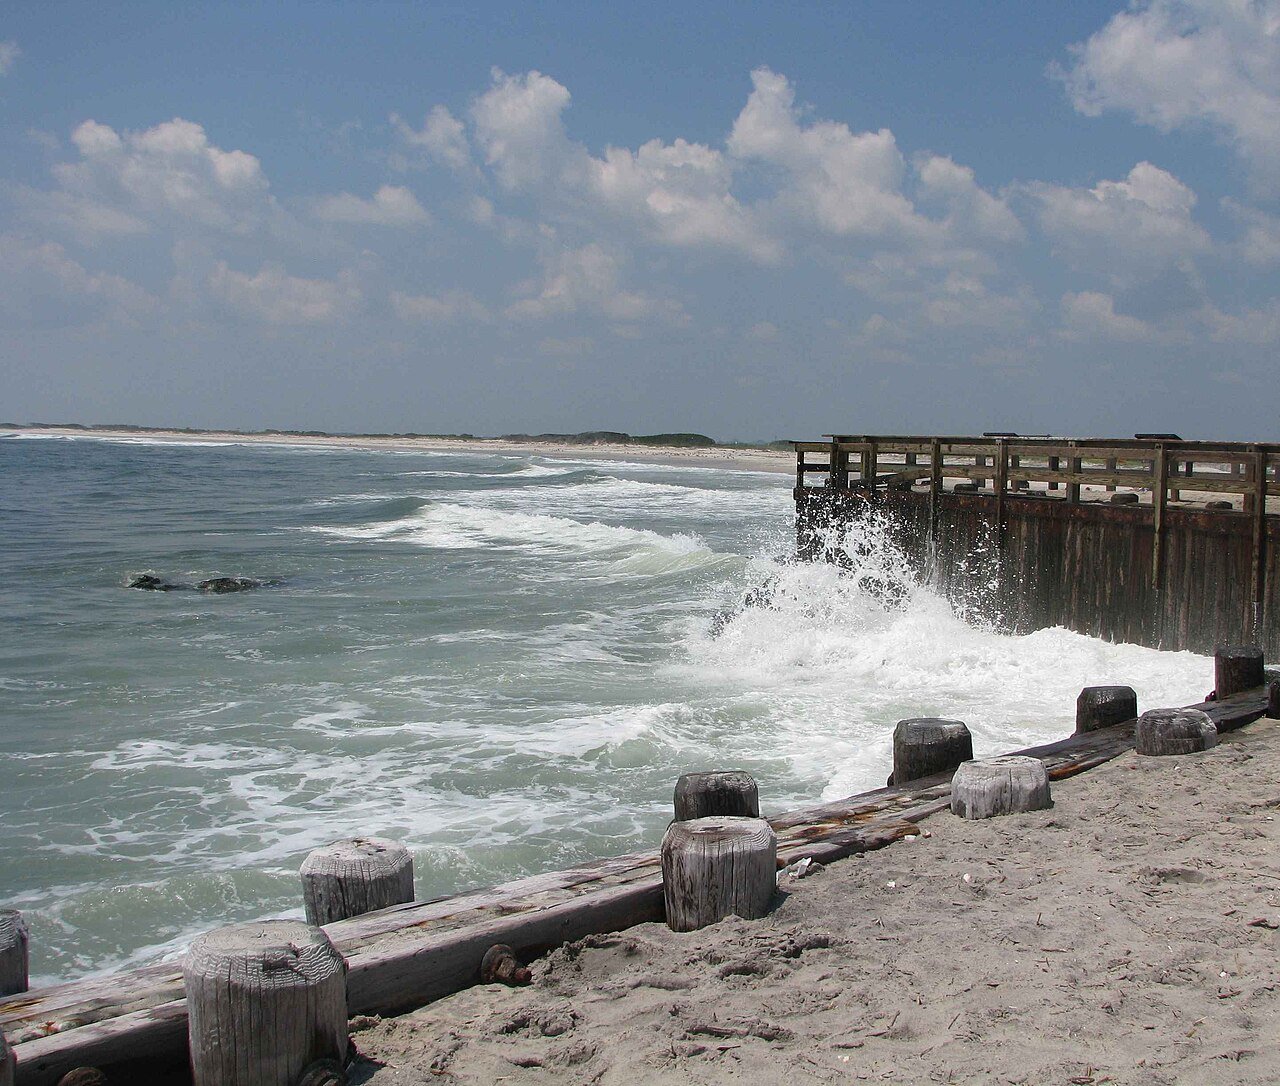 Vacation-home towns#1 Long Beach · 81.3%
#161
Most new homes#1 Long Beach · 41.2 per 1,000
#241
Vacation-home towns#1 Long Beach · 81.3%
#161
Most new homes#1 Long Beach · 41.2 per 1,000
#241
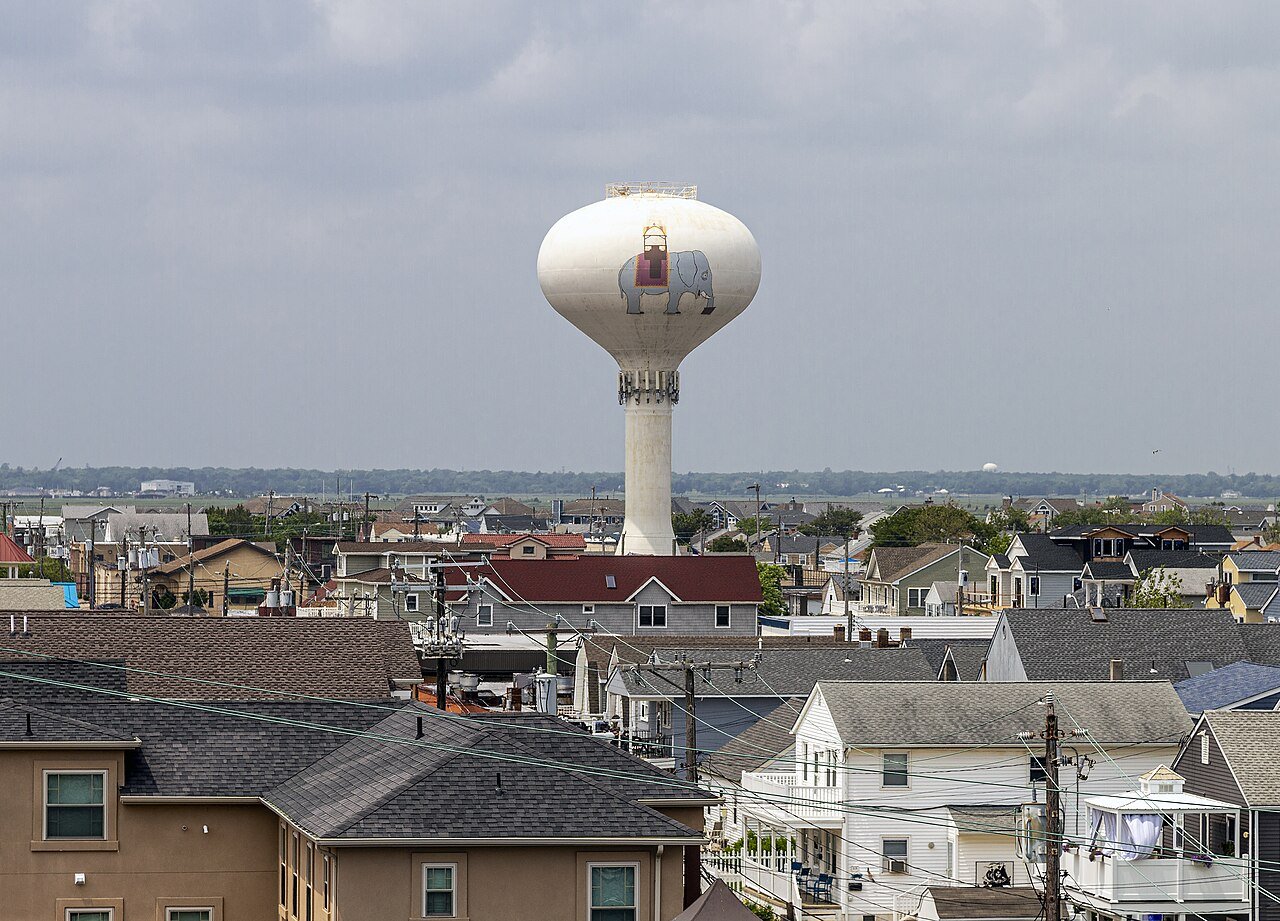 Fastest-rising home prices#1 Margate City · +136.0%
#196
Fastest-rising home prices#1 Margate City · +136.0%
#196
 Housing hasn't kept up#1 Union · 49.9 per home
#214
Housing hasn't kept up#1 Union · 49.9 per home
#214 
Getting around
 Shortest commute#1 New Hanover · 13.2 min
#279
Shortest commute#1 New Hanover · 13.2 min
#279 
The number on the right is Mount Olive’s spot. All of New Jersey’s rankings, with the map → · National lists and other states: all rankings.
Do the numbers ring true?
The lists count what can be counted. Neighbors know the rest.
Your answer becomes a post in Town Square.
- 2,500+ residents. Census estimates for smaller towns carry margins of error too wide to rank fairly, so they sit out every NJ list.
- One town, one row. A city that is both a city and a town in Census data, or a village inside a town, is counted once.
- Ties share a rank. Towns on one weather station, one school district or one CDC estimate share a figure, so they share a spot (T).
- No “worst” lists. Lists rank toward the good end, and share cards are made only for the top half. Age, snow and the like are character, not grades.
U.S. Census Bureau (American Community Survey 5-year, 2010 and 2020 censuses, Building Permits Survey), U.S. Department of Education, FBI Uniform Crime Reporting, CDC PLACES, Medicare Care Compare, IMLS Public Libraries Survey, FHFA House Price Index, NOAA U.S. Climate Normals 1991–2020, USGS PAD-US and OpenStreetMap. Each list explains its own method.