IDIdaho rankings

Towns with the hottest summers in Idaho

Ranked by the typical afternoon high in July, 1991–2020, from NOAA’s gridded climate normals for each town. Neighboring towns on the same 5 km grid square have the same numbers, so each square is listed once, under its largest town. 63 towns with 2,500+ residents.
NOAA U.S. Climate Normals, 1991–2020

#TownJuly highDays at 90°+July low
1 Mountain Home Mountain Home16,493 people 93.8° 65 59°
2 Mountain Home AFB3,219 people 93.8° 65 60°
3 Weiser Weiser5,935 people 93.7° 59 60°
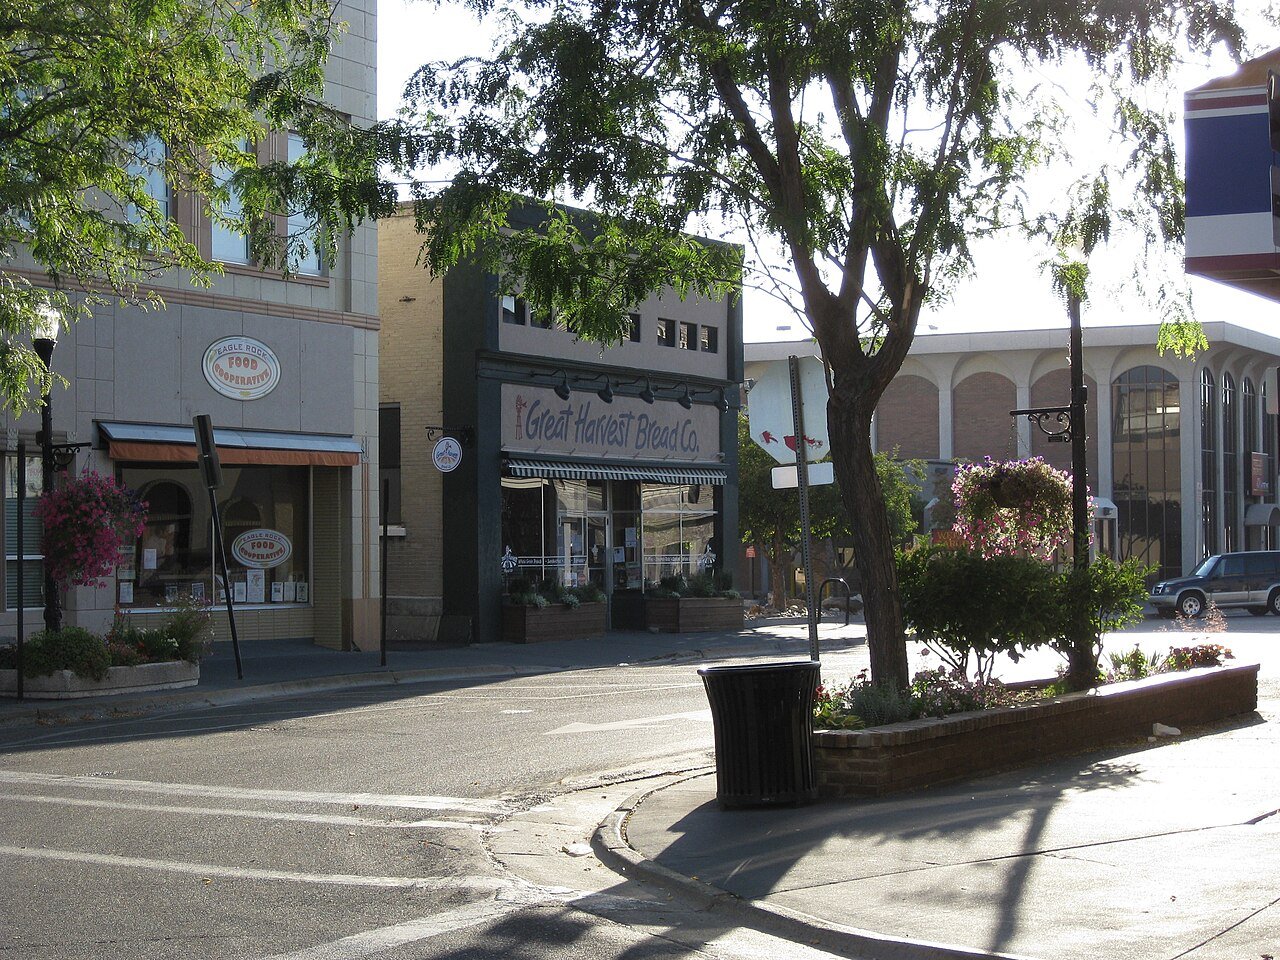
4 Payette Payette8,536 people 93.6° 54 60°
5 Map of Homedale Homedale3,069 people 93.6° 65 58°
6 Fruitland Fruitland6,663 people 93.4° 62 60°
7 Boise City Boise City237,242 people 92.9° 55 59°
8 Caldwell Caldwell66,516 people 92.8° 59 58°
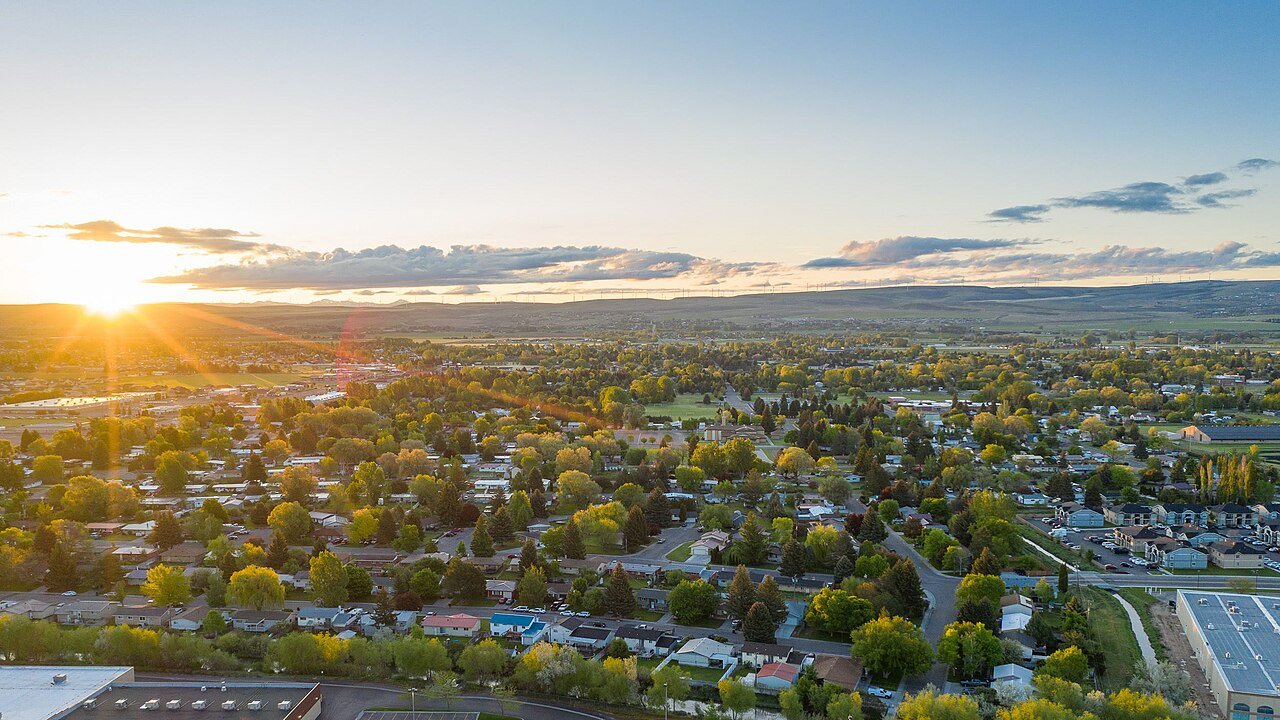
9 Emmett Emmett8,275 people 92.8° 51 58°
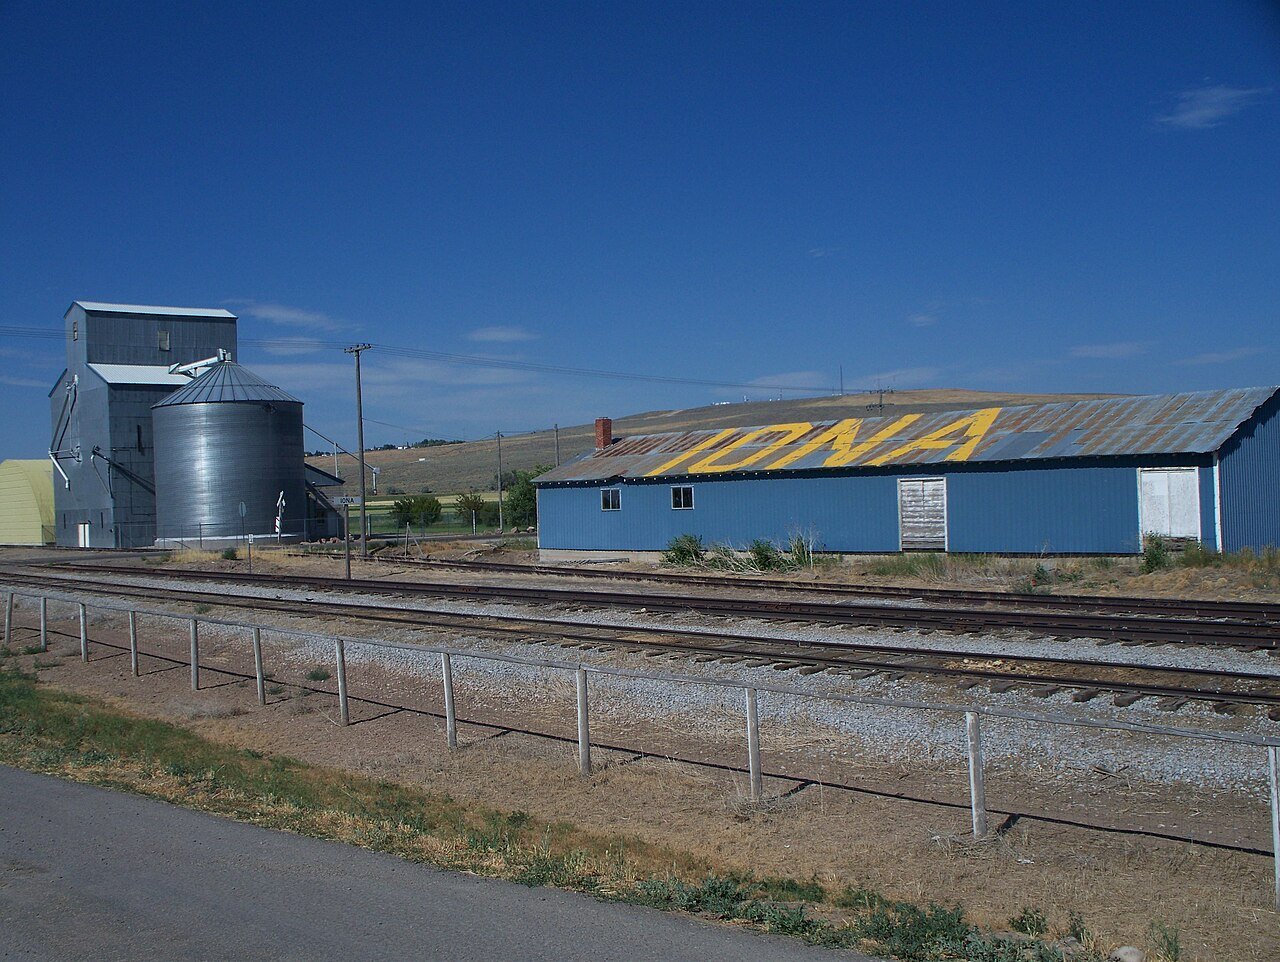
10 Nampa Nampa110,319 people 92.7° 59 58°
11 Map of Star Star14,745 people 92.7° 51 58°
12 Garden City Garden City12,654 people 92.7° 55 58°
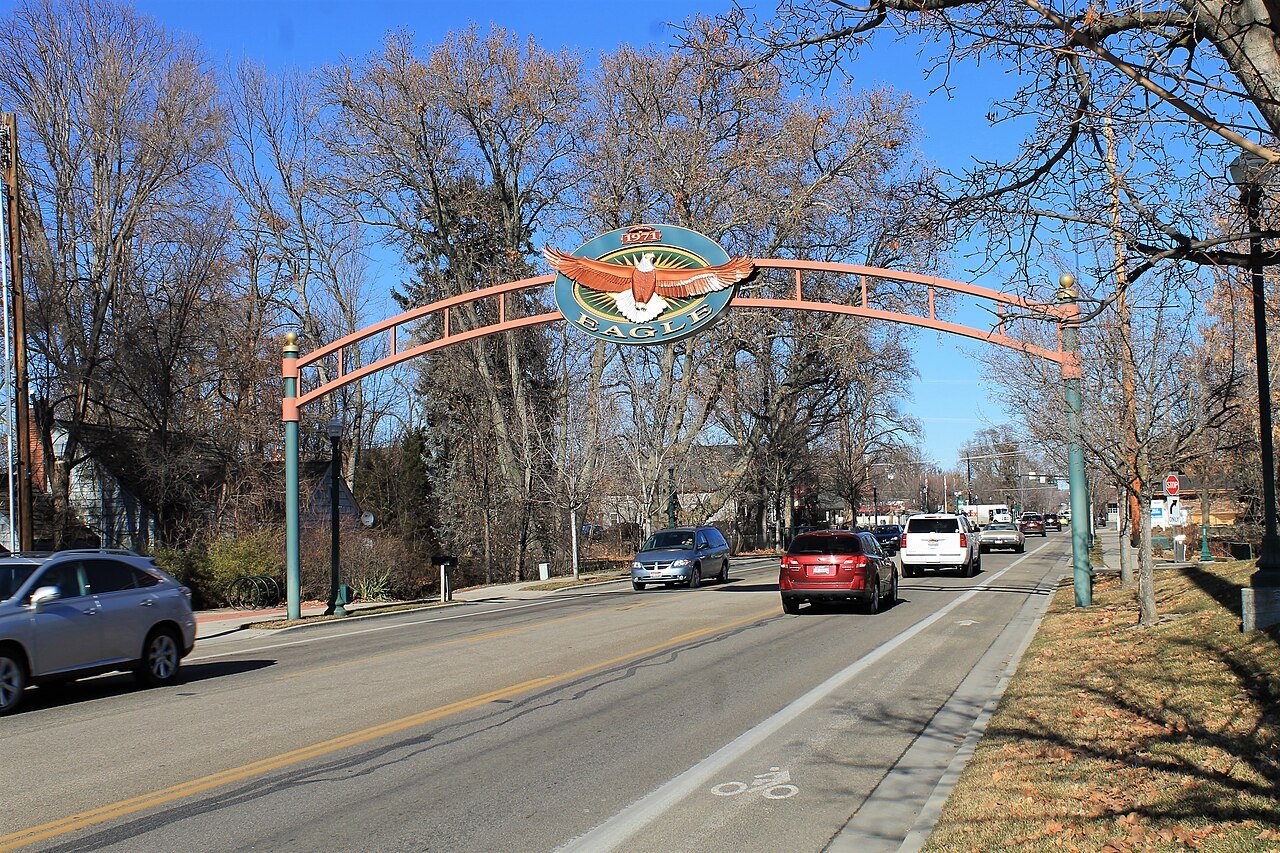
13 Eagle Eagle32,855 people 92.6° 51 58°
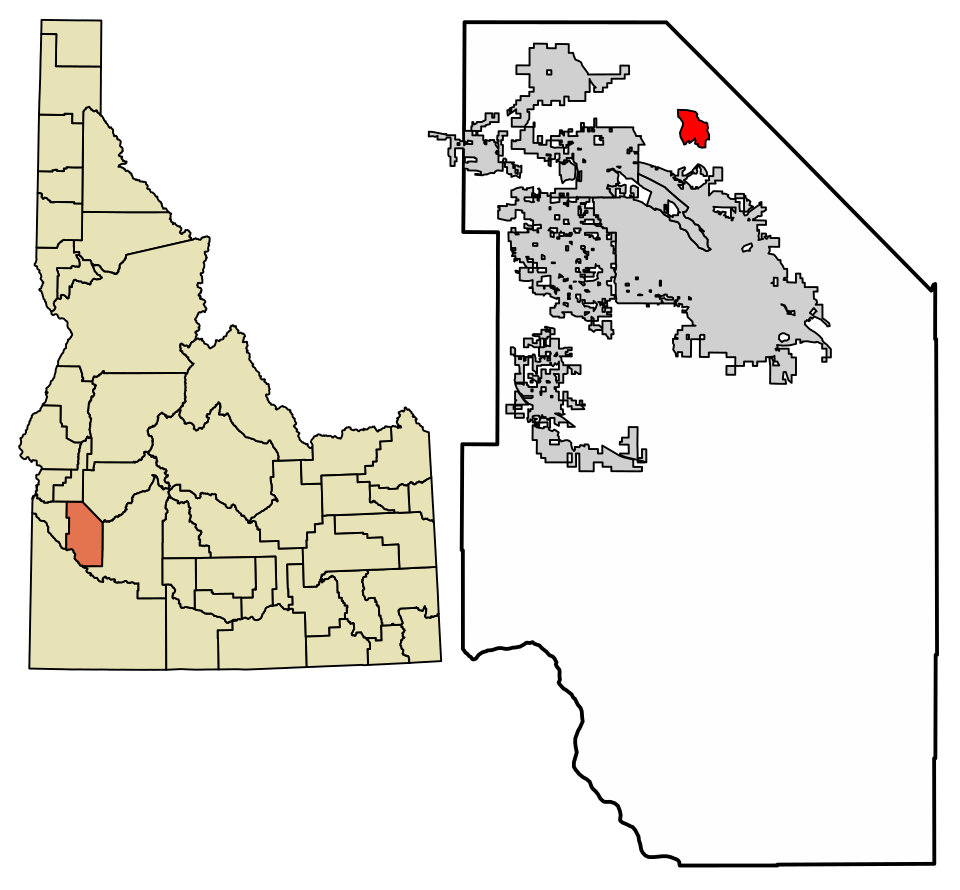
14 Map of Meridian Meridian130,138 people 92.5° 55 59°
15 Middleton Middleton10,649 people 92.5° 59 58°
16 Kuna Kuna27,158 people 92.4° 55 59°
17 Map of Wendell Wendell2,981 people 91.7° 69 57°
18 Lewiston Lewiston34,651 people 91.5° 44 58°
19 Map of Gooding Gooding3,778 people 91.5° 69 56°
20 Map of Hidden Springs Hidden Springs3,378 people 91.5° 29 57°
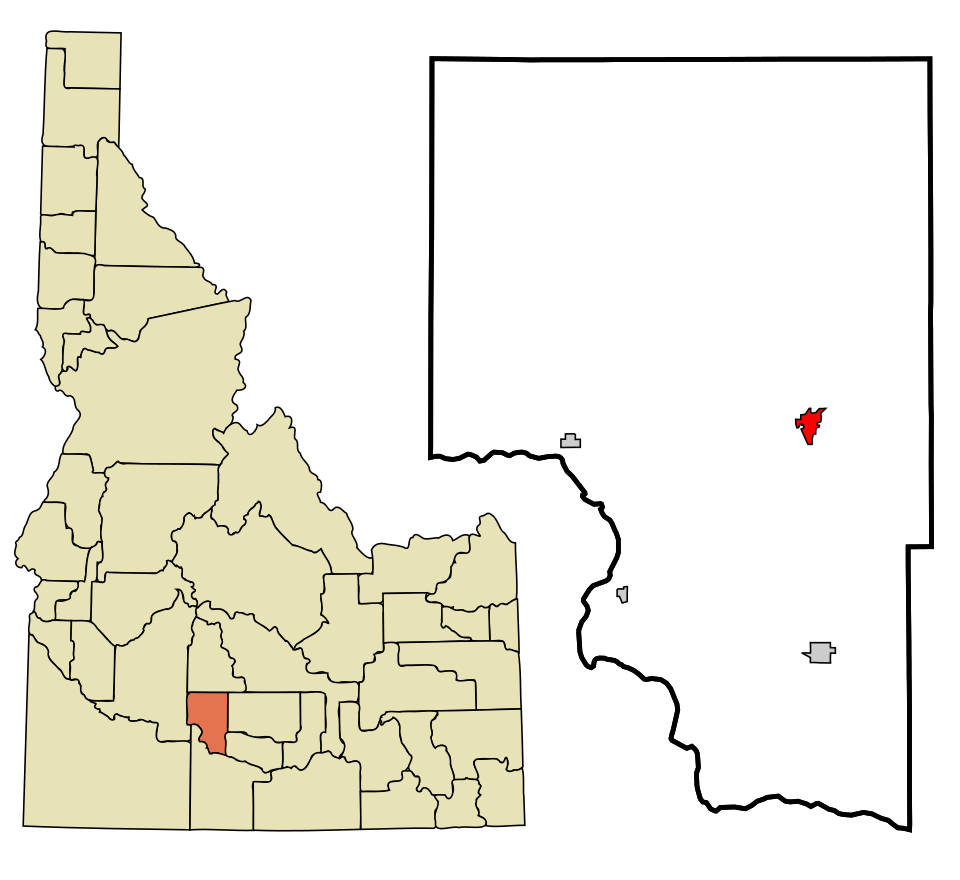
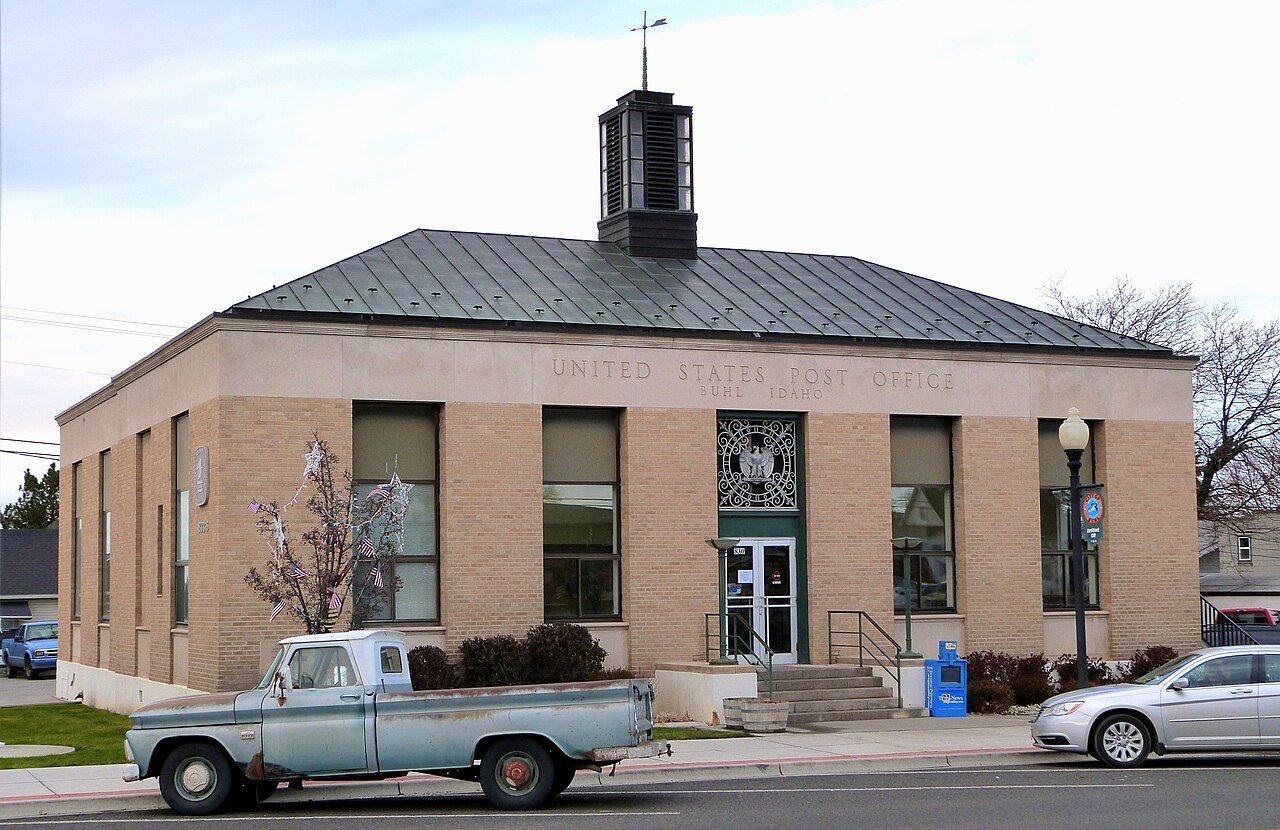
21 Buhl Buhl4,673 people 90.5° 32 58°
22 Twin Falls Twin Falls54,164 people 90.3° 46 57°
23 Jerome Jerome12,930 people 90.2° 54 57°
24 Map of Filer Filer2,925 people 89.9° 54 58°
25 Map of Kimberly Kimberly5,111 people 89.5° 23 57°
26 Preston Preston5,928 people 89.2° 34 53°
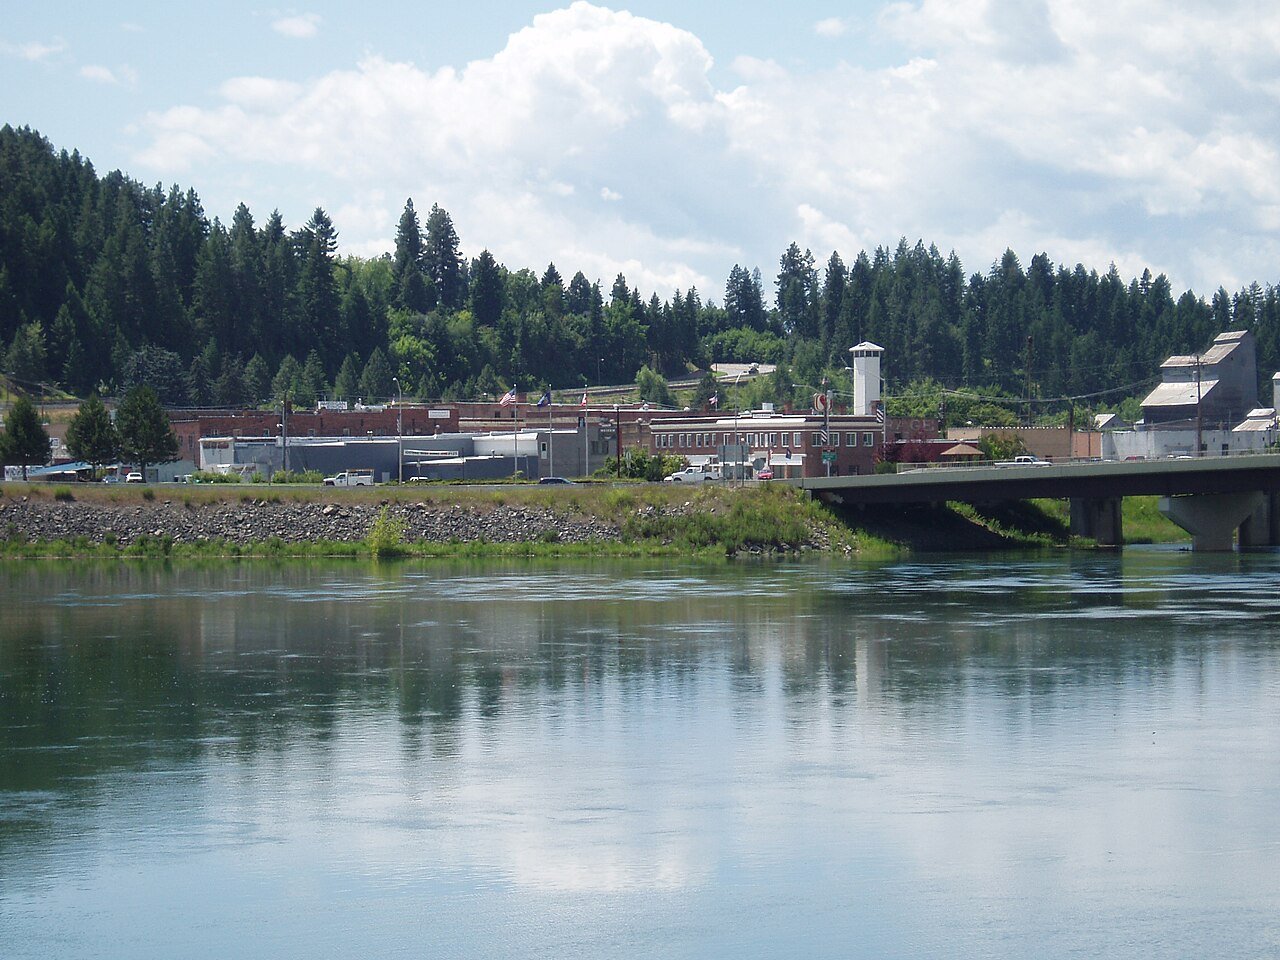
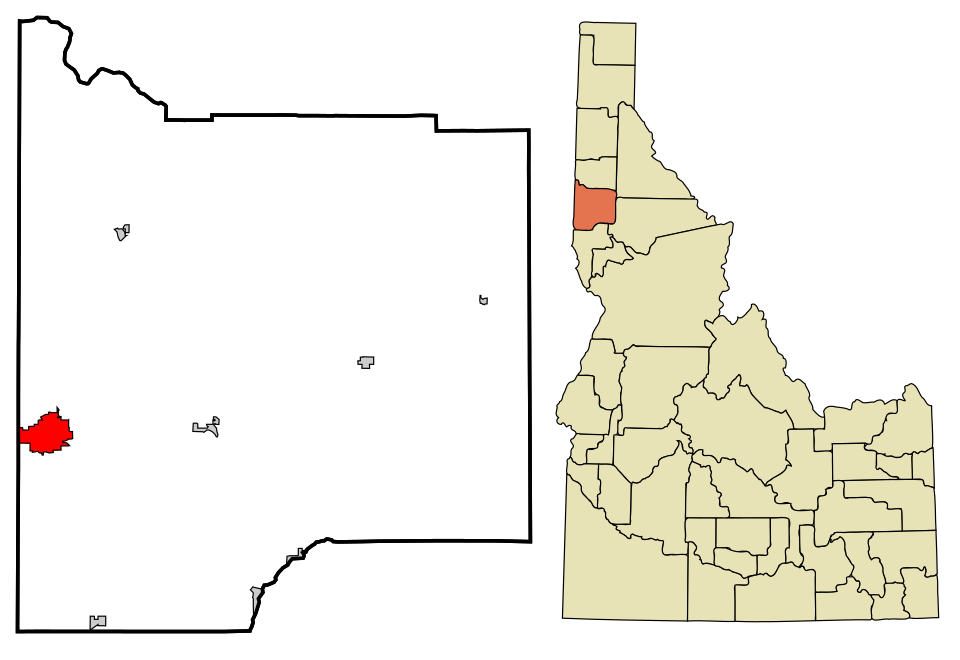
27 Orofino Orofino3,260 people 88.9° 47 53°
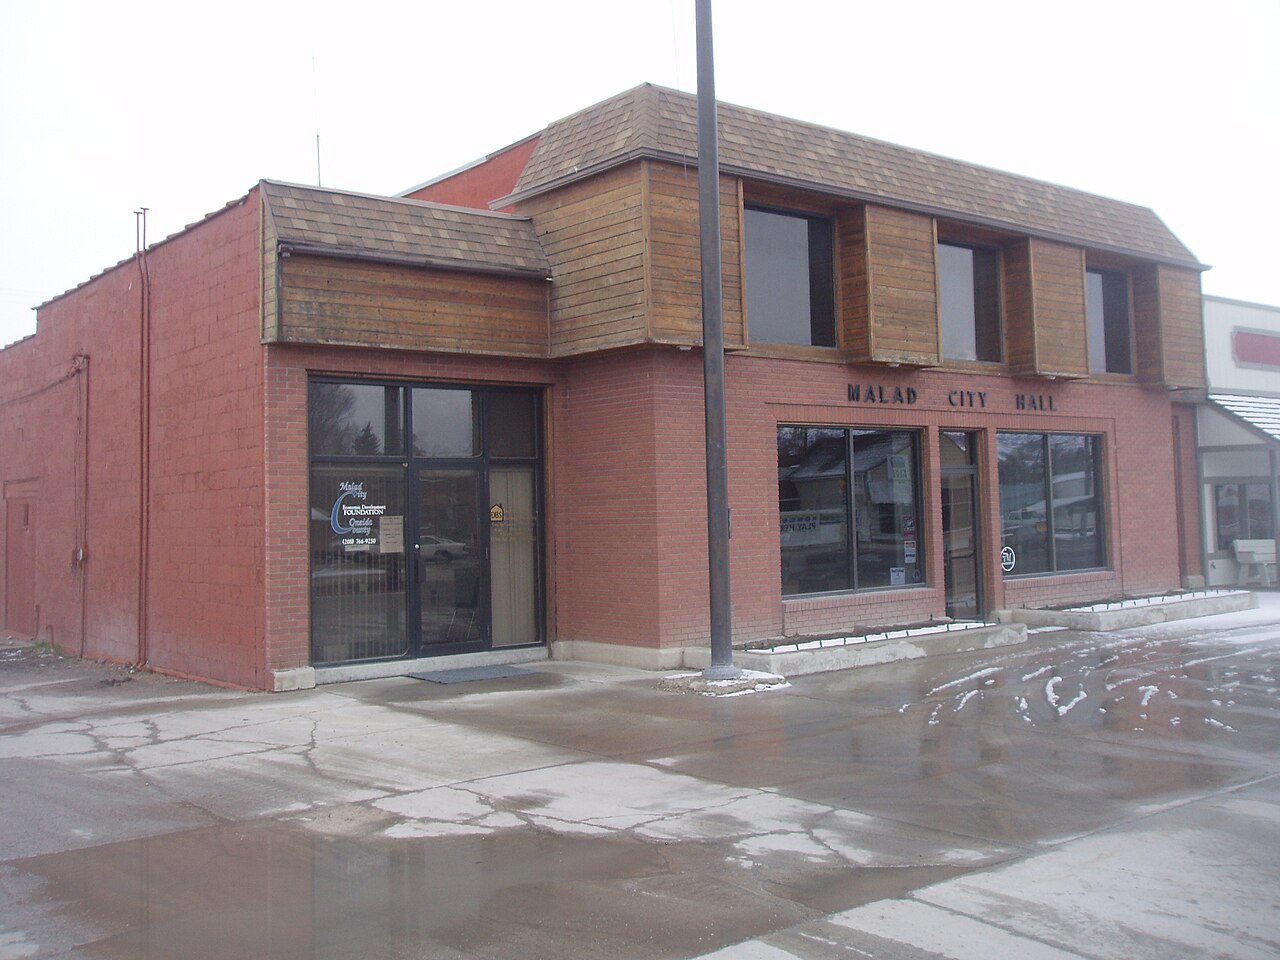
28 Malad City Malad City2,601 people 88.8° 46 52°
29 Rupert Rupert6,190 people 88.7° 33 54°
30 Burley Burley11,958 people 88.5° 33 55°
31 Heyburn Heyburn3,693 people 88.5° 33 55°
32 American Falls American Falls4,712 people 88.0° 42 52°
33 Map of Chubbuck Chubbuck16,126 people 87.9° 39 53°
34 Fort Hall Fort Hall2,654 people 87.9° 26 53°
35 Map of Aberdeen Aberdeen2,564 people 87.9° 30 52°
36 Blackfoot Blackfoot12,782 people 87.6° 26 53°
37 Salmon Salmon3,203 people 86.9° 25 53°
38 Map of Pocatello Pocatello57,635 people 86.7° 41 54°
39 Shelley Shelley5,092 people 86.5° 26 52°
40 Idaho Falls Idaho Falls67,725 people 86.1° 26 52°
41 Ammon Ammon19,064 people 85.8° 26 51°
42 Lincoln4,002 people 85.7° 26 51°
43 Iona Iona2,984 people 85.6° 26 51°
44 Map of Rigby Rigby5,404 people 85.2° 13 51°
45 Soda Springs Soda Springs3,158 people 84.8° 15 48°
46 Map of Bellevue Bellevue2,588 people 84.6° 24 50°
47 St. Maries St. Maries2,915 people 84.5° 20 51°
48 Rexburg Rexburg40,543 people 84.4° 18 50°
49 Hailey Hailey9,665 people 84.4° 4 50°
50 St. Anthony St. Anthony3,911 people 84.4° 10 50°
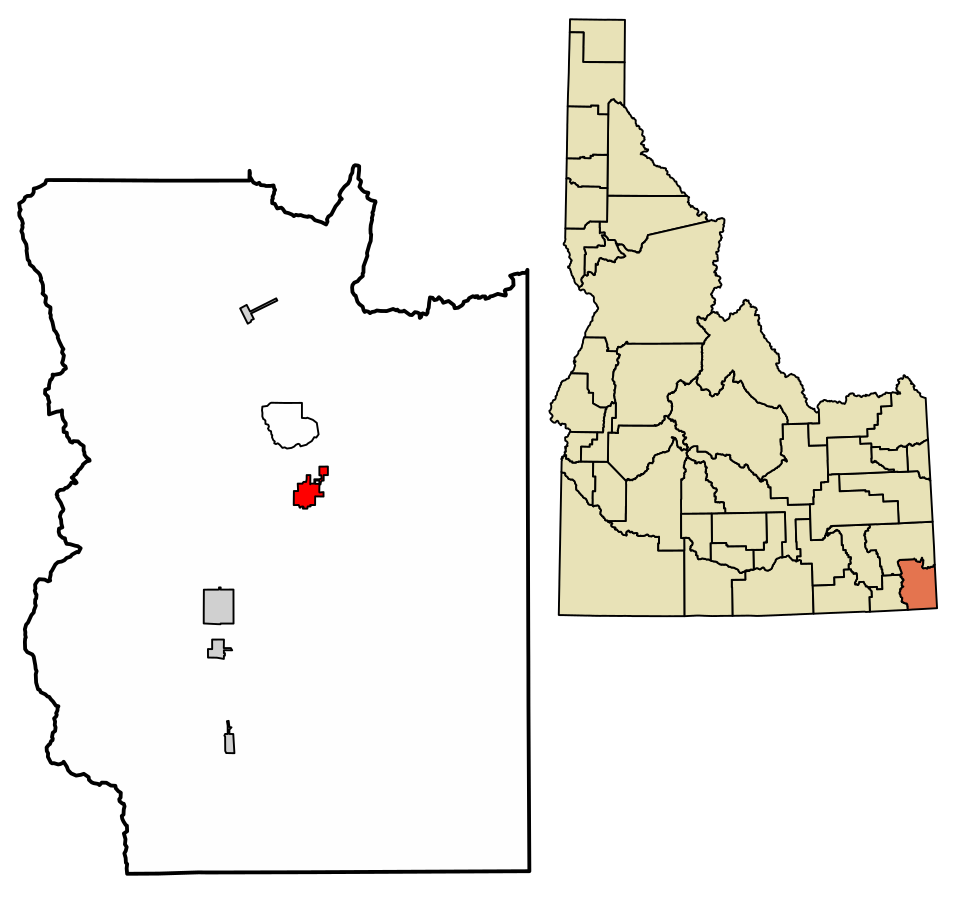
51 Map of Montpelier Montpelier2,694 people 84.4° 16 47°
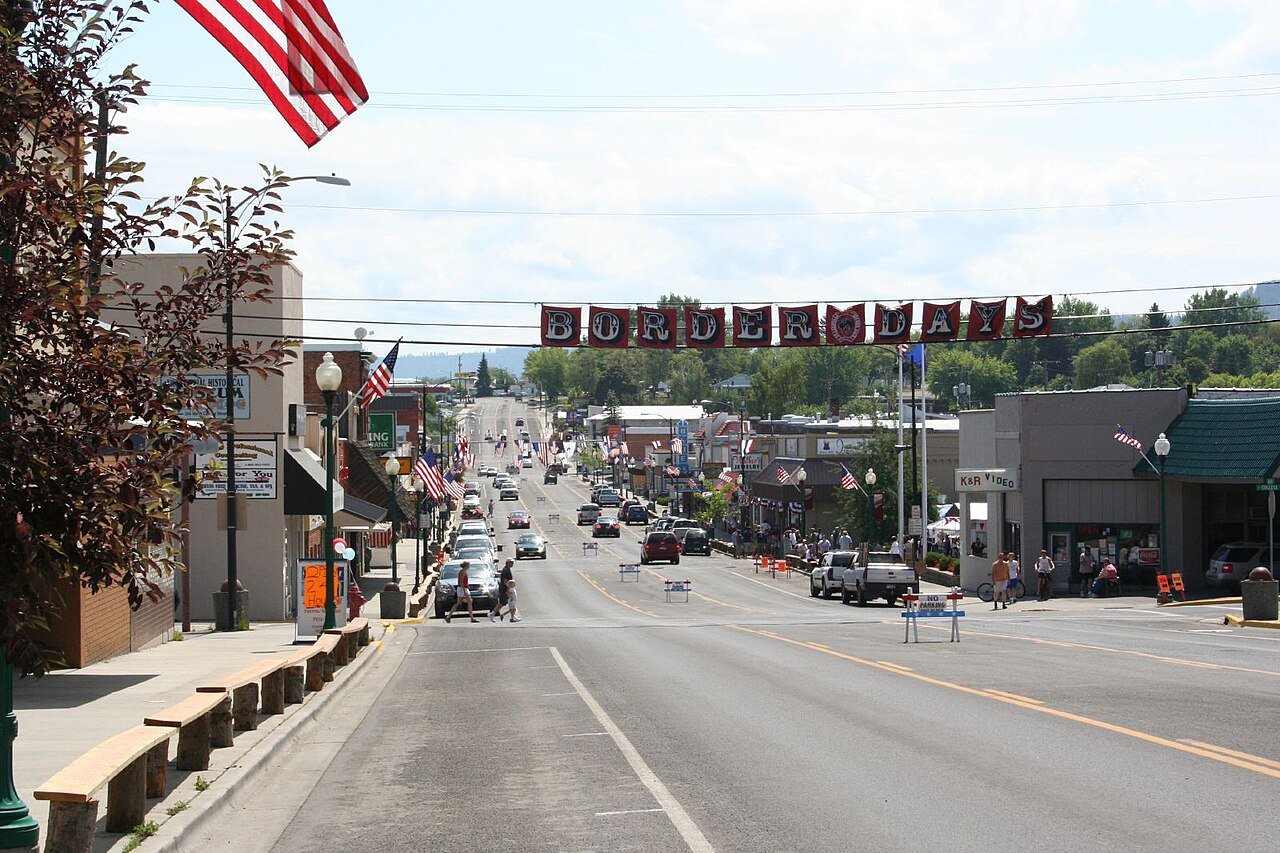
52 Bonners Ferry Bonners Ferry2,669 people 83.9° 21 51°
53 Map of Moscow Moscow26,286 people 83.7° 23 49°
54 Grangeville Grangeville3,515 people 83.5° 14 53°
55 Map of Coeur d'Alene Coeur d'Alene56,447 people 83.3° 18 53°
56 Post Falls Post Falls43,391 people 83.1° 18 53°
57 Sandpoint Sandpoint9,637 people 83.1° 14 50°
58 Rathdrum Rathdrum10,874 people 82.7° 18 52°
59 Map of Hayden Hayden16,338 people 82.6° 18 53°
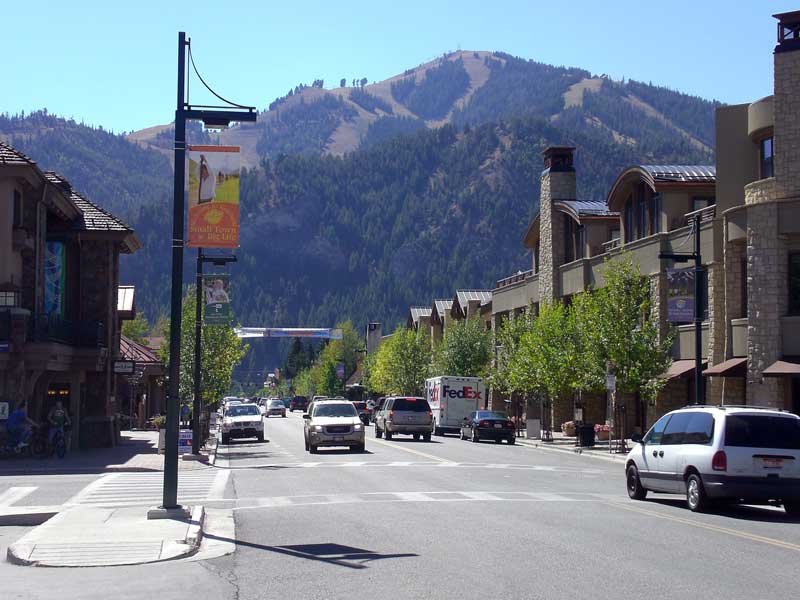
60 Ketchum Ketchum3,594 people 82.5° 4 46°
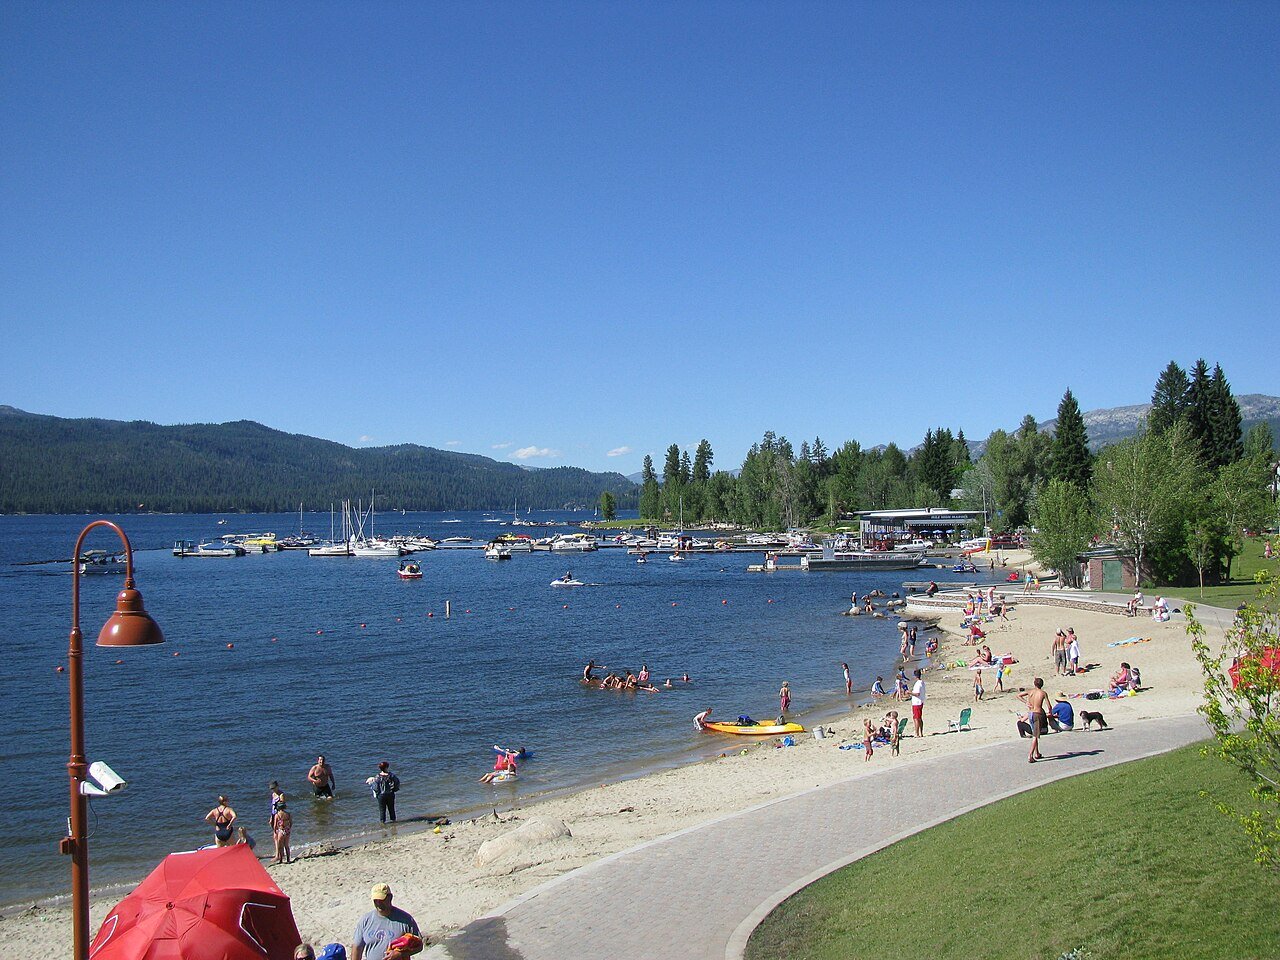
61 McCall McCall3,946 people 81.2° 9 45°
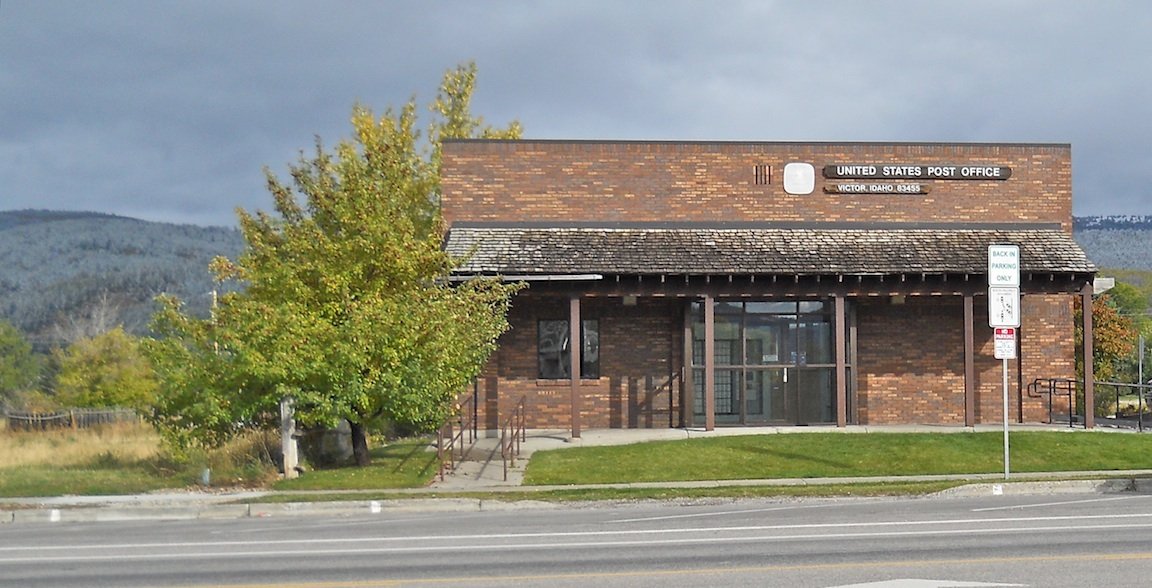
62 Victor Victor3,067 people 79.9° 2 46°
63 Map of Driggs Driggs2,925 people 79.7° 2 46°

How this ranking works

We rank every town by the typical afternoon high in July, 1991–2020, from NOAA’s gridded climate normals for each town. The town with the highest figure ranks #1. Normals are 30-year averages, not a forecast, and each town’s Climate page shows its whole year month by month.

Temperatures and rainfall come from NOAA’s gridded normals, about 5 km (3 miles) square, read at each town’s center, so hills and coastlines are built in. Towns whose centers fall in the same square have the same numbers, so only the largest of them is listed.

Only towns with at least 2,500 residents are ranked; Census estimates for smaller places are too uncertain. Population and income: U.S. Census Bureau American Community Survey 5-year estimates. Climate: NOAA NCEI U.S. Climate Normals, 1991–2020. Town photos: Wikimedia Commons, credited on each town’s page.

Same ranking in other states