A typical home costs $310 more a month in Russell Township
A typical home in each town, bought with 20% down at 6.3% for 30 years, plus property tax at the town’s own rate and insurance. Change the numbers to fit you.
A dot marks the most on each row. Climate: NOAA 1991–2020 normals at the nearest station. Hazard risk: FEMA National Risk Index, expected yearly damage vs U.S. towns.
Everything, side by side
What matters to you?
Pick a few. Those rows jump to the top and the best fit on each is marked. There’s no overall score: what matters is up to you.
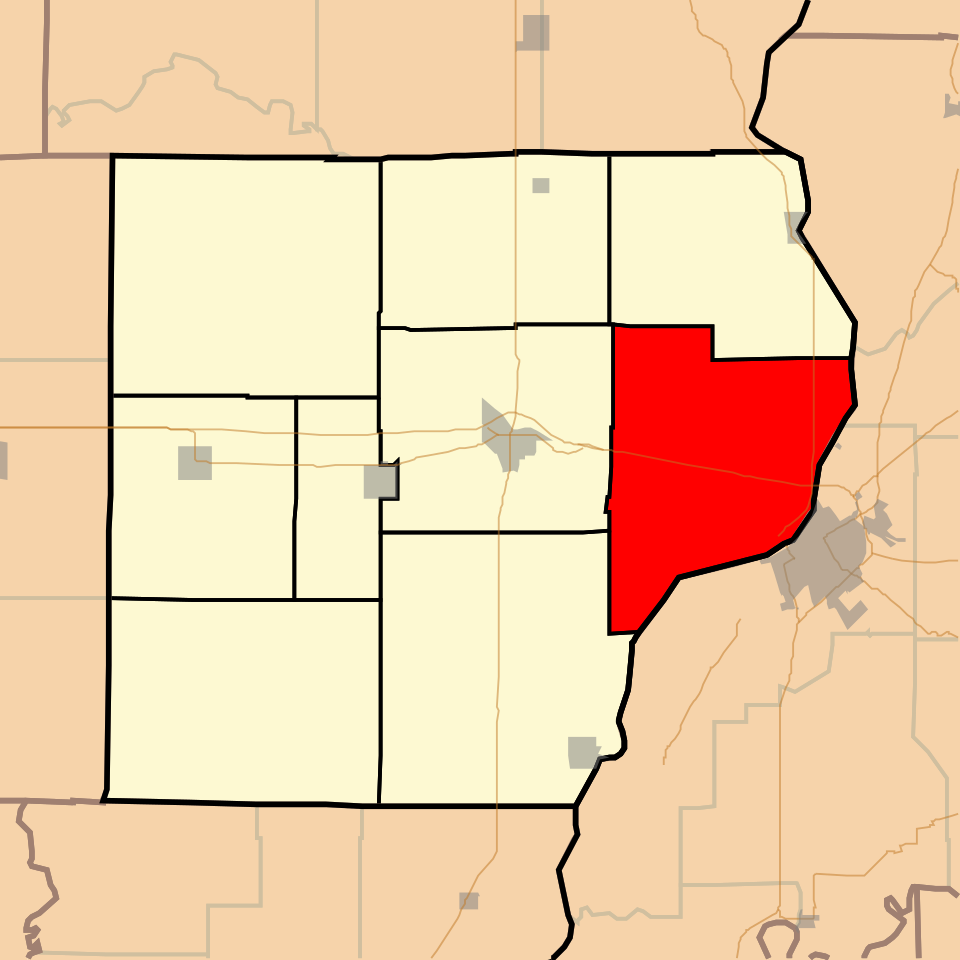
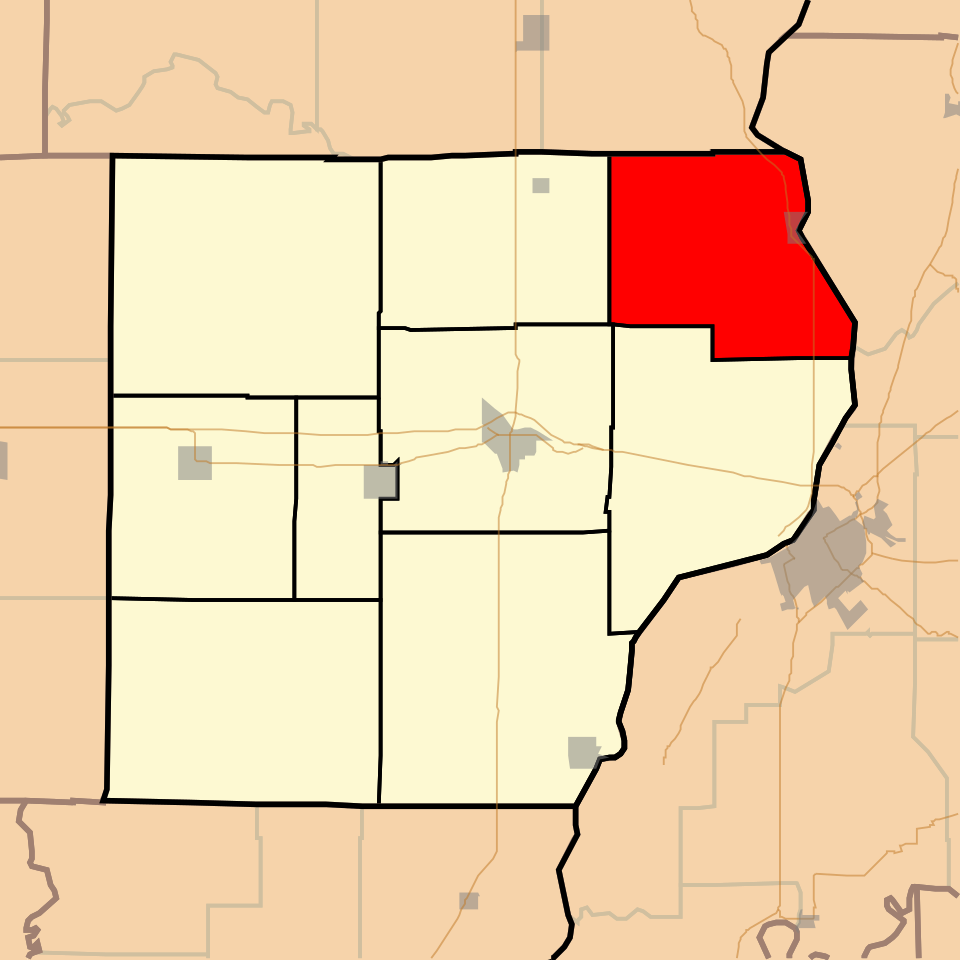
Allison TownshipRussell Township
Your priorities
People
Population502Highest254Lowest
Median age30.7±0.4Lowest 21% below IL58.2±18.7Highest 49% above IL
Kids under 1813.3%±13Highest IL: 21.8%11%±16.6Lowest IL: 21.8%
Allison Township and Russell Township are within the Census margin of error here, so we can’t say which is really higher.
Age 65+18.3%±15.2Highest IL: 17%13.4%±16.8Lowest IL: 17%
Allison Township and Russell Township are within the Census margin of error here, so we can’t say which is really higher.
Sources: U.S. Census Bureau American Community Survey 5-year estimates, 2010 & 2020 censuses, LEHD commute flows; Zillow Home Value Index; NCES Common Core of Data; FBI crime reporting; CDC PLACES; FEMA National Risk Index; NOAA U.S. Climate Normals 1991–2020; USGS PAD-US and OpenStreetMap. “±” is the Census margin of error; differences inside it are never called. Property tax is top-coded by the Census at $10,000+. There is no overall score: which town is better depends on what matters to you.
 + Compare
 + Compare