COColorado rankings

Towns where housing hasn't kept up with growth in Colorado

Ranked by how many new residents each town gained for every new home it permitted between the 2010 and 2020 censuses. 66 towns with 2,500+ residents.
U.S. Census ACS 2020–2024 5-year

#TownNew residents per new homeResidents gainedHomes permitted
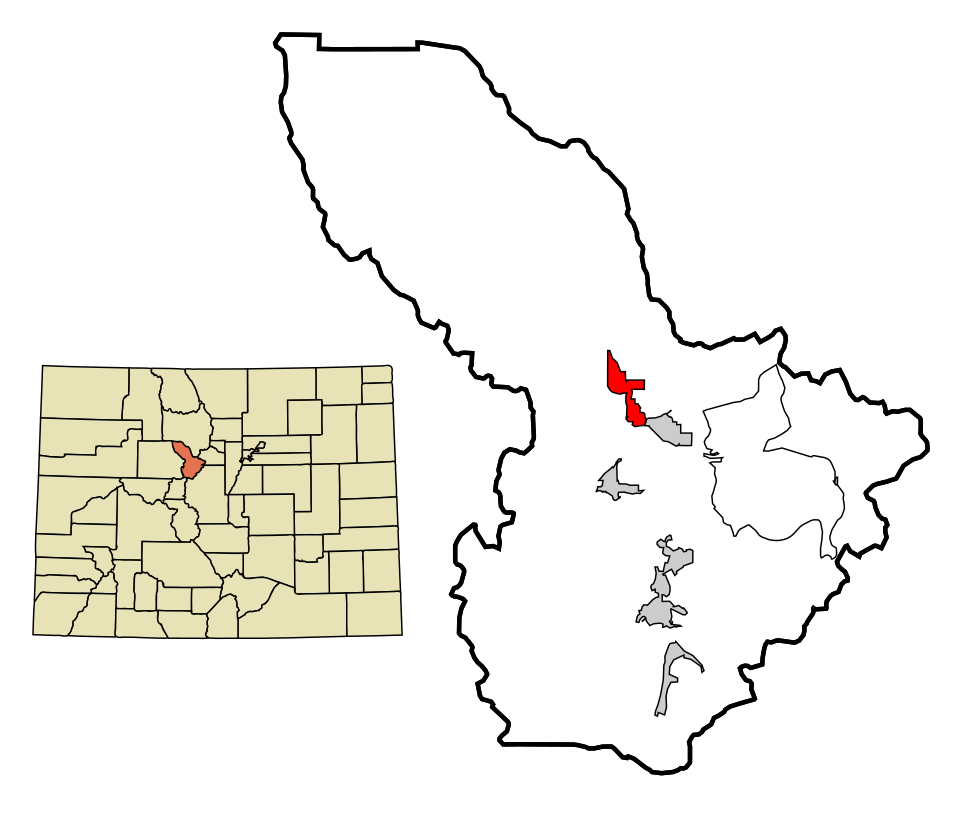
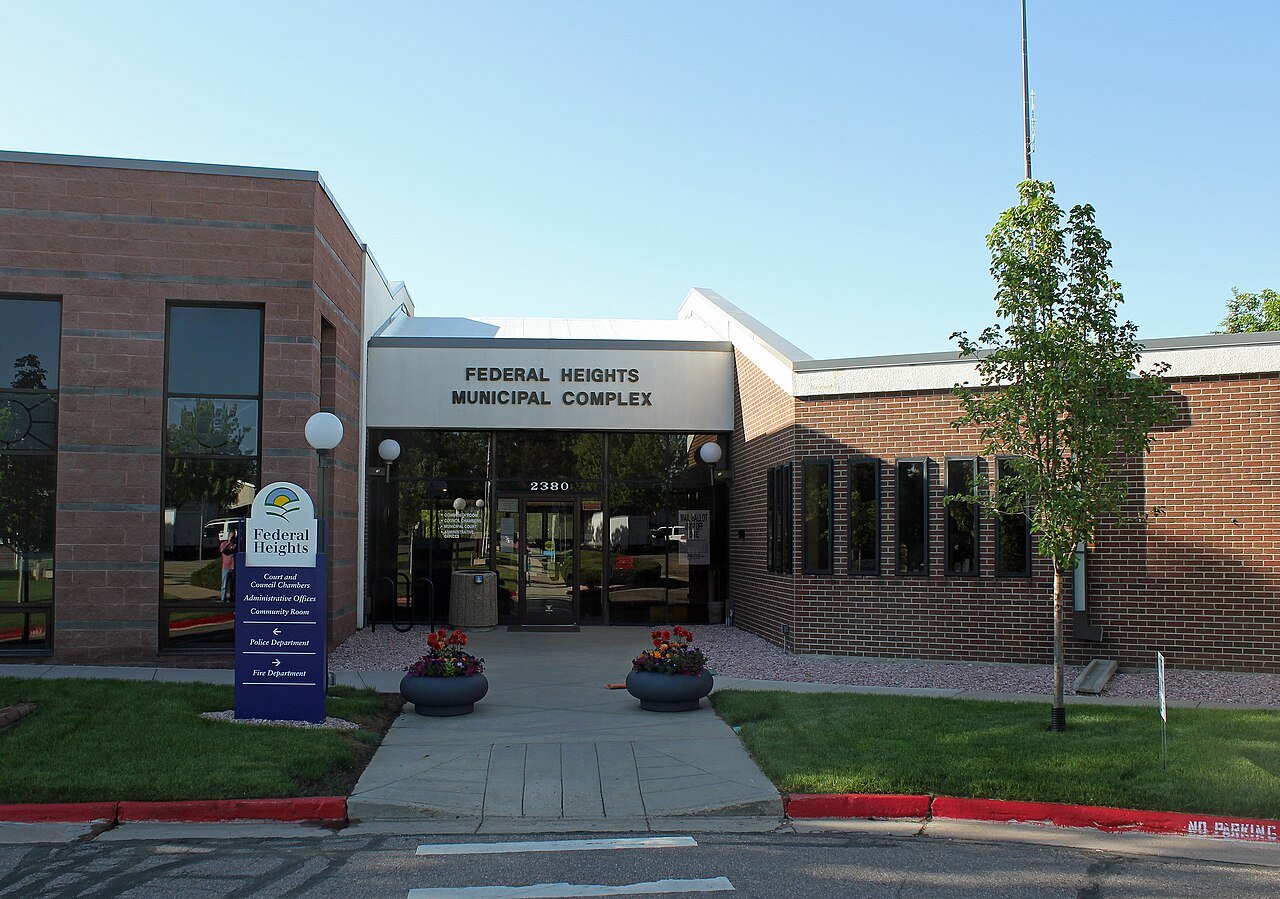
1 Federal Heights Federal Heights14,125 people 33.9 per home 2,915 86
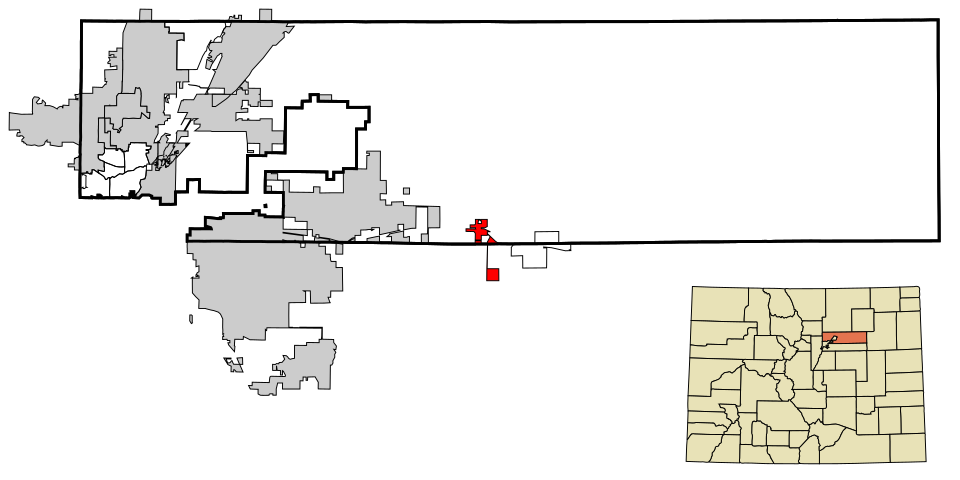
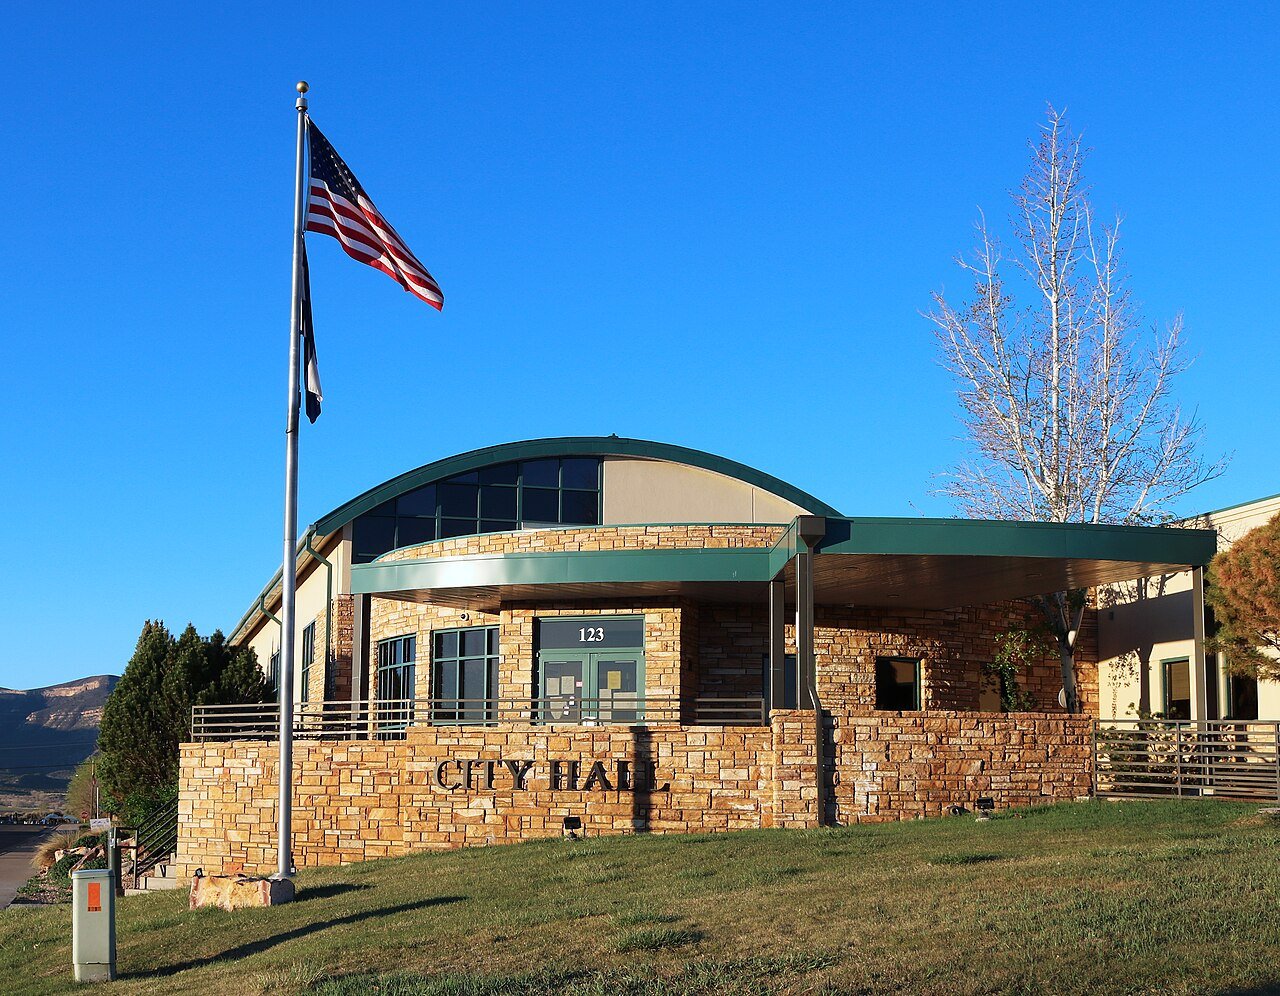
2 Rifle Rifle10,570 people 21.4 per home 1,265 59
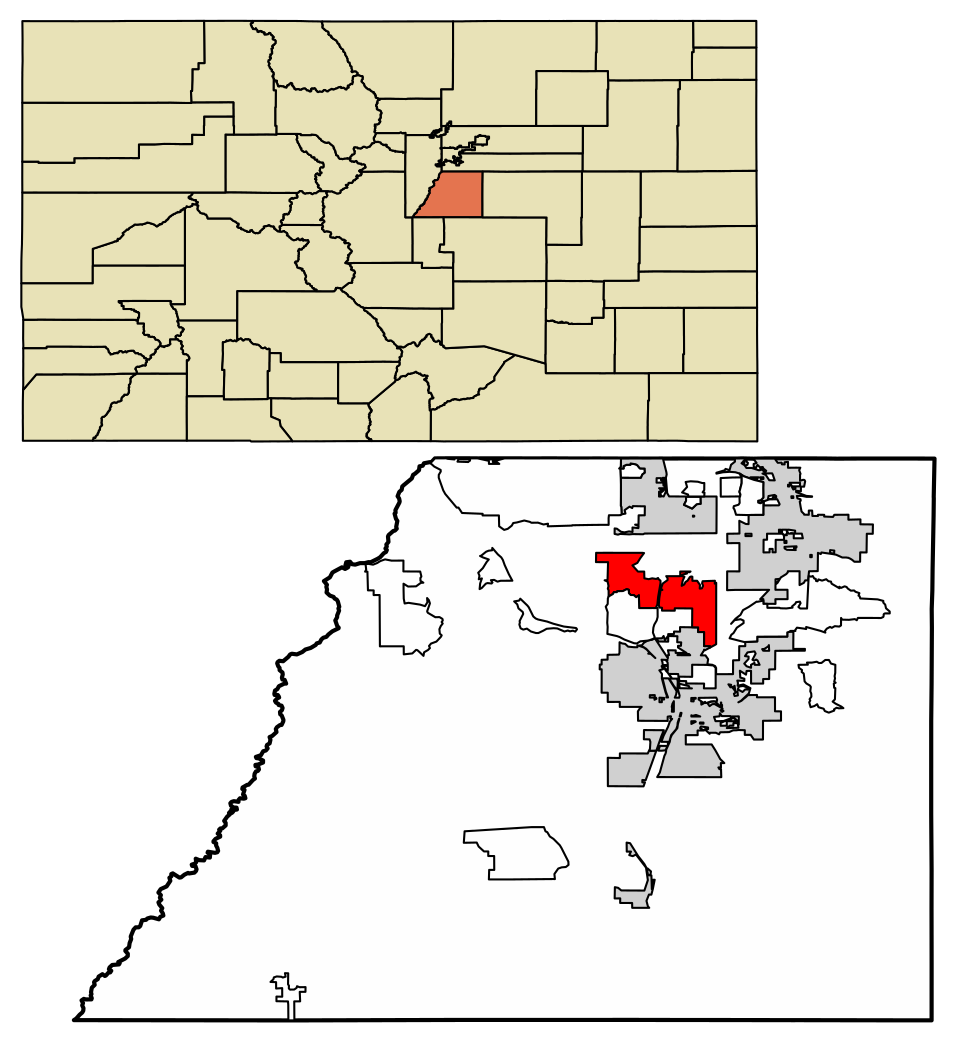
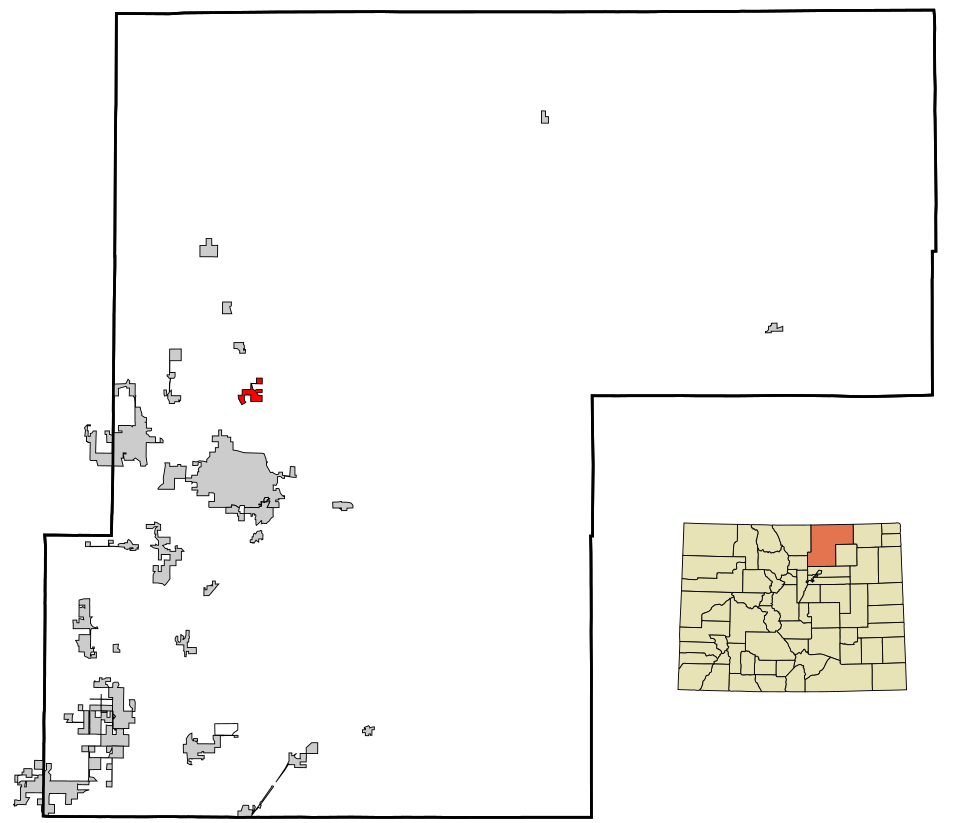
3 Map of Castle Pines Castle Pines13,388 people 16.9 per home 7,422 439
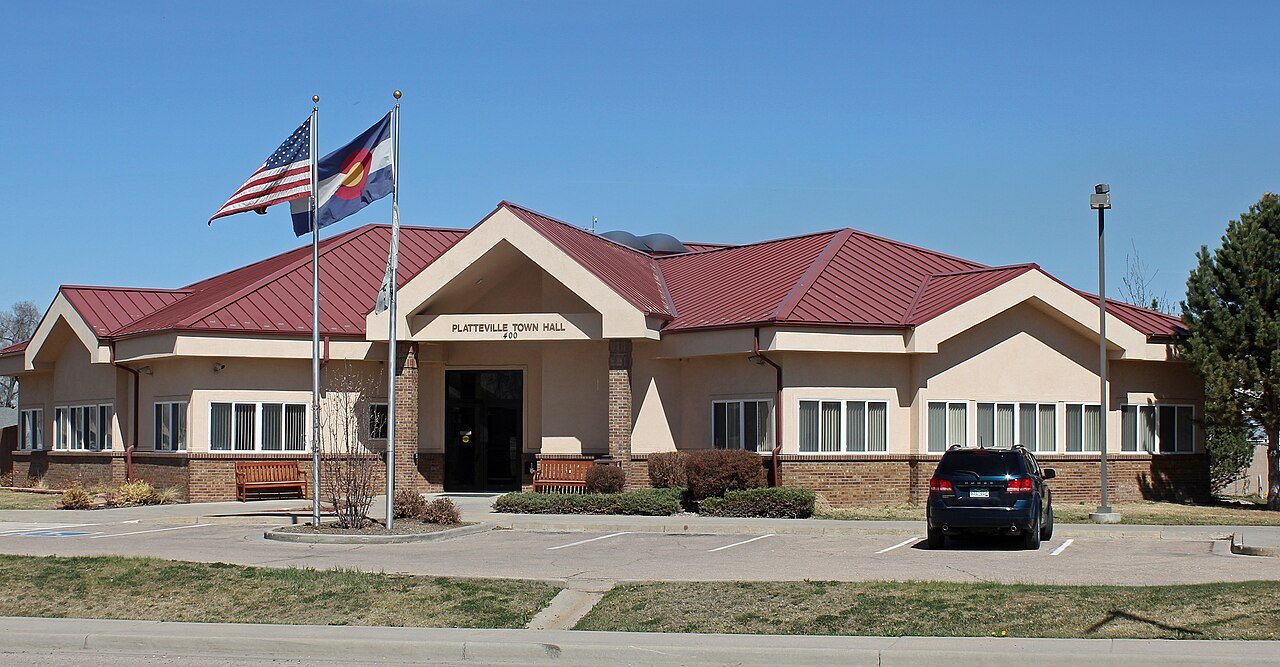
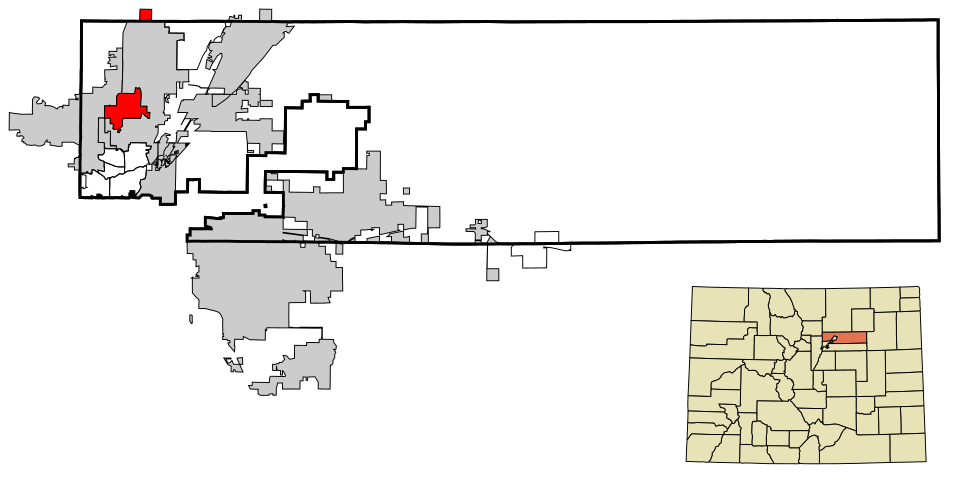
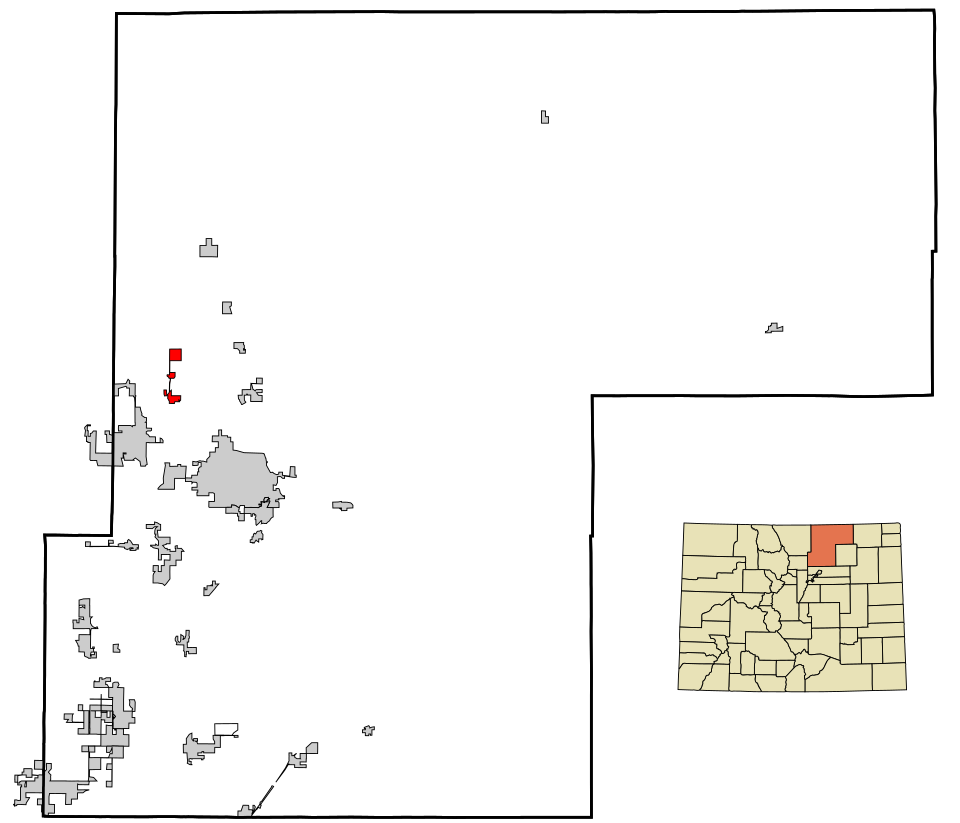
4 Platteville Platteville2,928 people 13.1 per home 470 36
5 Map of Northglenn Northglenn38,014 people 9.2 per home 2,342 255
6 Westminster Westminster115,484 people 7.4 per home 10,203 1,381
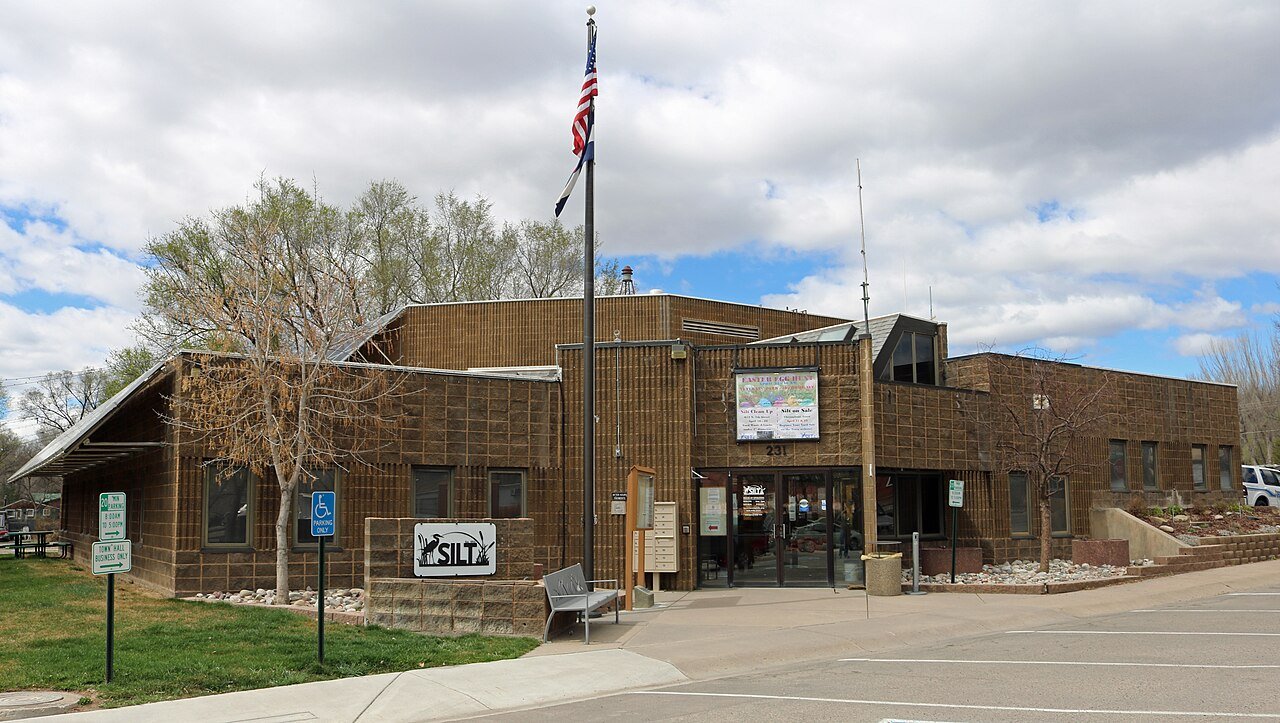
7 Silt Silt3,642 people 7.4 per home 606 82
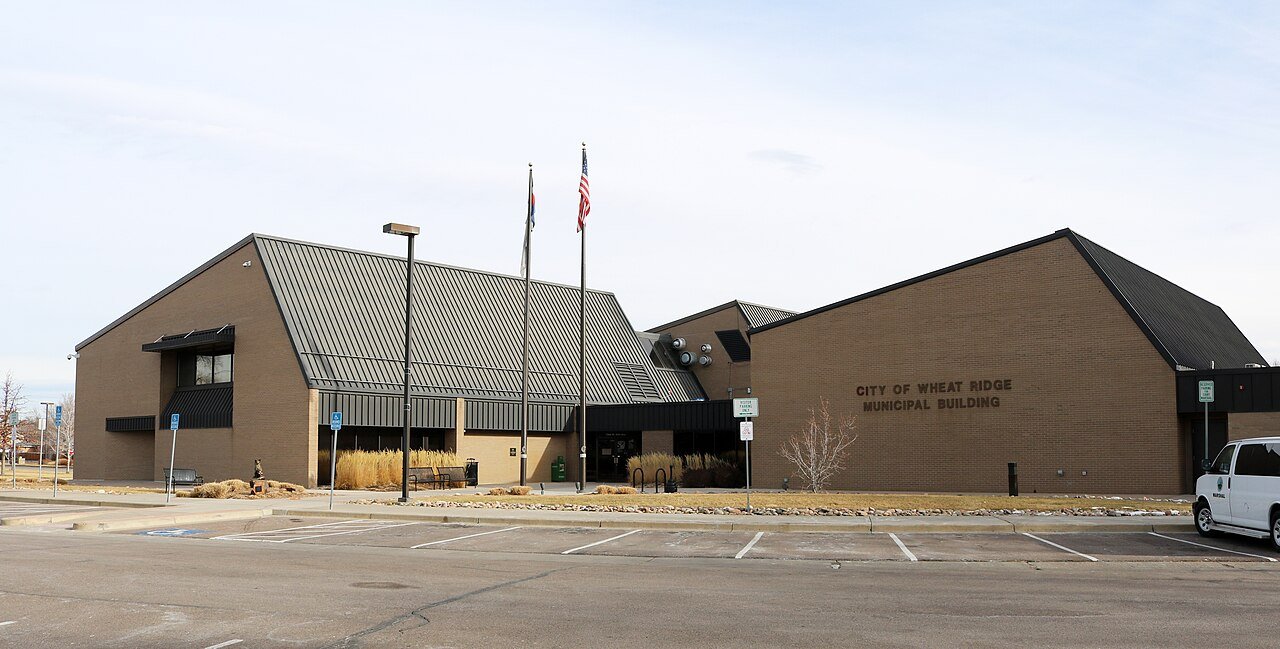
8 Wheat Ridge Wheat Ridge32,070 people 6.8 per home 2,232 327
9 Centennial Centennial108,201 people 4.8 per home 8,041 1,671
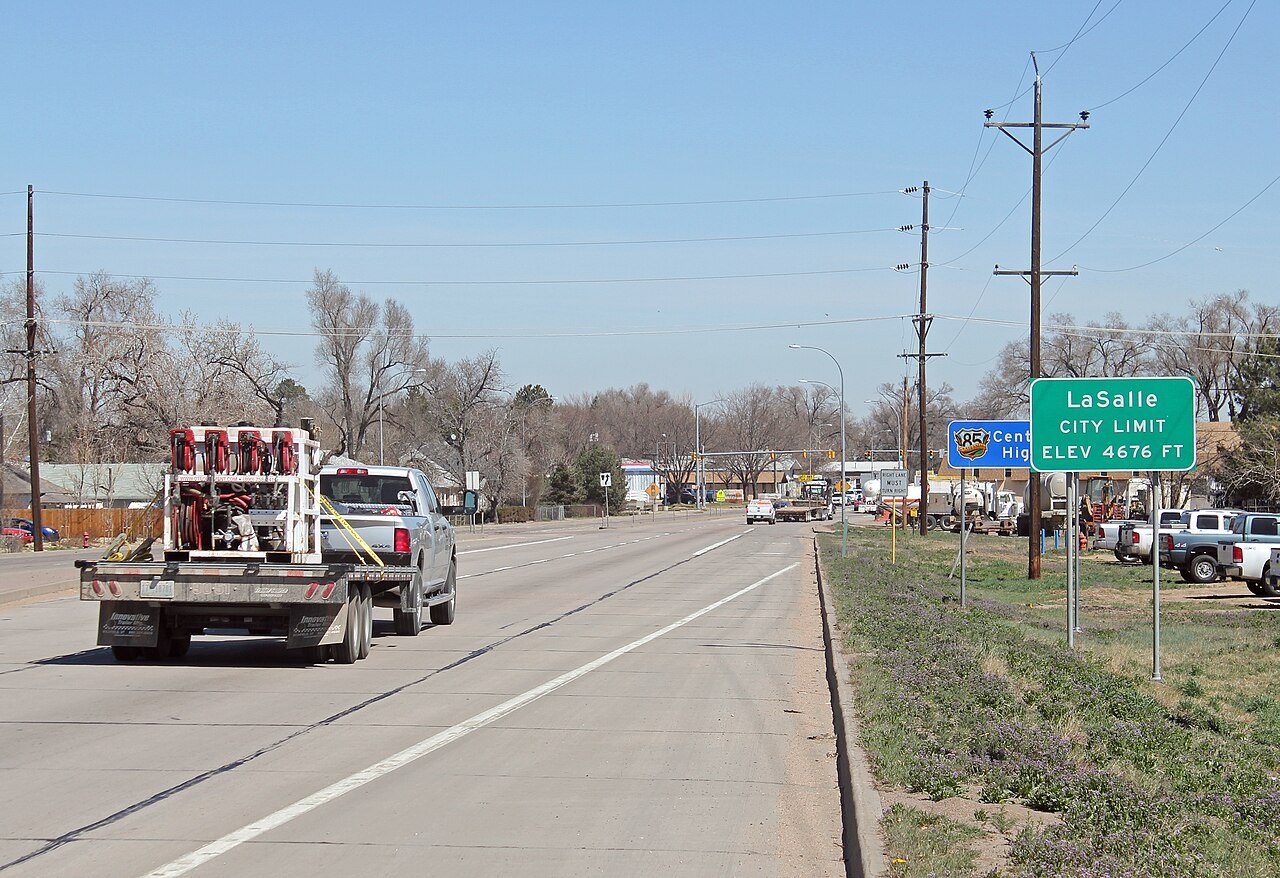
10 La Salle La Salle3,061 people 4.3 per home 404 95
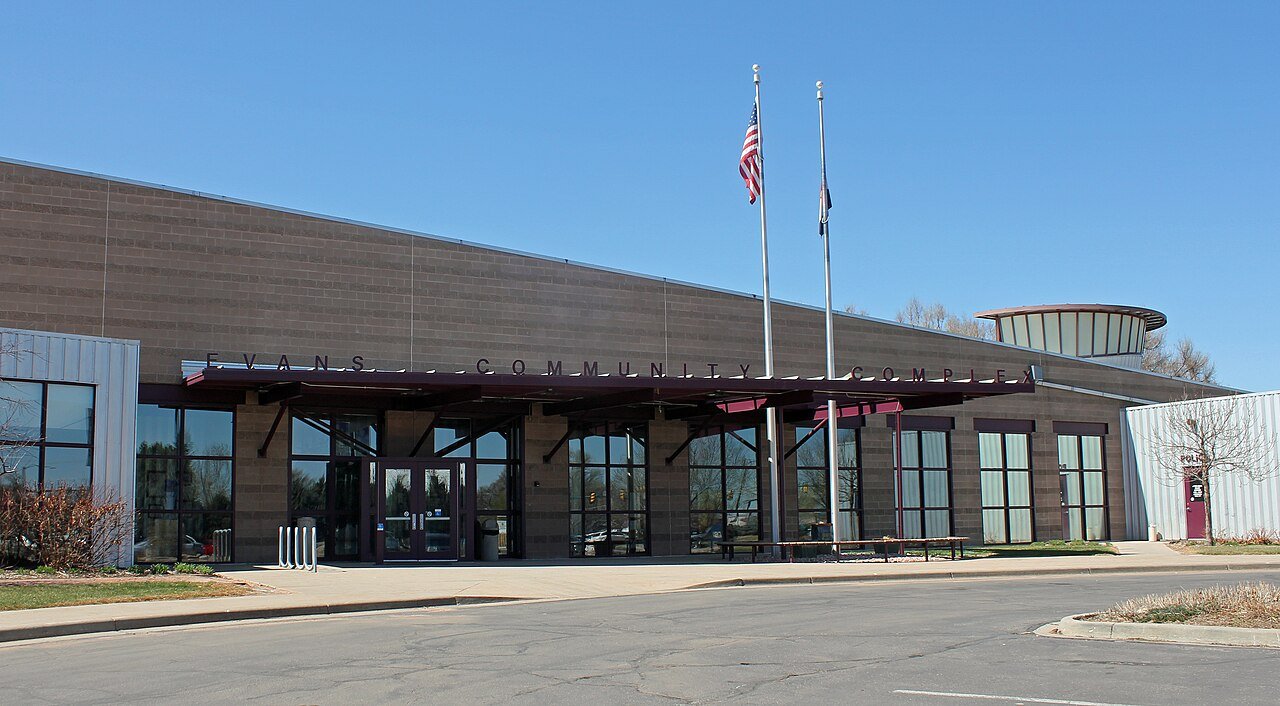
11 Evans Evans22,396 people 4.1 per home 3,628 882
12 Greenwood Village Greenwood Village15,420 people 4.0 per home 1,766 438
13 Snowmass Village Snowmass Village2,972 people 4.0 per home 270 67
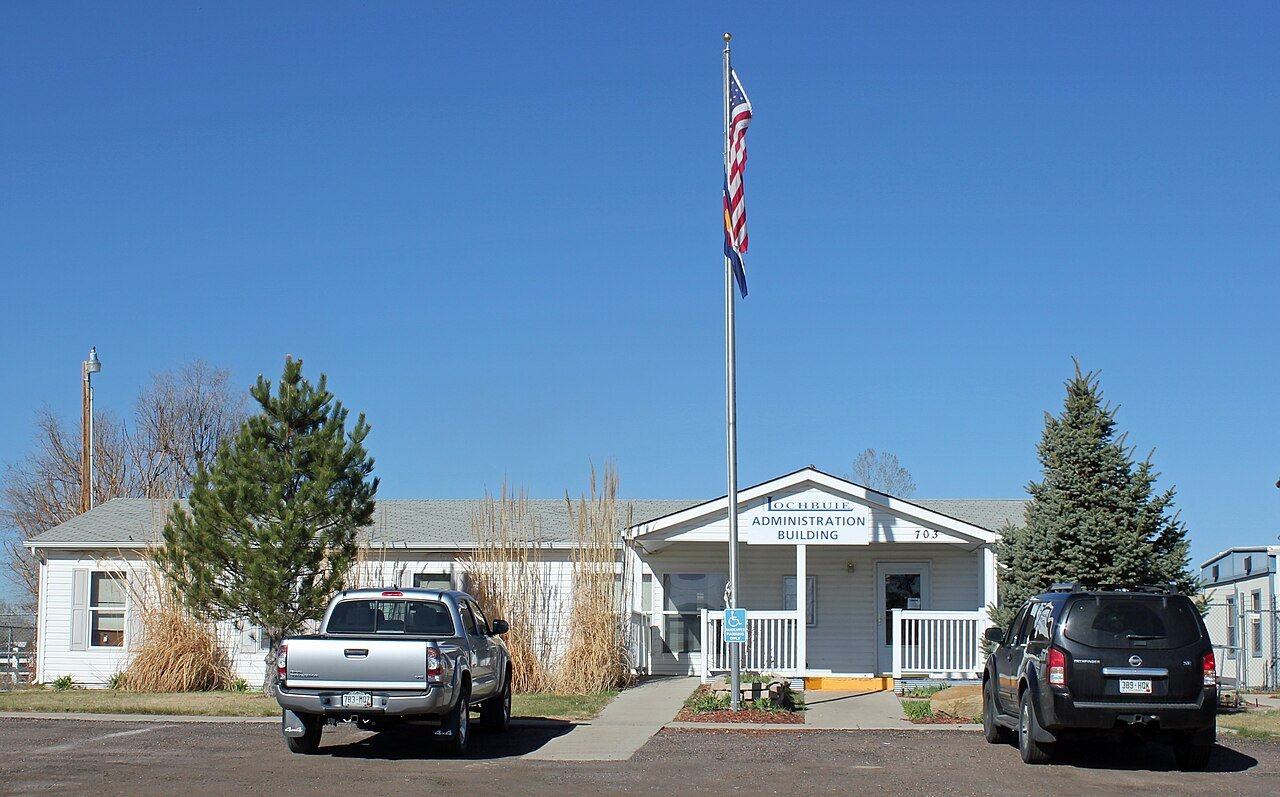
14 Lochbuie Lochbuie8,609 people 4.0 per home 3,362 842
15 Cherry Hills Village Cherry Hills Village6,354 people 4.0 per home 455 114
16 Windsor Windsor37,914 people 3.9 per home 14,072 3,575
17 Sheridan Sheridan6,005 people 3.9 per home 441 112
18 Aurora Aurora394,432 people 3.9 per home 61,183 15,713
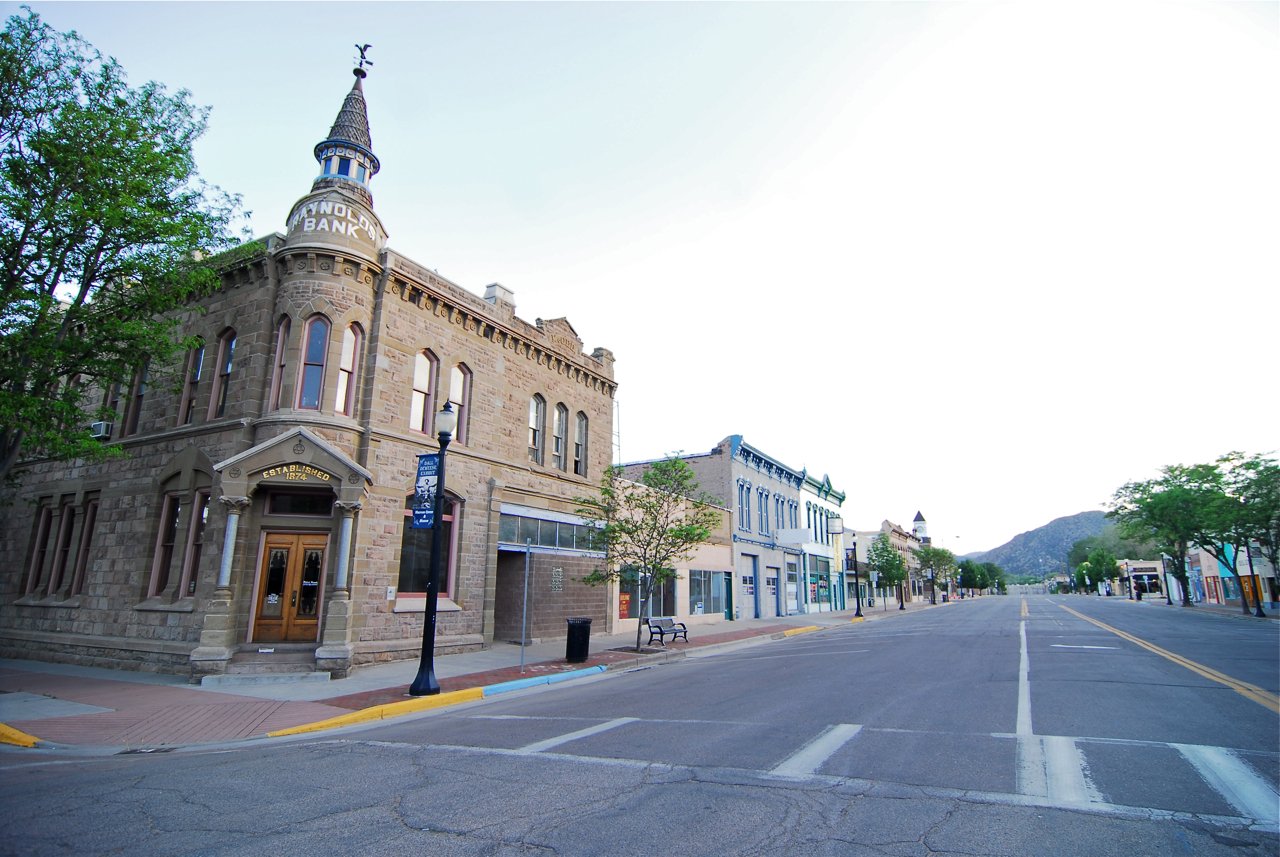
19 Cañon City Cañon City17,122 people 3.8 per home 741 193
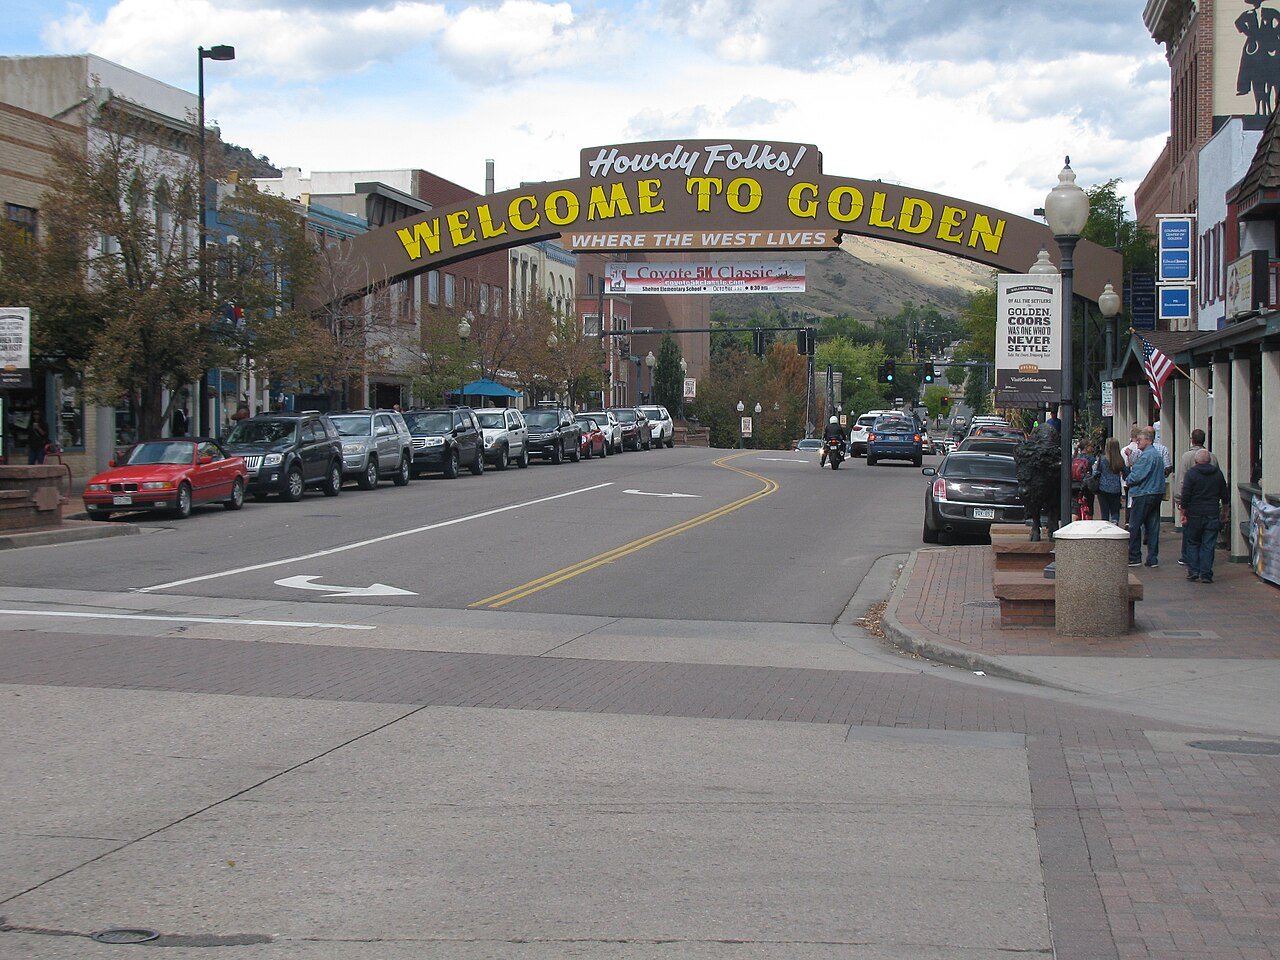
20 Golden Golden20,417 people 3.8 per home 1,532 400
21 Commerce City Commerce City66,445 people 3.8 per home 16,505 4,326
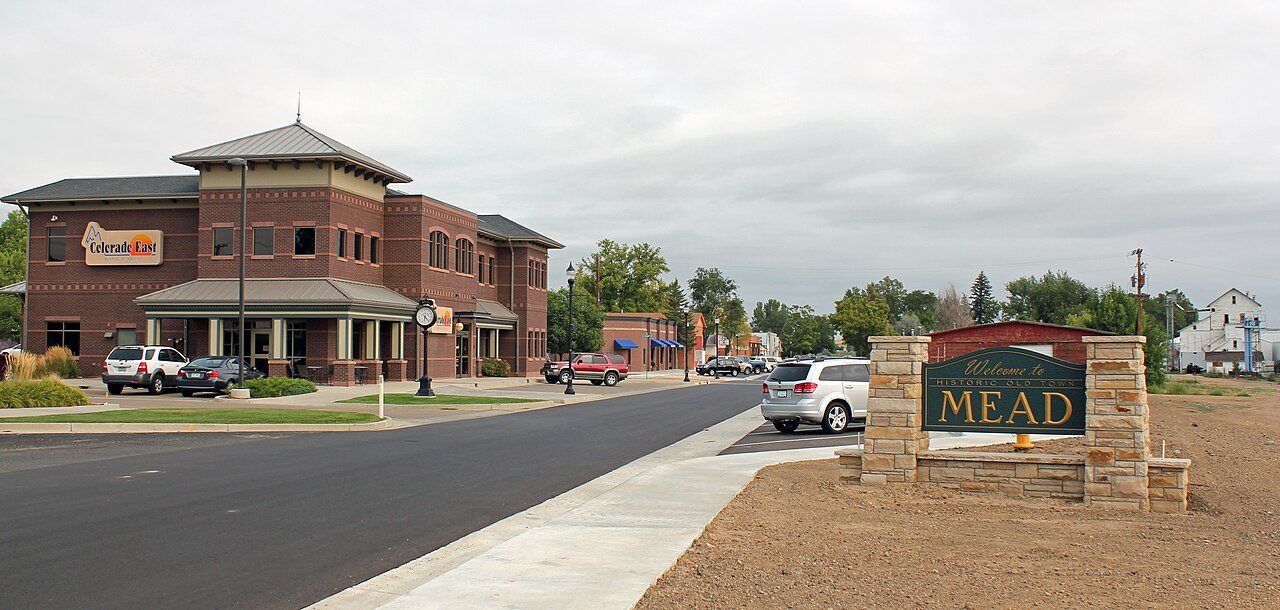
22 Mead Mead5,919 people 3.8 per home 1,376 364
23 Fort Morgan Fort Morgan11,605 people 3.6 per home 282 79
24 Eagle Eagle7,442 people 3.5 per home 1,003 284
25 Map of Gypsum Gypsum8,941 people 3.5 per home 1,563 444
26 Dacono Dacono6,530 people 3.5 per home 2,145 611
27 Thornton Thornton144,187 people 3.4 per home 23,095 6,862
28 Greeley Greeley110,806 people 3.4 per home 15,906 4,714
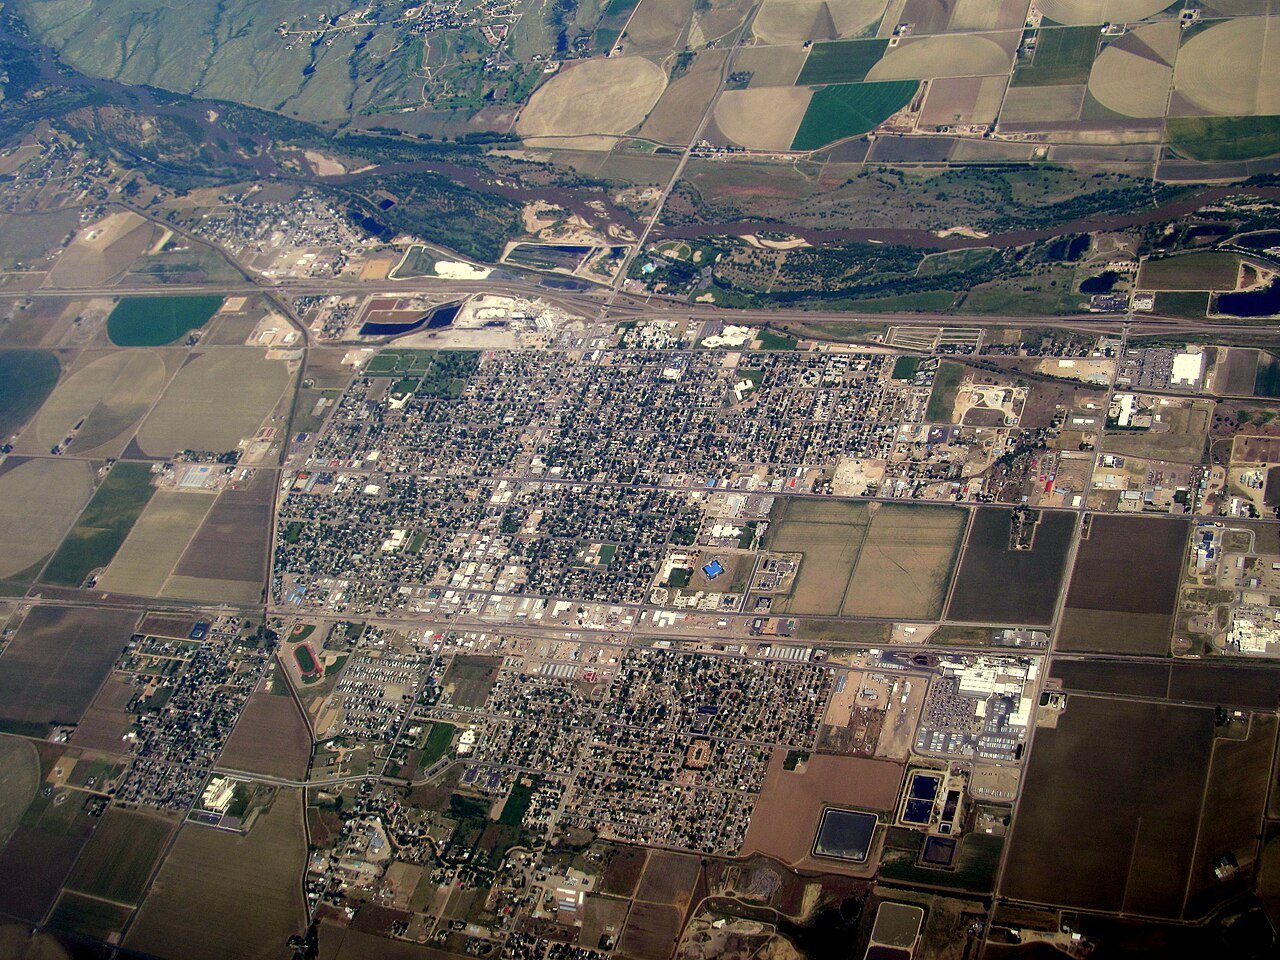
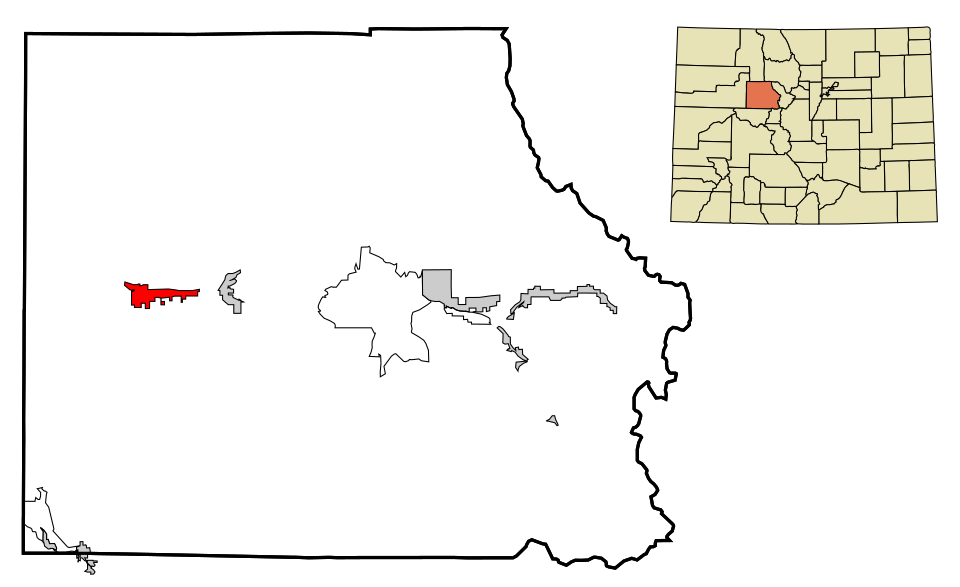
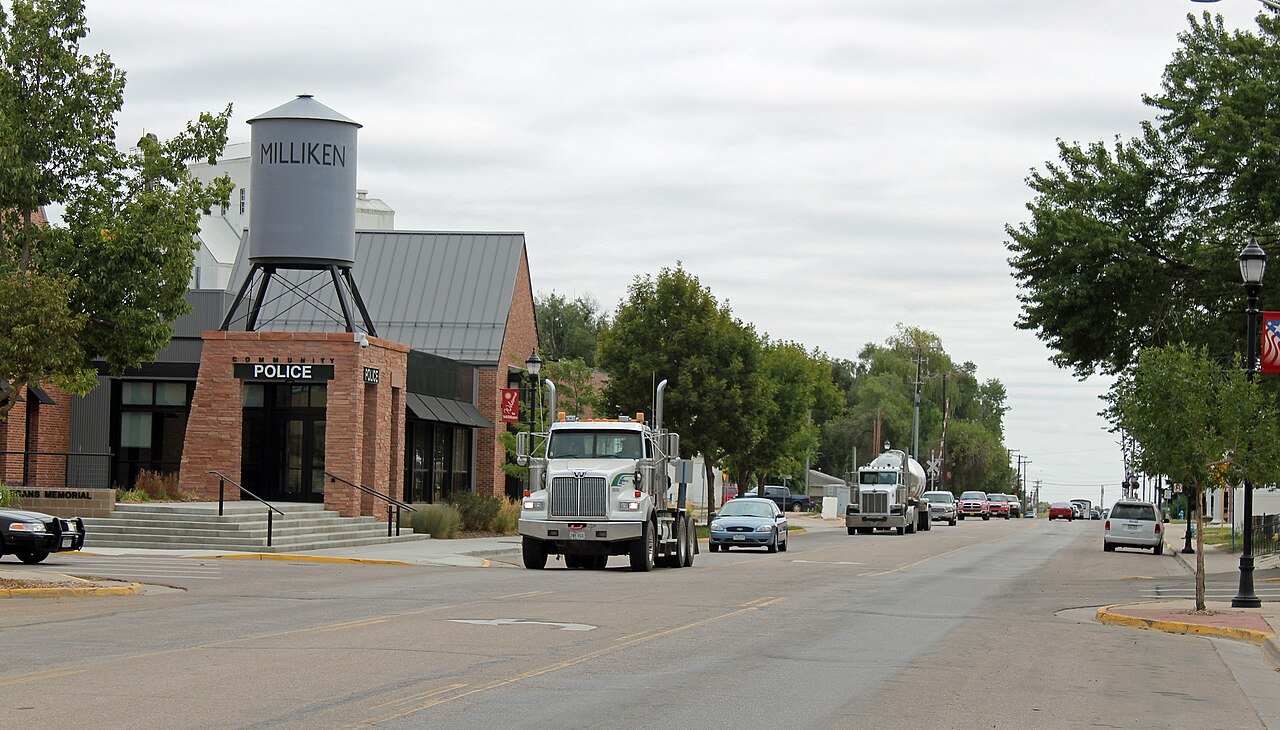
29 Milliken Milliken8,871 people 3.4 per home 2,776 829
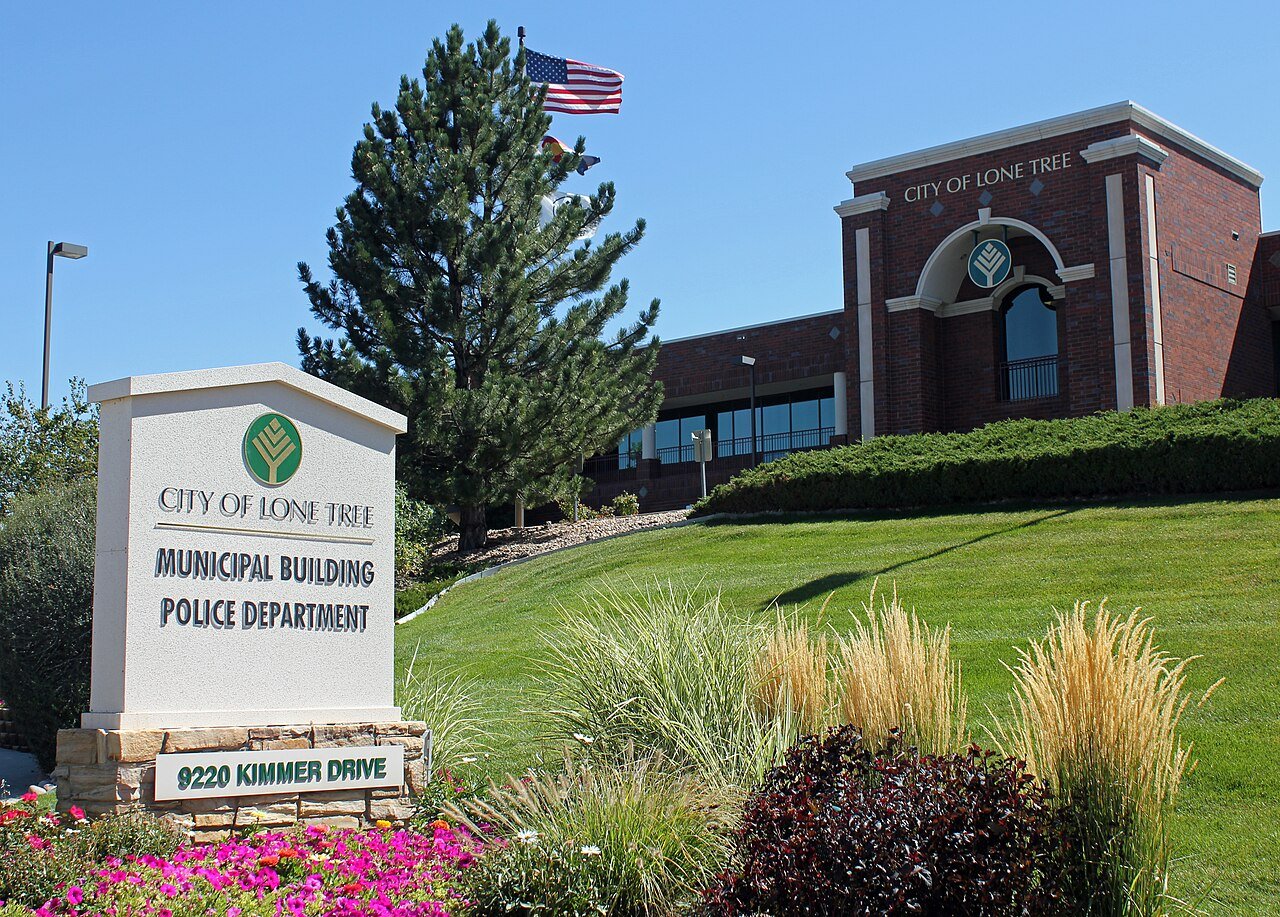
30 Lone Tree Lone Tree14,147 people 3.3 per home 4,035 1,226
31 Map of Erie Erie33,808 people 3.3 per home 11,903 3,637
32 Brighton Brighton42,059 people 3.2 per home 6,731 2,102
33 Arvada Arvada122,634 people 3.1 per home 17,969 5,758
34 Frederick Frederick16,651 people 3.1 per home 5,834 1,883
35 Map of Eaton Eaton5,867 people 3.1 per home 1,437 466
36 Map of Severance Severance10,130 people 3.1 per home 4,518 1,483
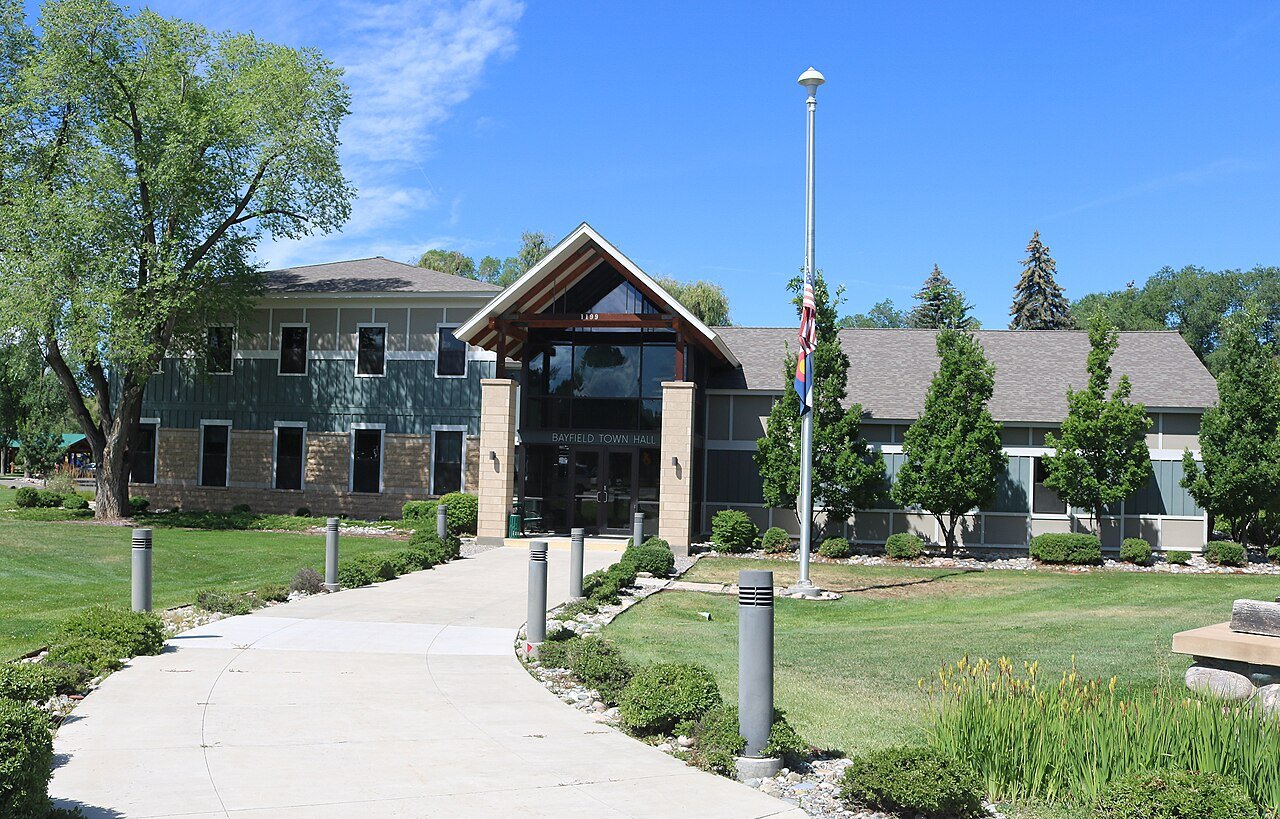
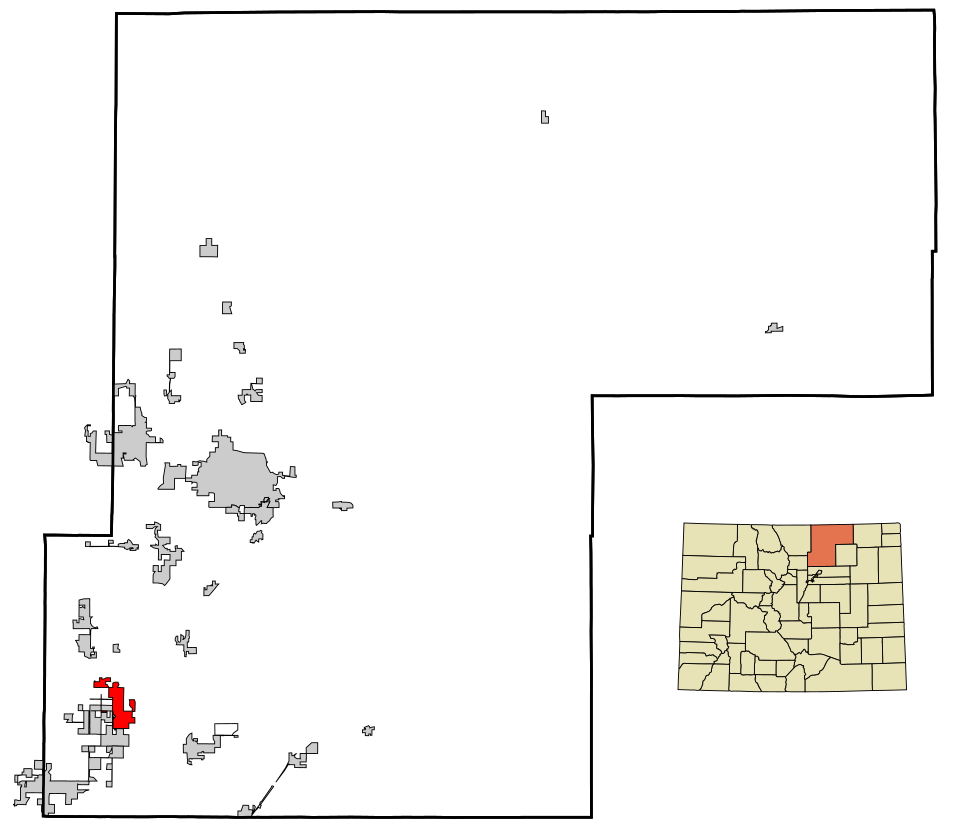
37 Bayfield Bayfield2,901 people 3.0 per home 505 168
38 Map of Bennett Bennett3,663 people 3.0 per home 554 188
39 Wellington Wellington11,798 people 2.9 per home 4,758 1,616
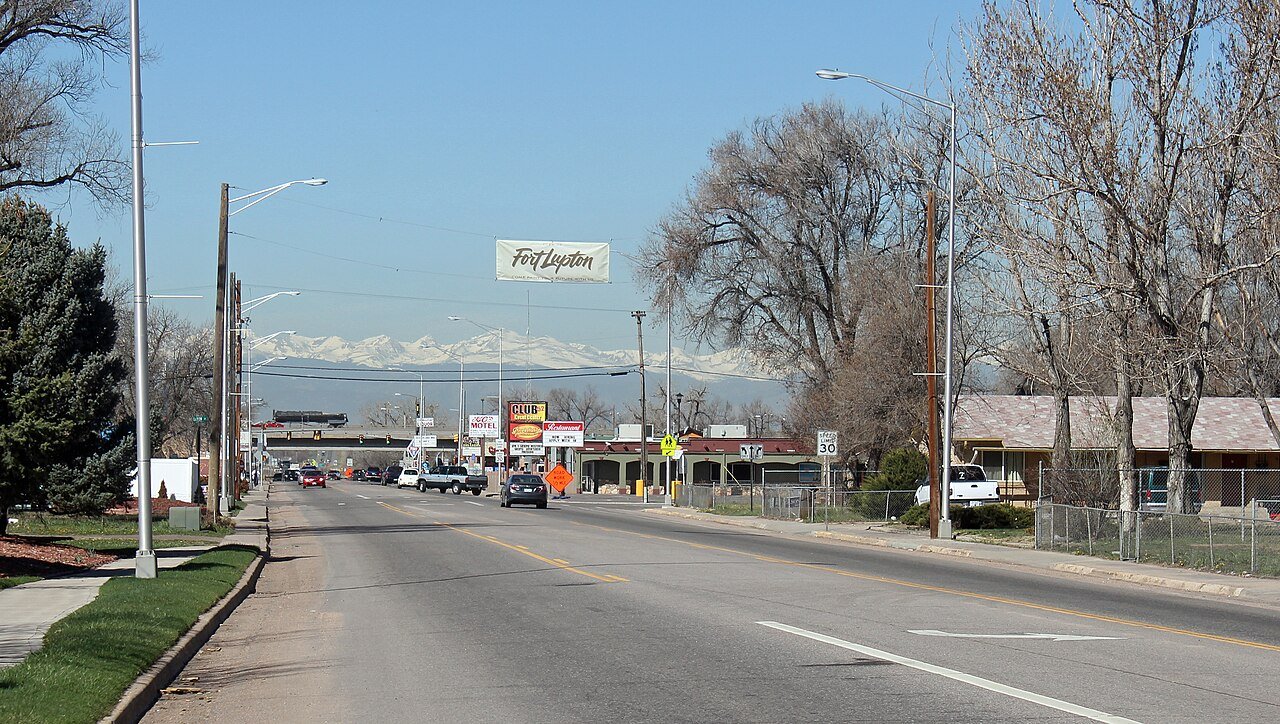
40 Fort Lupton Fort Lupton8,897 people 2.9 per home 578 197
41 Map of Firestone Firestone18,049 people 2.9 per home 6,234 2,132
42 Castle Rock Castle Rock79,123 people 2.8 per home 24,927 8,821
43 Timnath Timnath8,941 people 2.8 per home 5,862 2,105
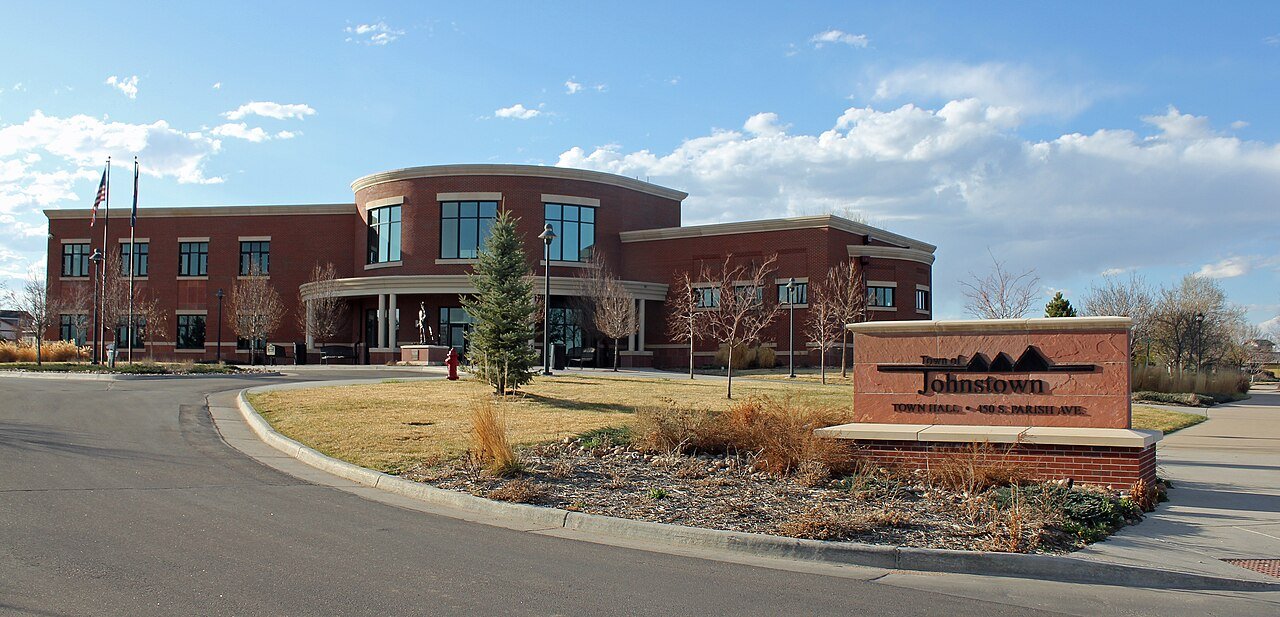
44 Johnstown Johnstown18,883 people 2.8 per home 7,416 2,682
45 Map of Broomfield Broomfield76,304 people 2.7 per home 18,223 6,724
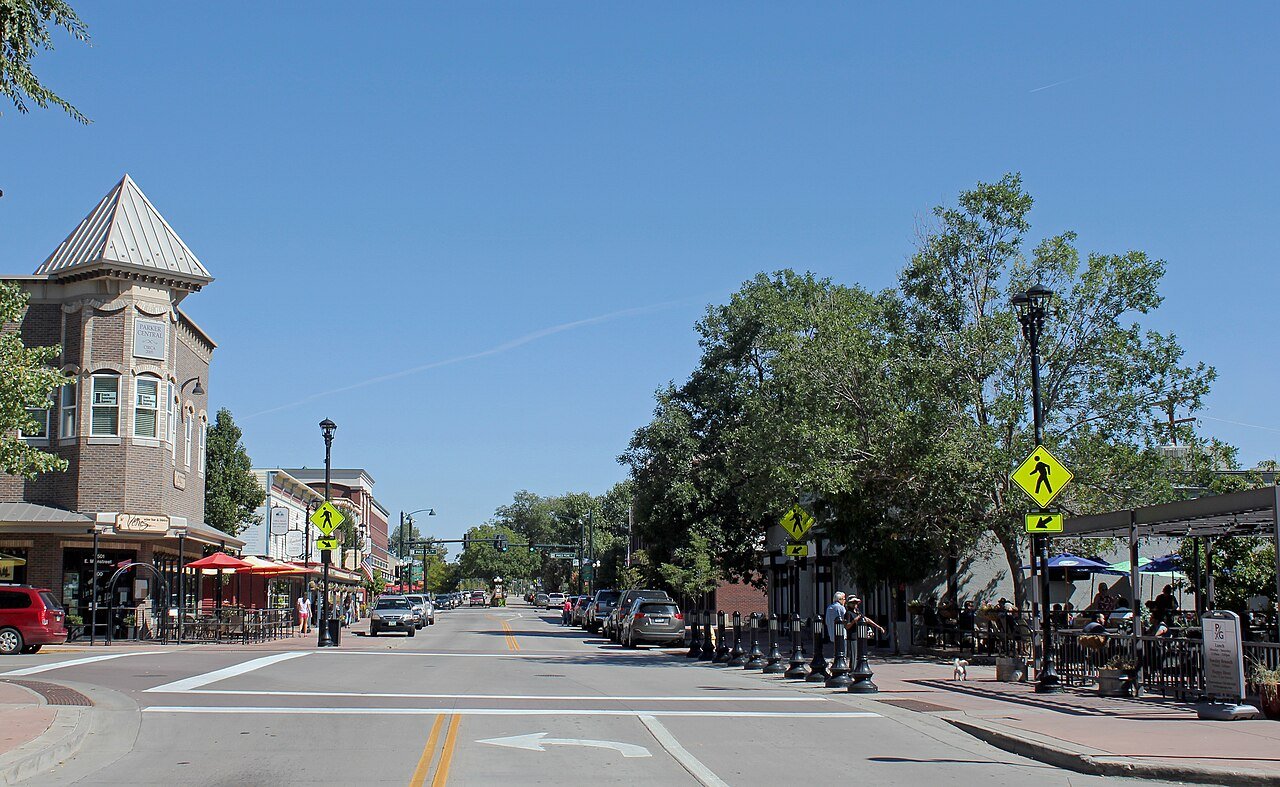
46 Parker Parker61,783 people 2.5 per home 13,215 5,241
47 Cortez Cortez8,976 people 2.5 per home 284 114
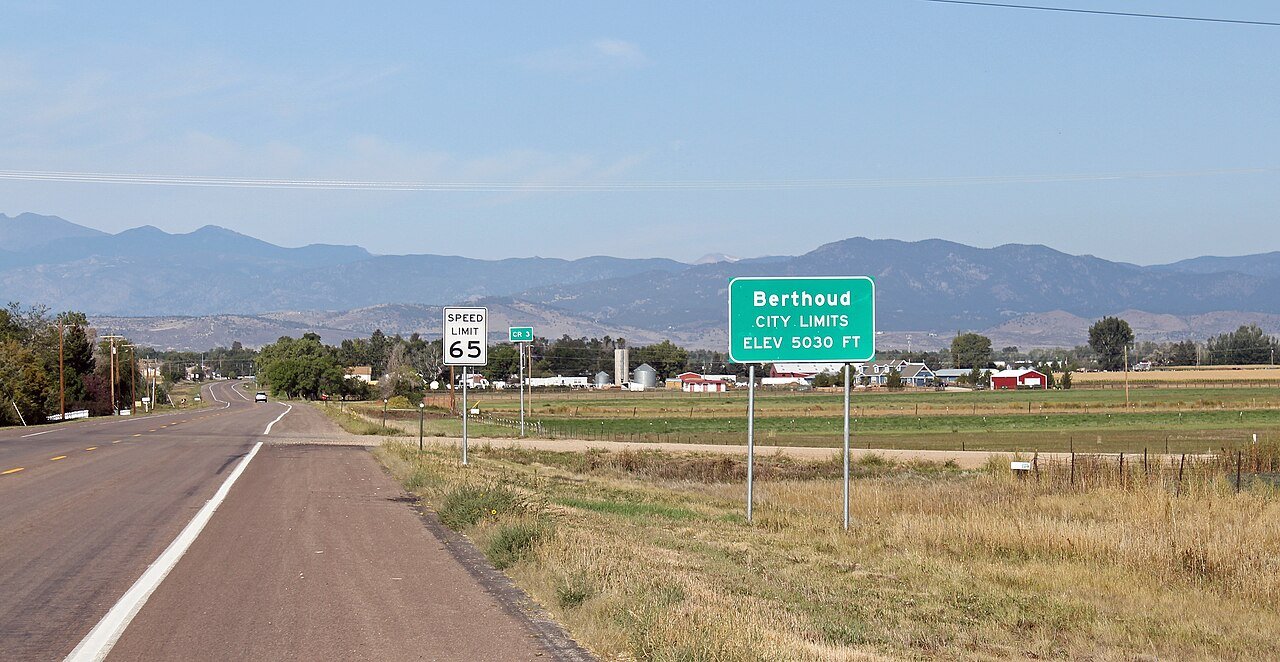
48 Berthoud Berthoud12,411 people 2.5 per home 5,227 2,104
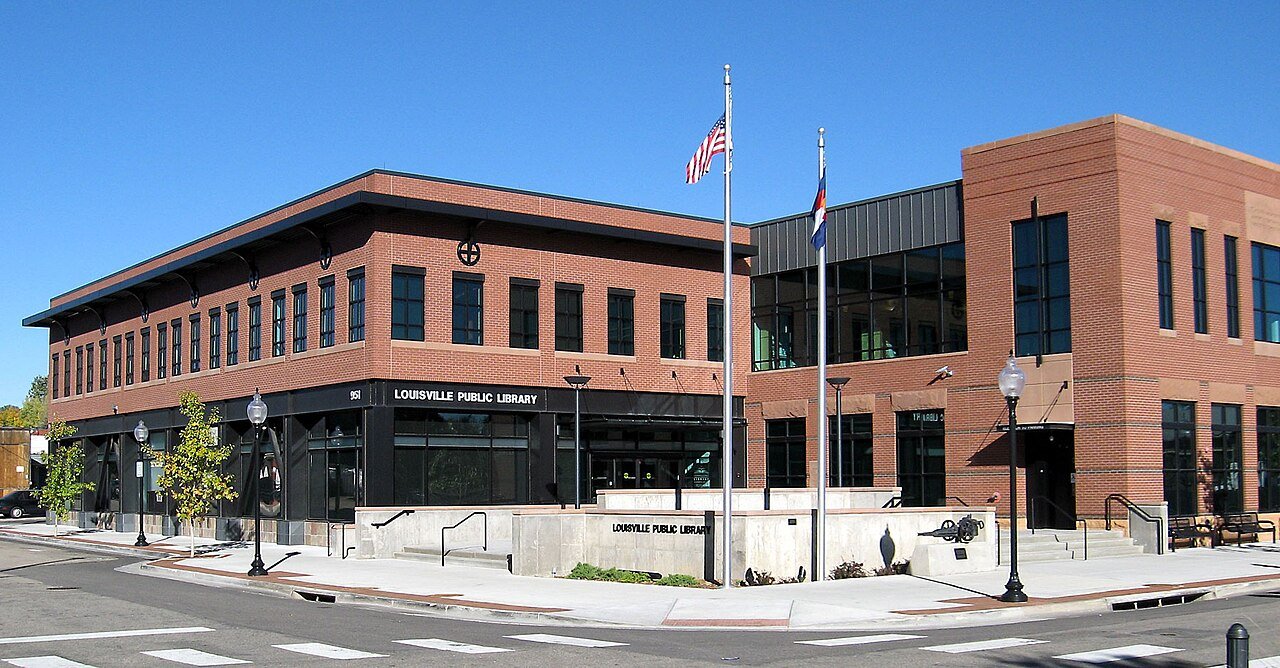
49 Louisville Louisville20,786 people 2.5 per home 2,850 1,156
50 Alamosa Alamosa9,879 people 2.3 per home 1,026 454
51 Longmont Longmont99,406 people 2.2 per home 12,615 5,722
52 Englewood Englewood34,129 people 2.2 per home 3,404 1,550
53 Glenwood Springs Glenwood Springs10,241 people 2.0 per home 349 174
54 Map of Lafayette Lafayette30,602 people 2.0 per home 5,958 2,980
55 Map of Lakewood Lakewood156,583 people 2.0 per home 13,004 6,605
56 Loveland Loveland78,410 people 1.9 per home 9,519 4,972
57 Littleton Littleton44,710 people 1.9 per home 3,915 2,072
58 New Castle New Castle4,880 people 1.9 per home 405 218
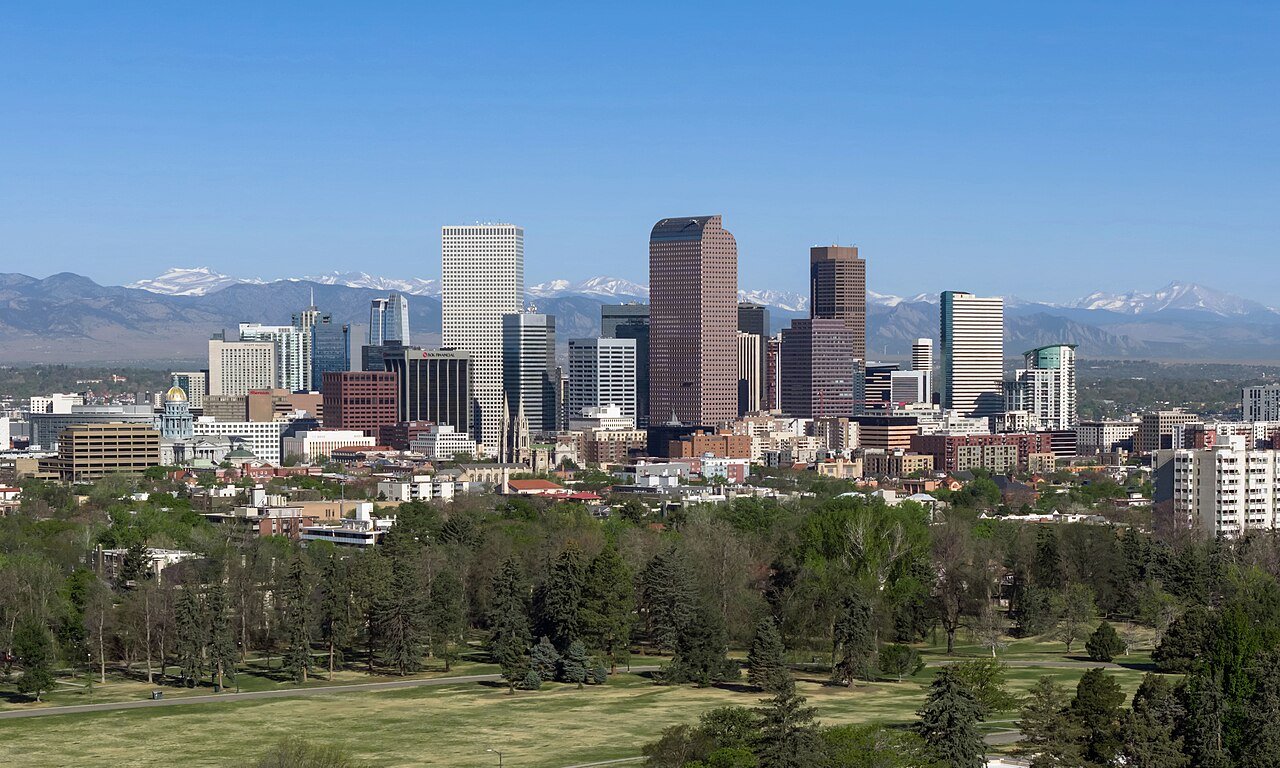
59 Denver Denver718,877 people 1.8 per home 115,364 62,799
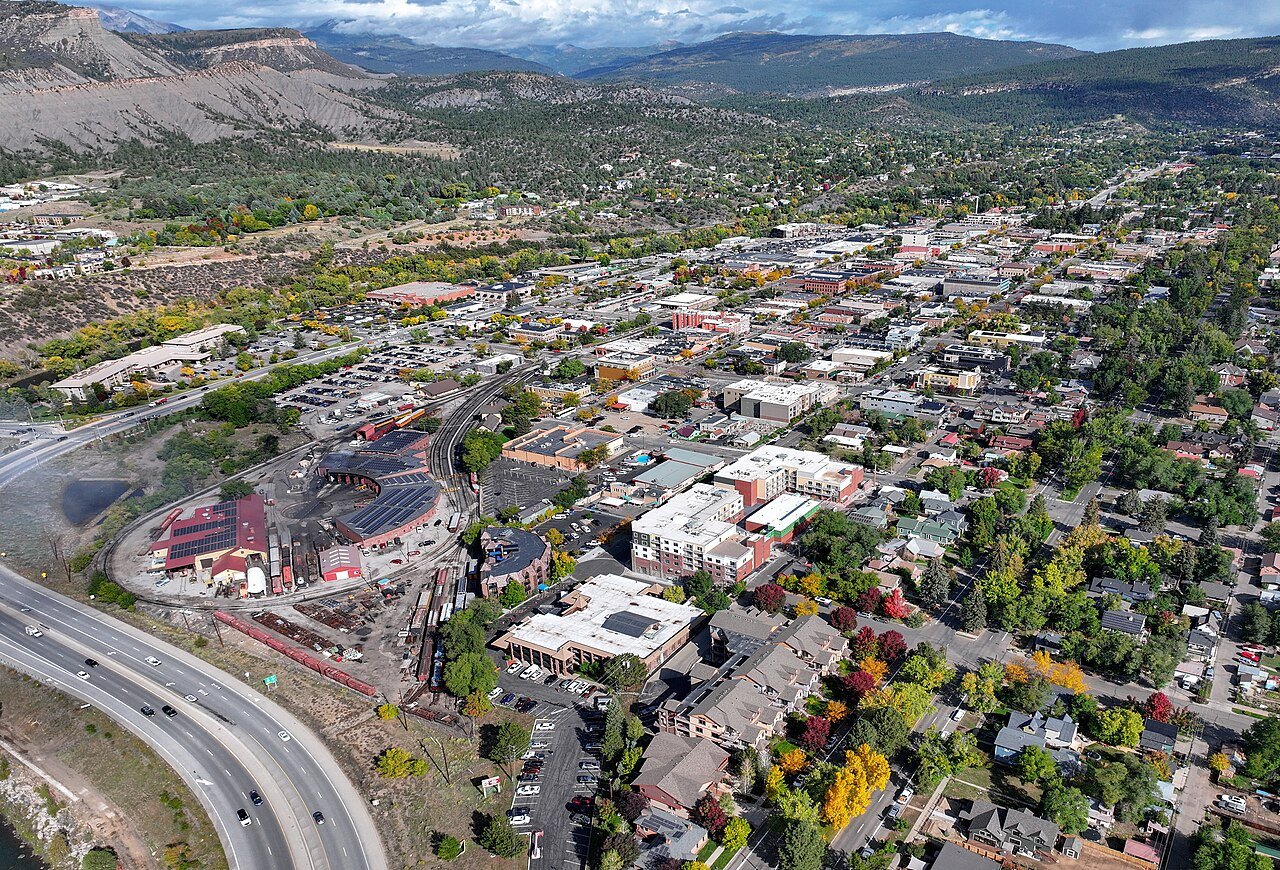
60 Durango Durango19,411 people 1.8 per home 2,184 1,235
61 Superior Superior13,305 people 1.8 per home 611 346
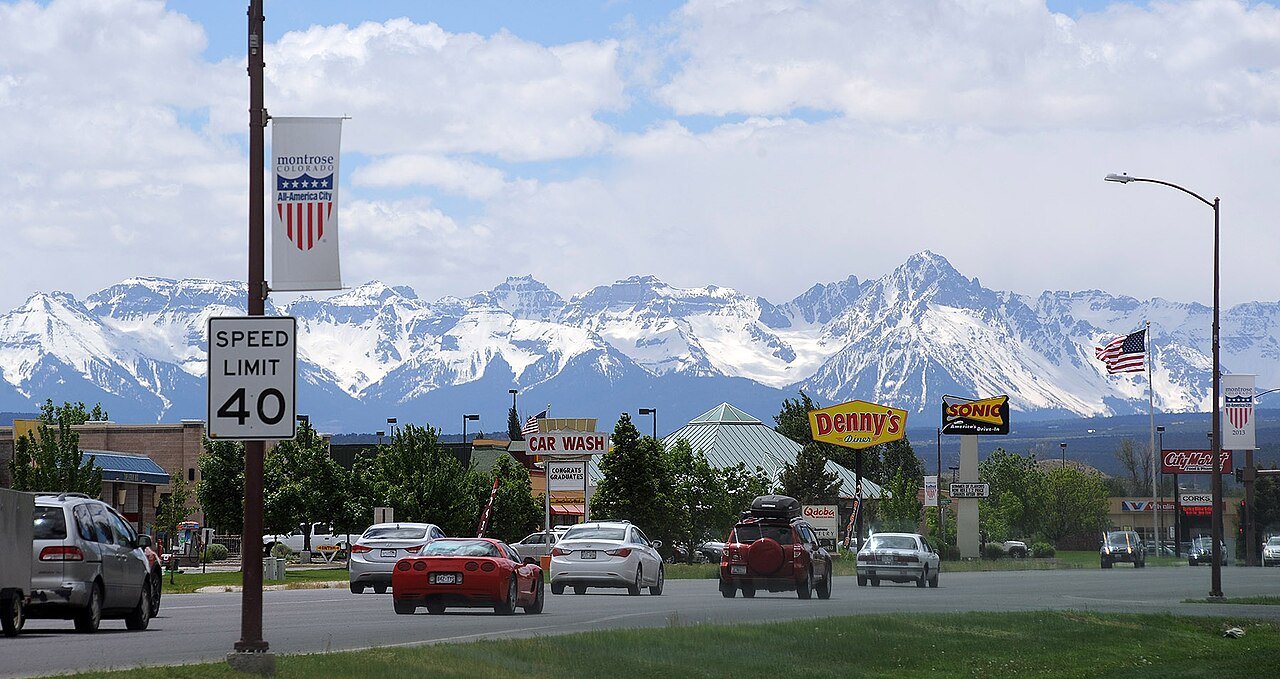
62 Montrose Montrose21,044 people 1.6 per home 1,159 717
63 Map of Aspen Aspen6,756 people 1.3 per home 346 263
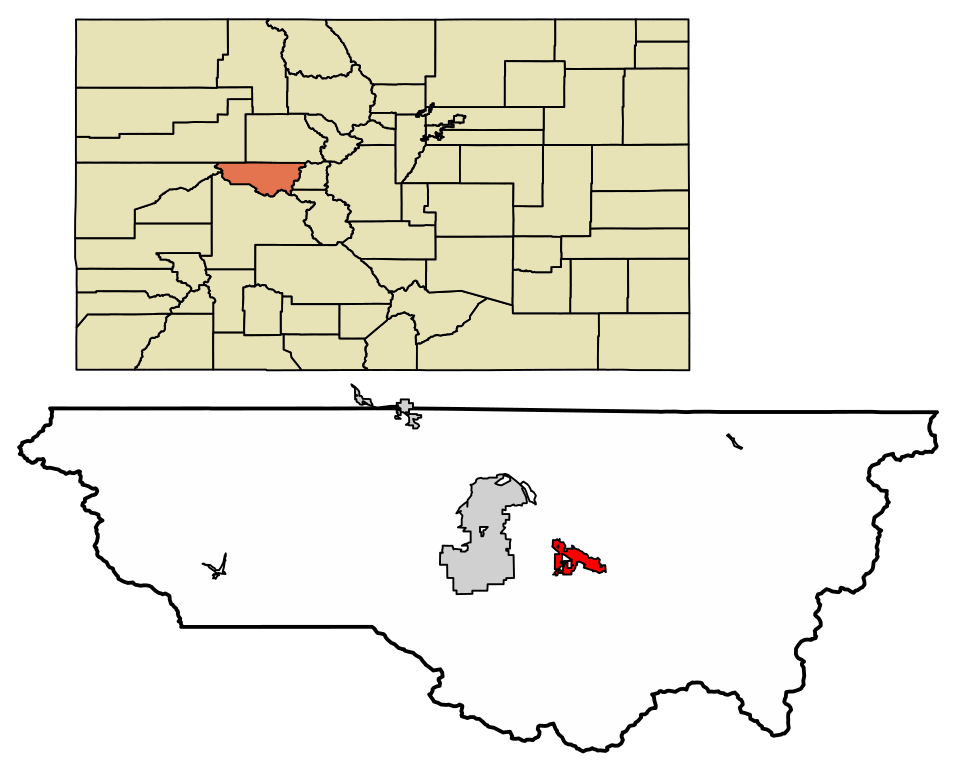
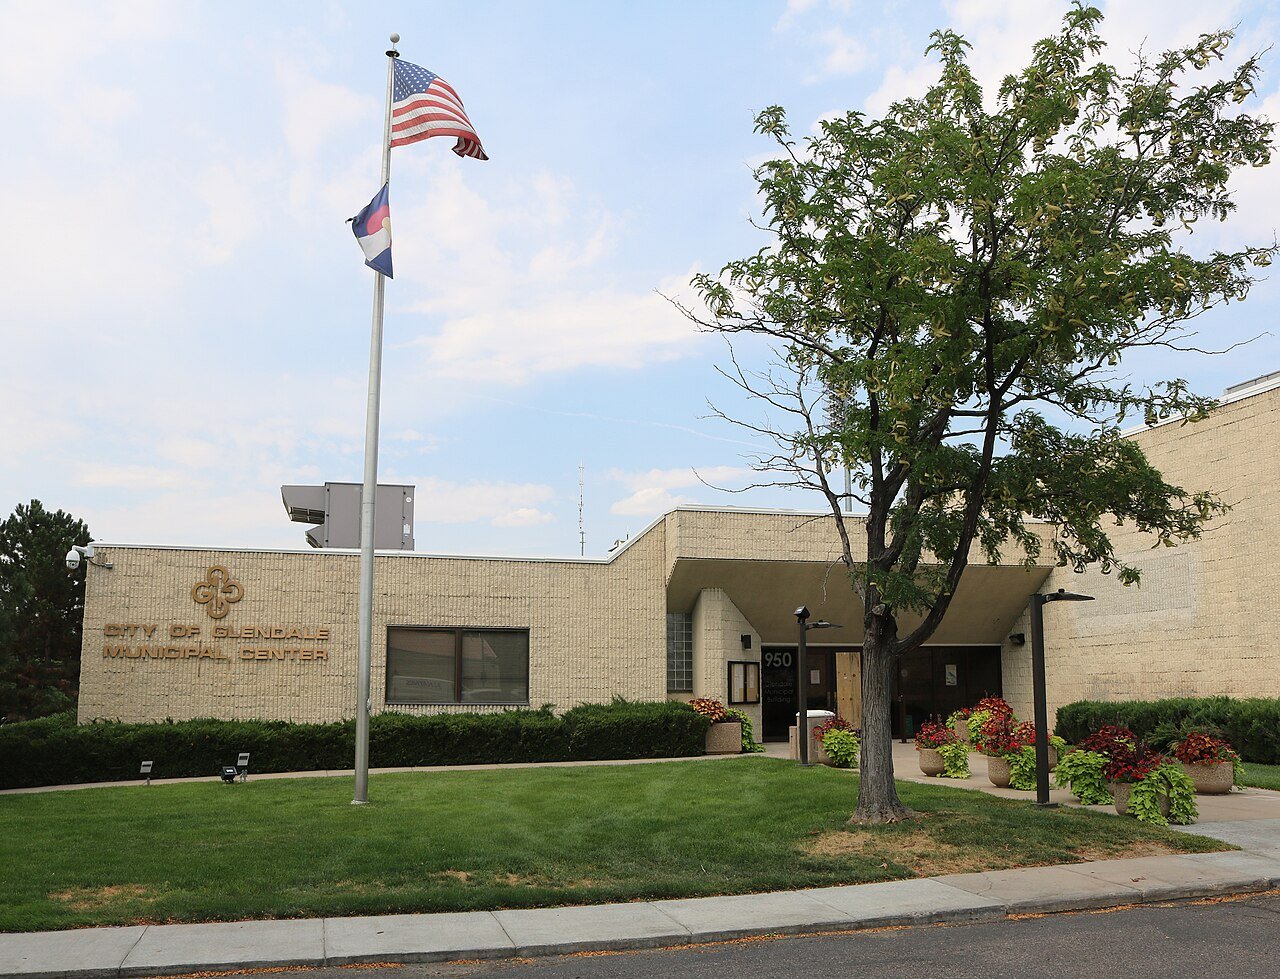
64 Glendale Glendale4,531 people 1.3 per home 429 341
65 Breckenridge Breckenridge4,959 people 1.0 per home 538 562
66 Map of Silverthorne Silverthorne4,815 people 0.8 per home 515 667

How this ranking works

We take each town’s population change between the 2010 and 2020 censuses and divide it by the new homes its building permits authorized over 2010–2019. The result is how many new residents arrived for every new home. A high number means people came faster than homes were built, so existing homes filled up: larger households, fewer vacancies and tighter supply. The highest ratio ranks #1. Across Colorado it’s 2.5 per home.

Only towns that gained at least 250 residents and permitted at least 10 homes are ranked, because a ratio built on a handful of either is noise. College towns, where 20% or more of residents are enrolled in college, are left out: a growing college adds dorm students as residents, but dorms never show up as permitted homes.

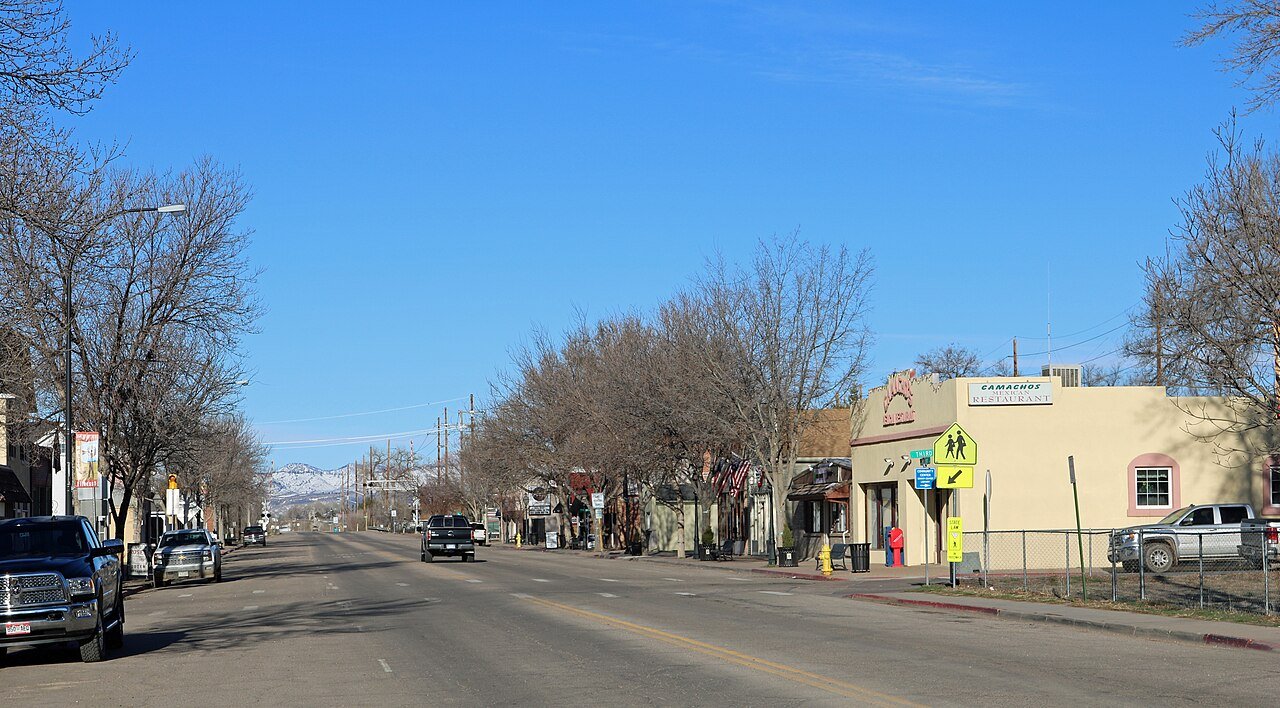
Only towns with at least 2,500 residents are ranked; Census estimates for smaller places are too uncertain. Population and income: U.S. Census Bureau American Community Survey 5-year estimates. New homes: U.S. Census Bureau Building Permits Survey. Residents: 2010 and 2020 decennial censuses. Town photos: Wikimedia Commons, credited on each town’s page.

Same ranking in other states