2009 · VDL Odette in California · Wikimedia Commons
Rancho Murieta’s story
Rancho Murieta in pictures
2 postcards, papers and photographs from public archives.
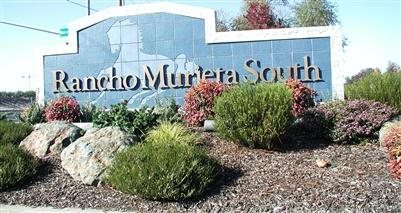
A town of 5,875. Nearly 26.3% of it is conserved land.
The 2 things Rancho Murieta does most differently from other towns.
Where Rancho Murieta’s working residents go each day. Line width shows the share.
Census LEHD 2023
Be the first to start the conversation.
Ordered by what stands out in Rancho Murieta. Another town gets a different order.
4.0 miles of trails across 0 parks and preserves.
Rancho Murieta beats the California average on 19 of 32 CDC measures and trails it on 5.
| What stands out | Rancho Murieta | CA |
|---|---|---|
| Fewer adults facing food insecurity | 6.2% | 17.9% |
| Fewer uninsured adults | 3.7% | 10.6% |
| More adults who have had cancer | 12.6% | 6.4% |
Most working residents leave Rancho Murieta for work: only 7% work in town. The top destinations are Sacramento (21%), Elk Grove (7%) and Rancho Cordova (6%). Half commute less than 21 miles.
Expected storm and flood damage is higher than in 76% of U.S. communities.
Rancho Murieta has mild winters and hot summers. A typical July afternoon reaches 95°, a January night drops to 39°, and snow is almost unheard of.
The median sale price was $735,000 in May 2026.
2 postcards, papers and photographs from public archives.
Census-designated place in California, United States
Rancho Murieta is a census-designated place (CDP) and guard-gated community in Sacramento County, California, United States. It is part of the Sacramento–Arden-Arcade–Roseville Metropolitan Statistical Area. The population was 5,903 at the 2020 census, up from 5,488 at the 2010 census. It is located in the foothills of the Sierra Nevada range, about 25 miles (40 km) east of Sacramento.
From Wikipedia, licensed CC BY-SA 4.0 · facts via Wikidata (CC0)