ARArkansas rankings

Towns where housing hasn't kept up with growth in Arkansas

Ranked by how many new residents each town gained for every new home it permitted between the 2010 and 2020 censuses. 53 towns with 2,500+ residents.
U.S. Census ACS 2020–2024 5-year

#TownNew residents per new homeResidents gainedHomes permitted
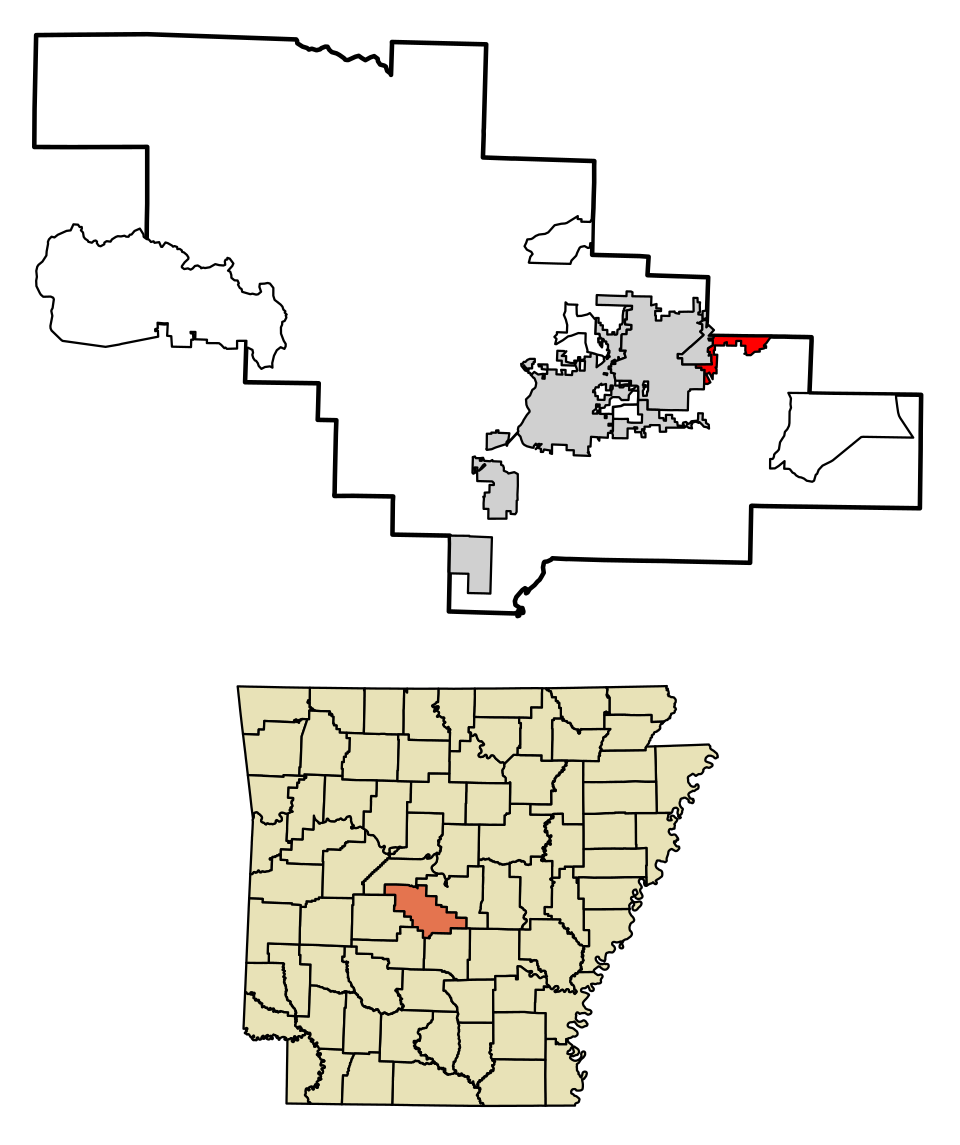
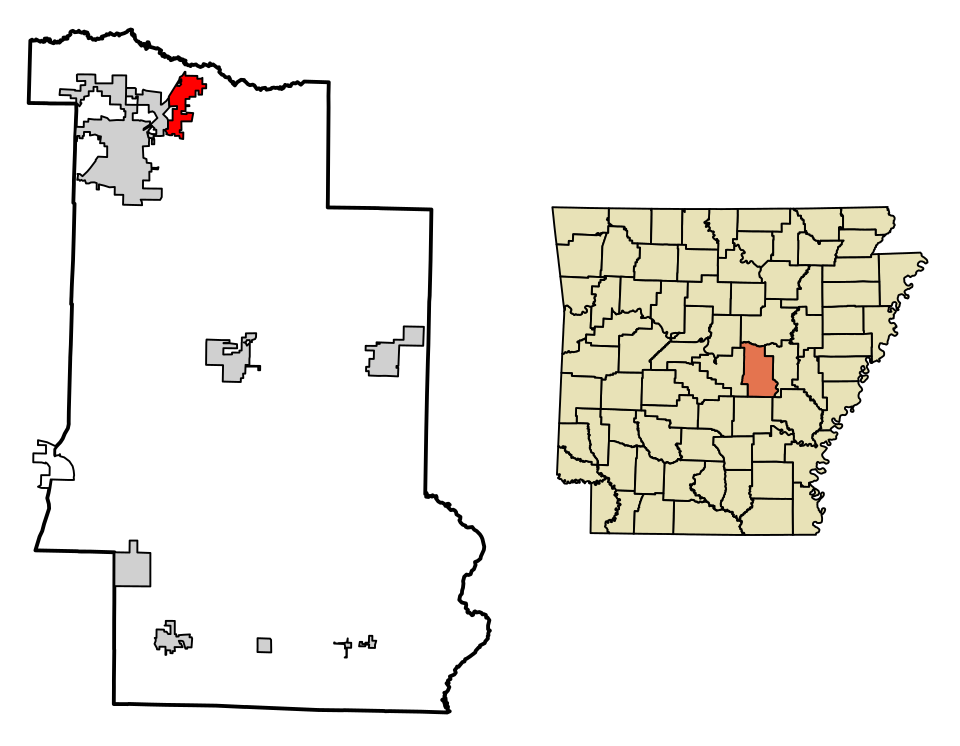
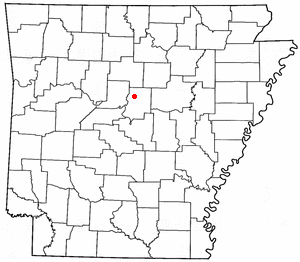
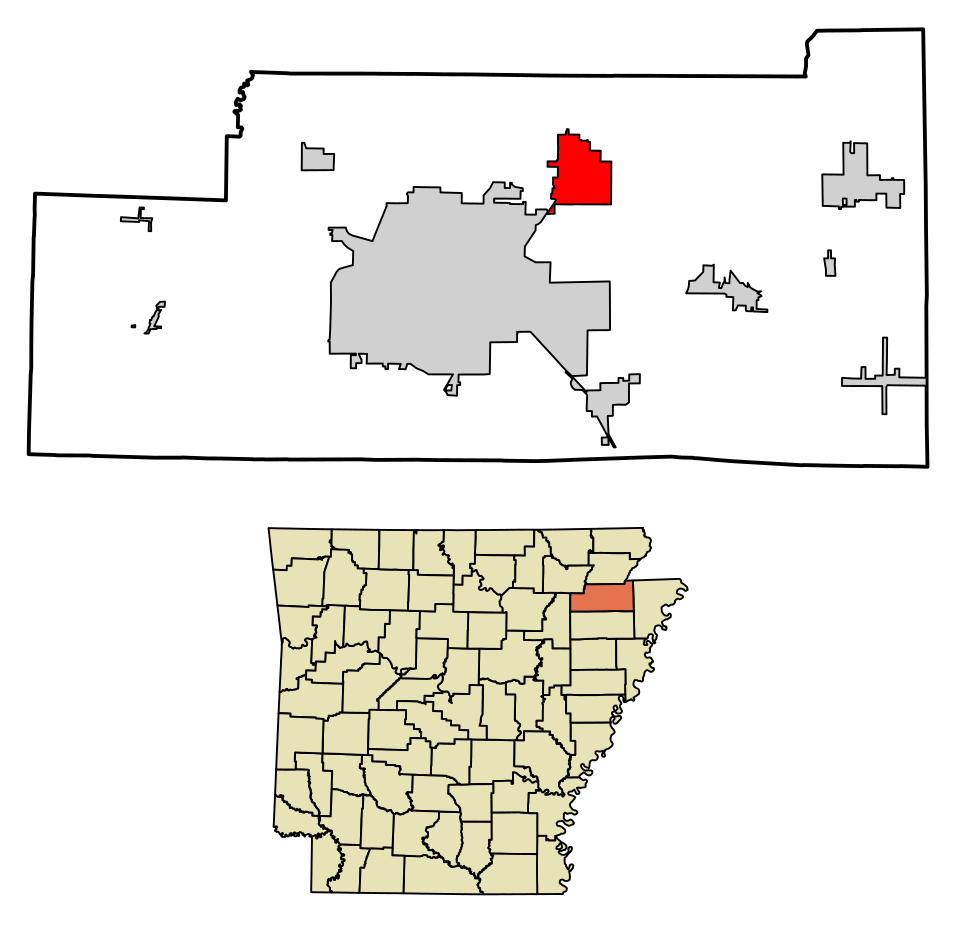
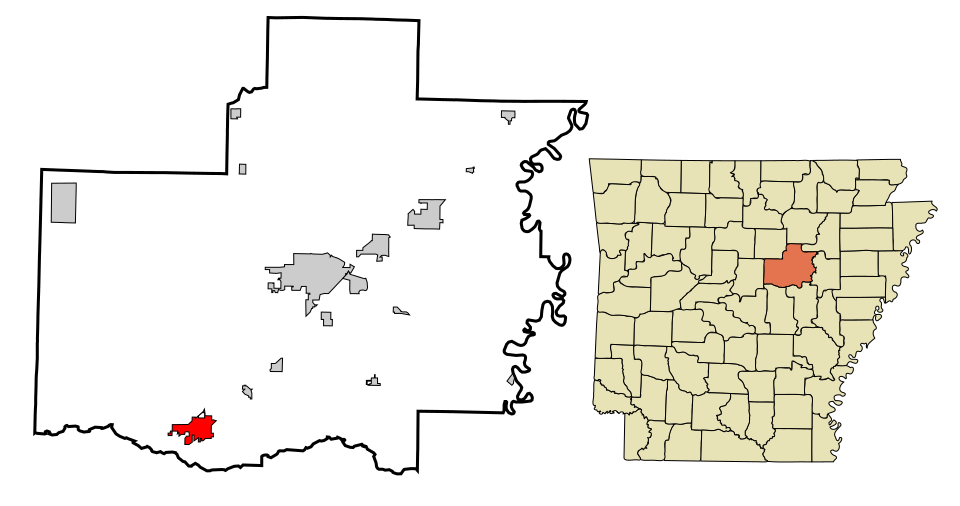
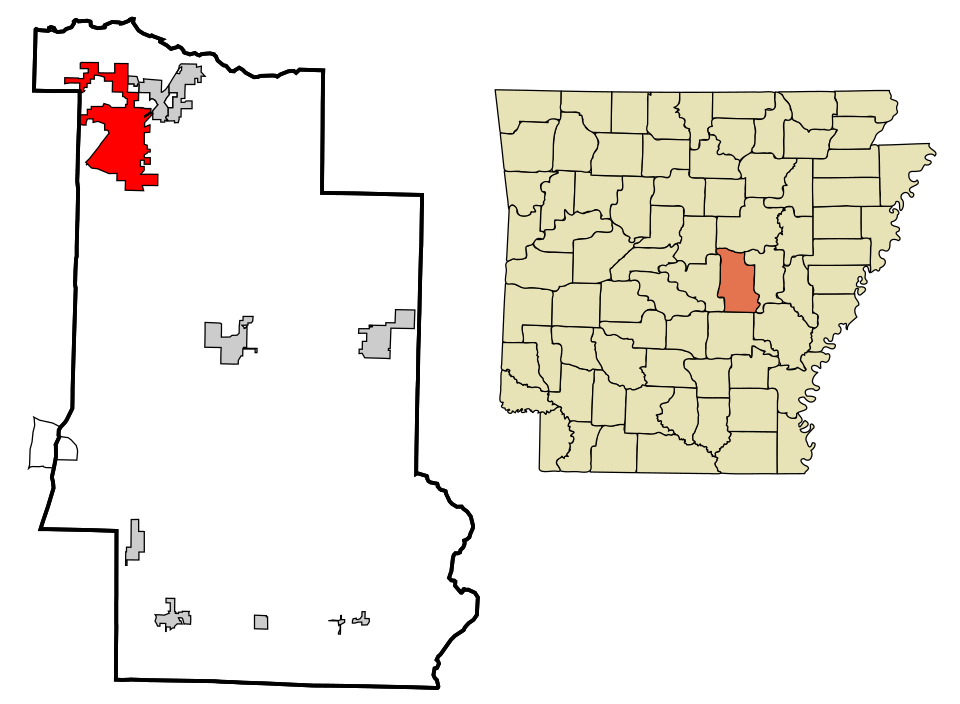
1 Map of Horseshoe Bend Horseshoe Bend2,555 people 19.7 per home 256 13
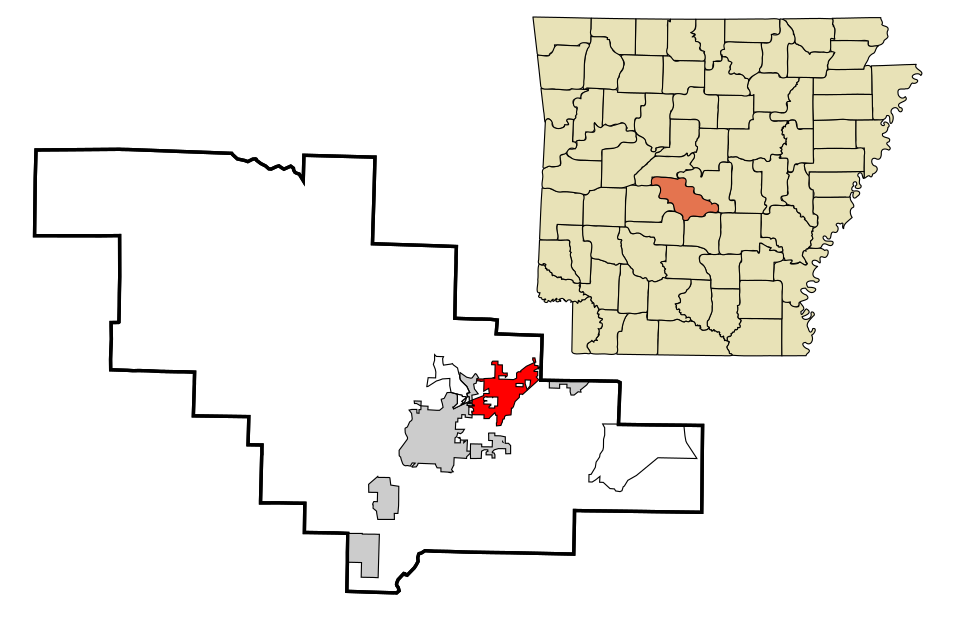
2 Malvern Malvern10,953 people 17.2 per home 549 32
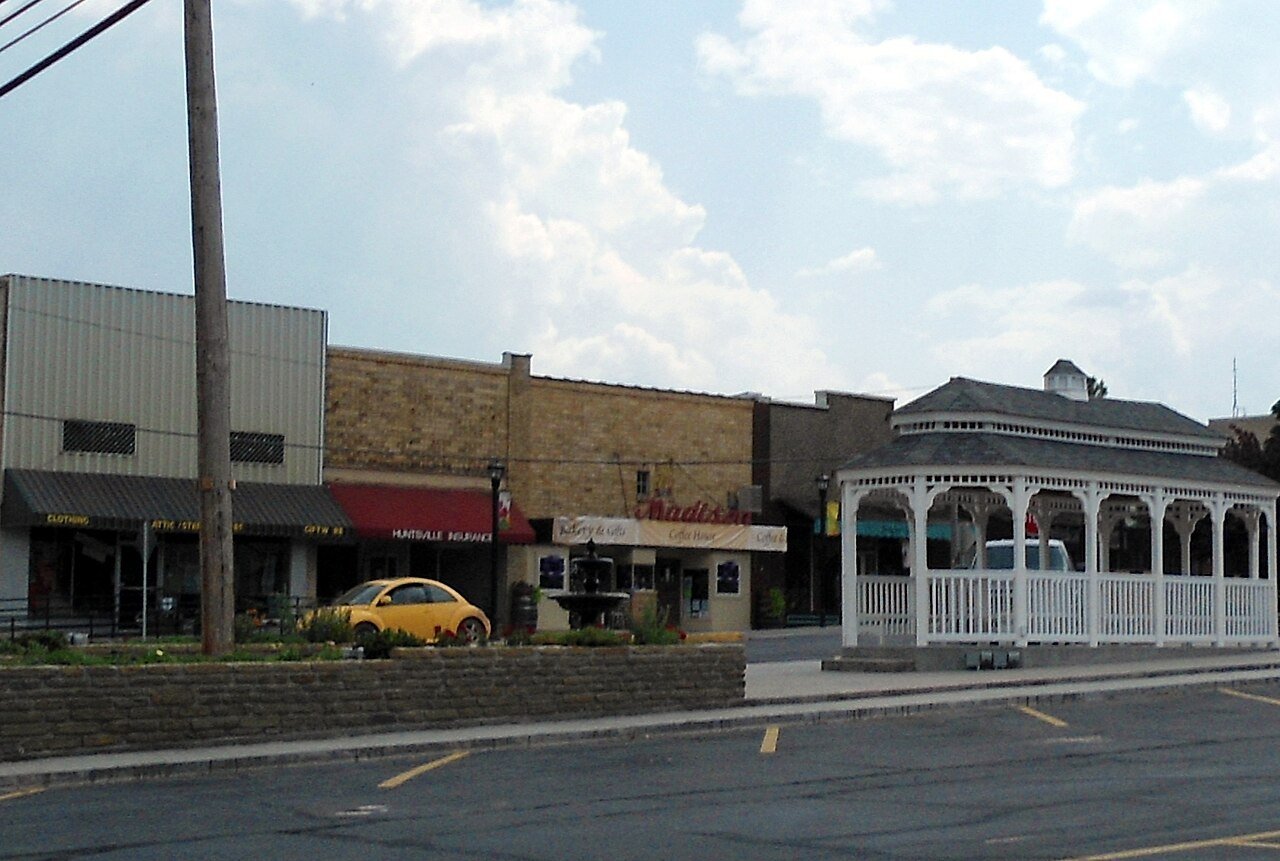
3 Huntsville Huntsville3,202 people 9.9 per home 533 54
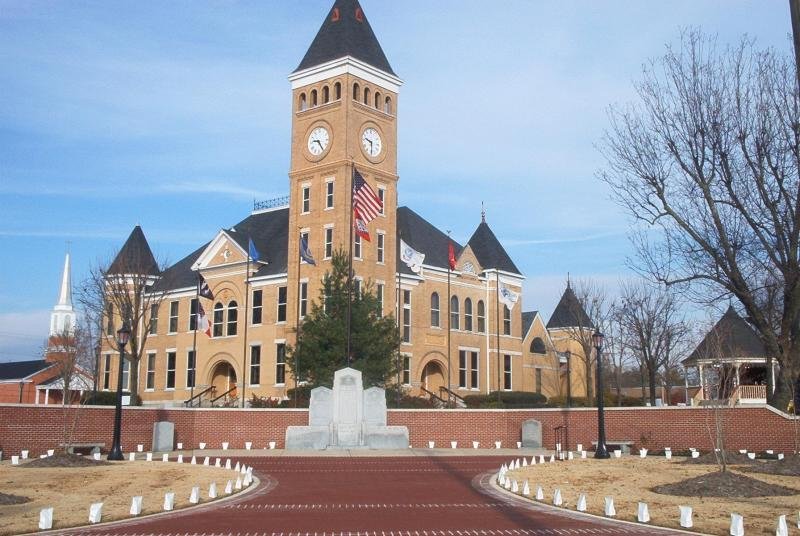
4 Gravette Gravette3,714 people 8.2 per home 1,222 149
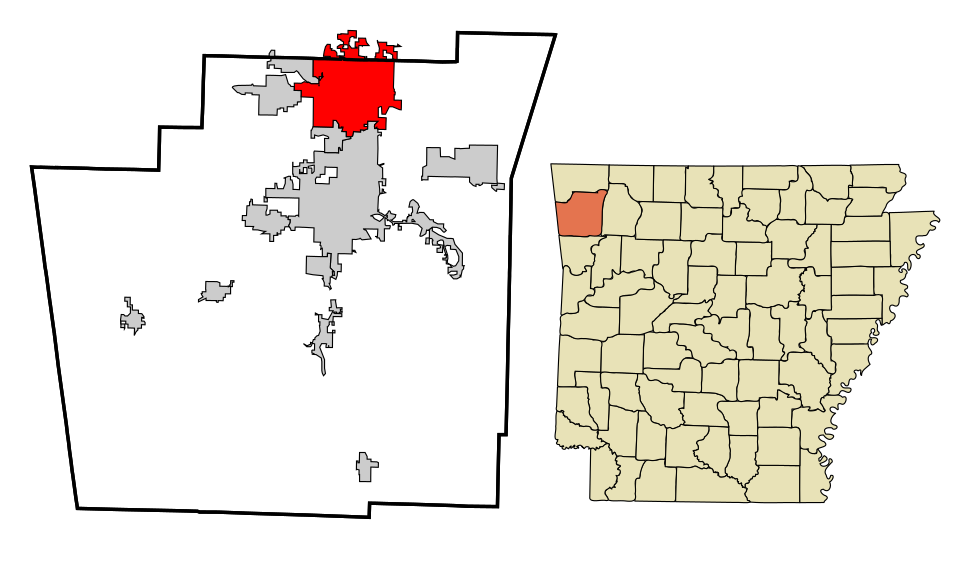
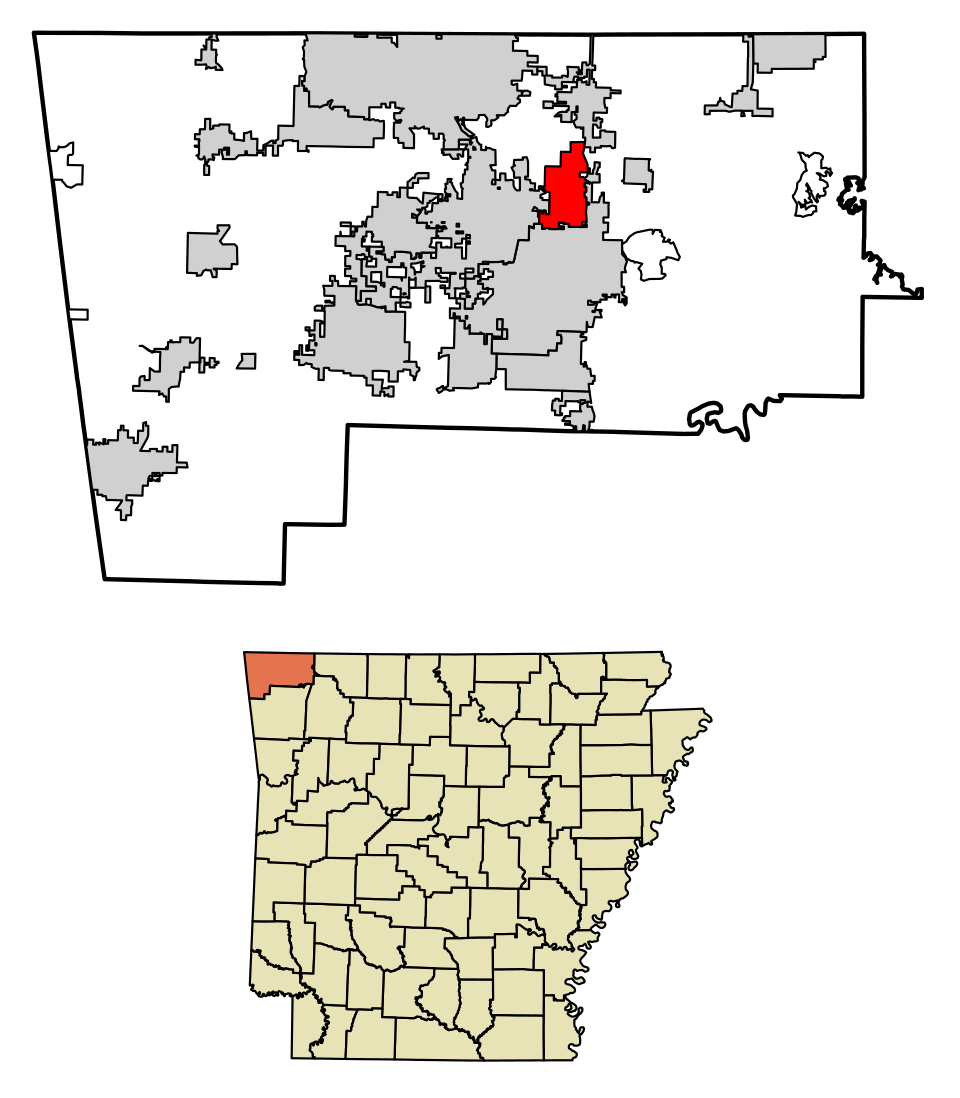
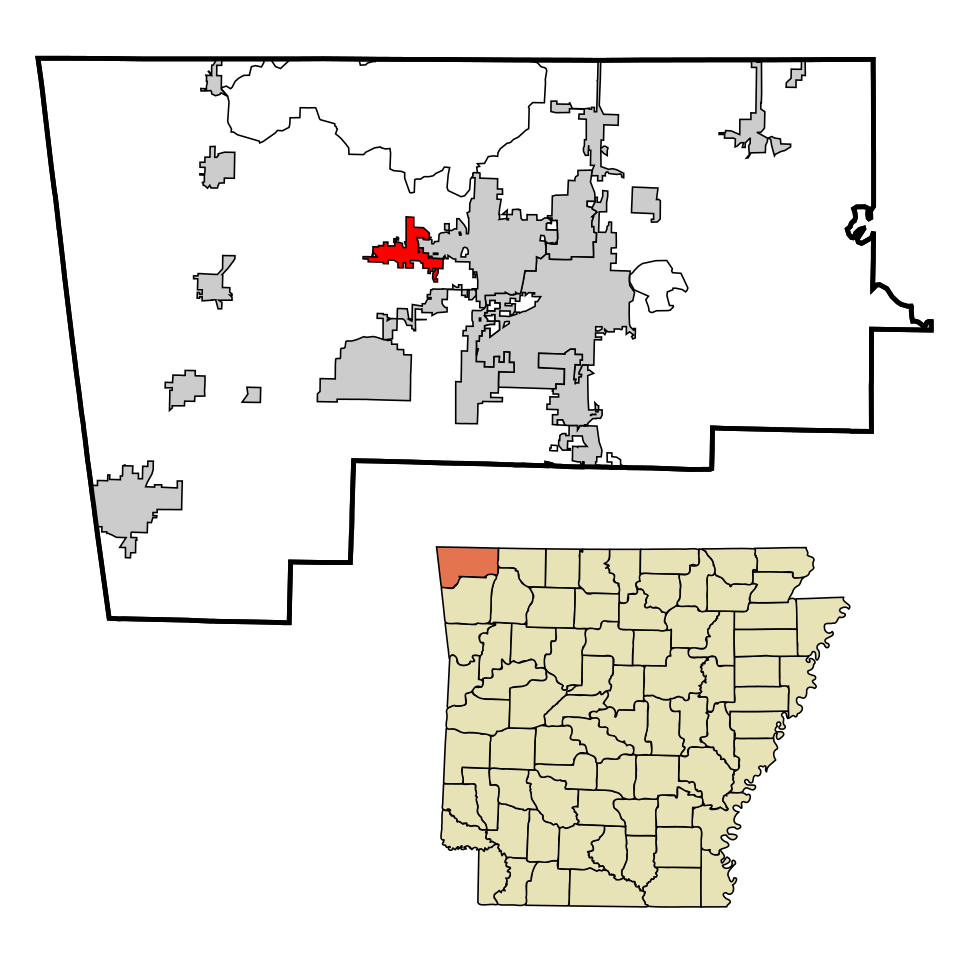
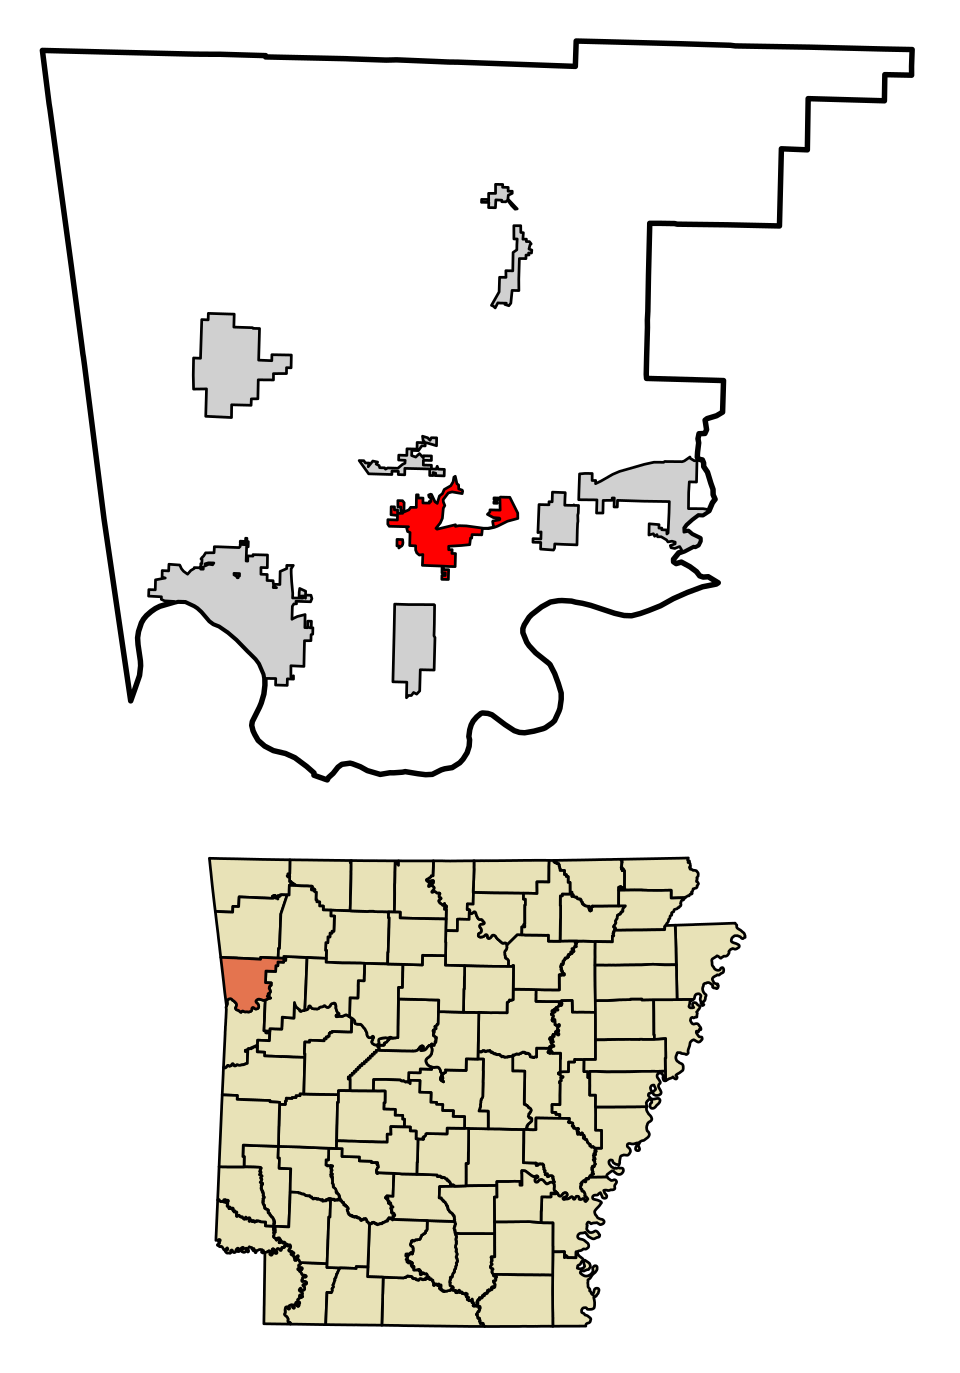
5 Map of Springdale Springdale88,160 people 6.3 per home 14,364 2,288
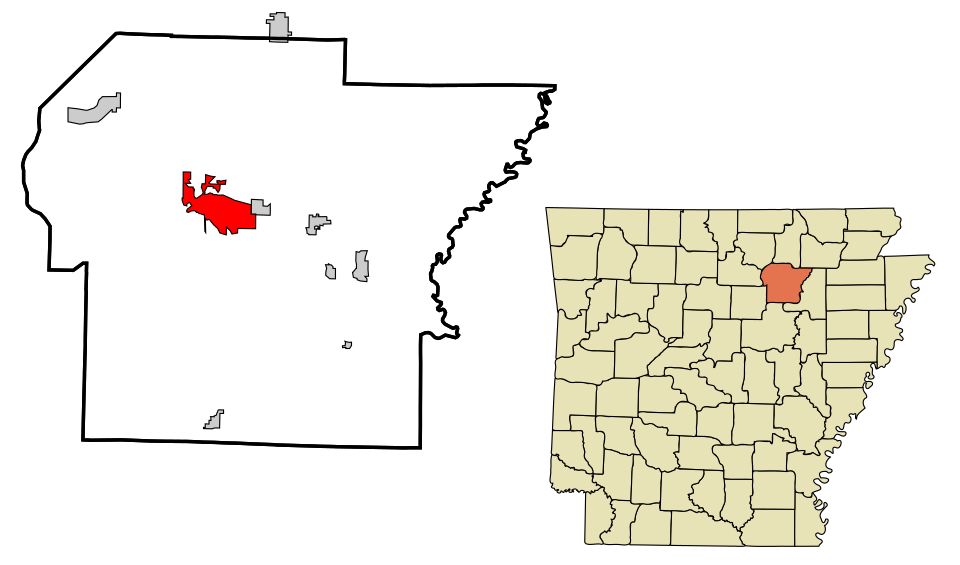
6 Pocahontas Pocahontas7,538 people 5.1 per home 763 149
7 Hot Springs Hot Springs37,920 people 5.0 per home 2,737 548
8 Map of Little Flock Little Flock3,056 people 4.6 per home 470 102
9 Walnut Ridge Walnut Ridge5,434 people 4.3 per home 494 116
10 Map of Shannon Hills Shannon Hills4,641 people 4.1 per home 1,347 330
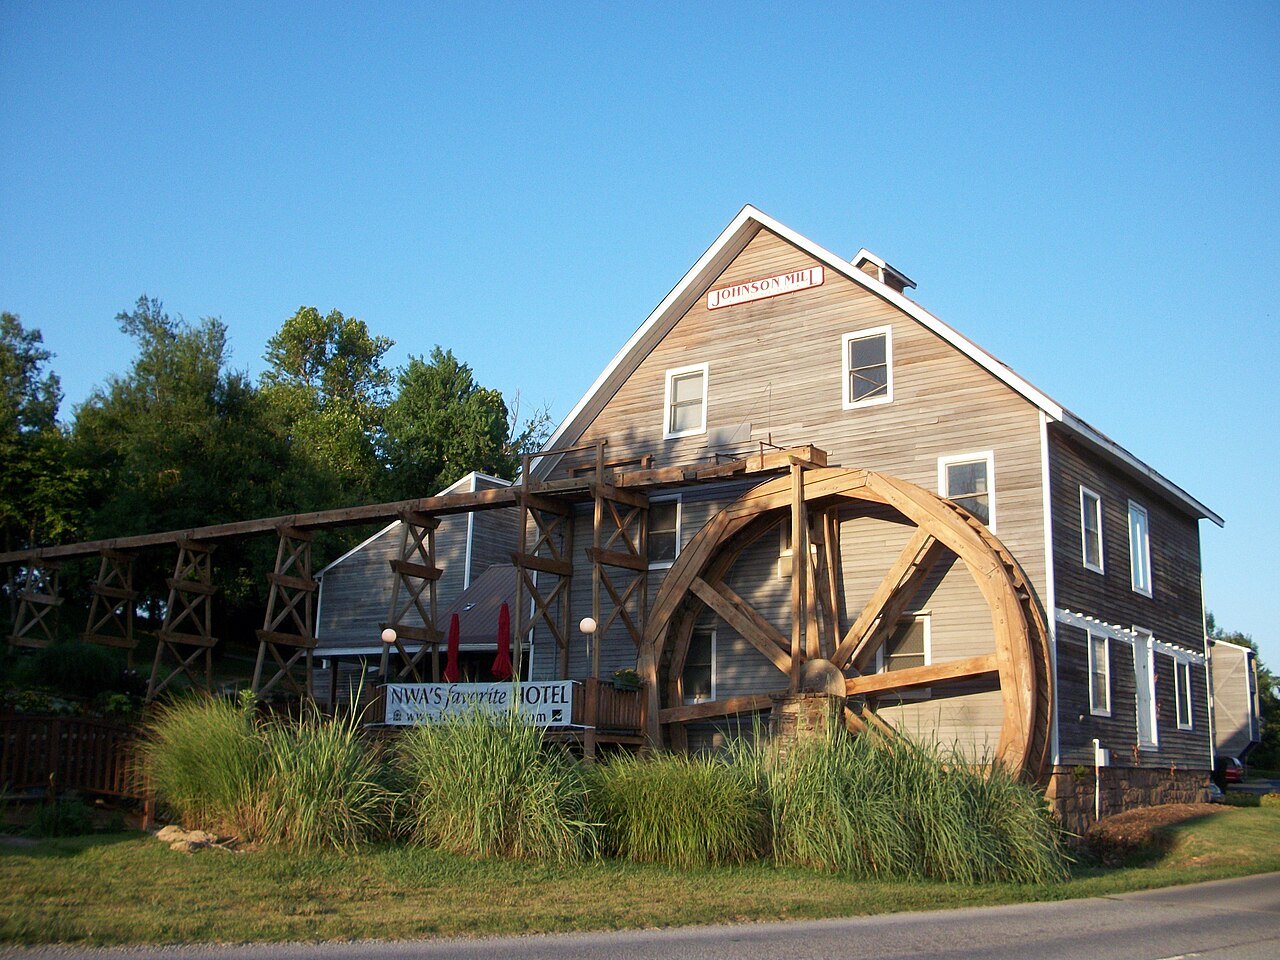
11 Johnson Johnson3,656 people 3.6 per home 255 70
12 Map of Elm Springs Elm Springs3,069 people 3.6 per home 826 229
13 Marion Marion13,623 people 3.4 per home 1,407 410
14 Farmington Farmington9,094 people 3.3 per home 1,610 494
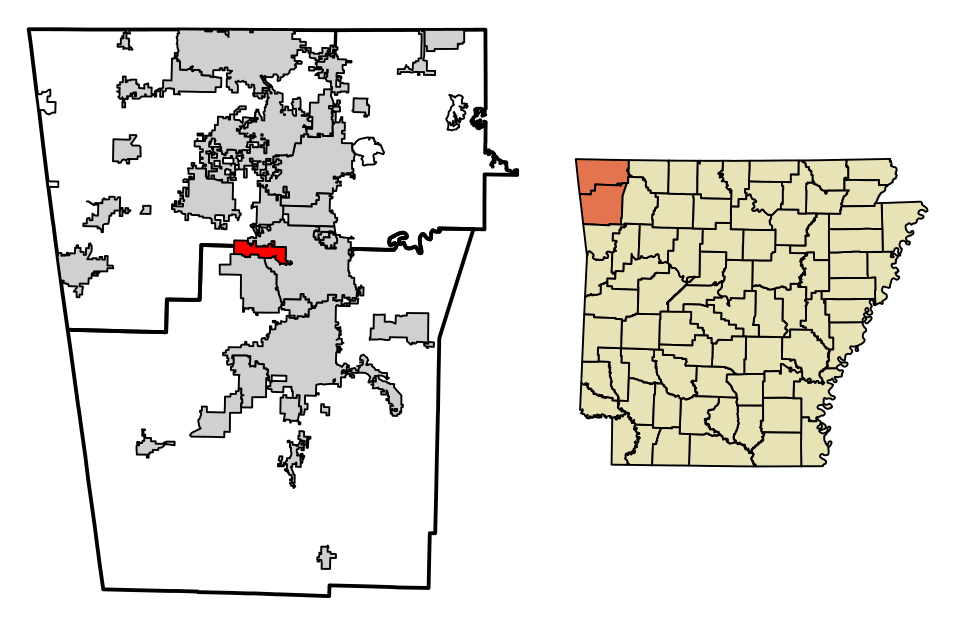
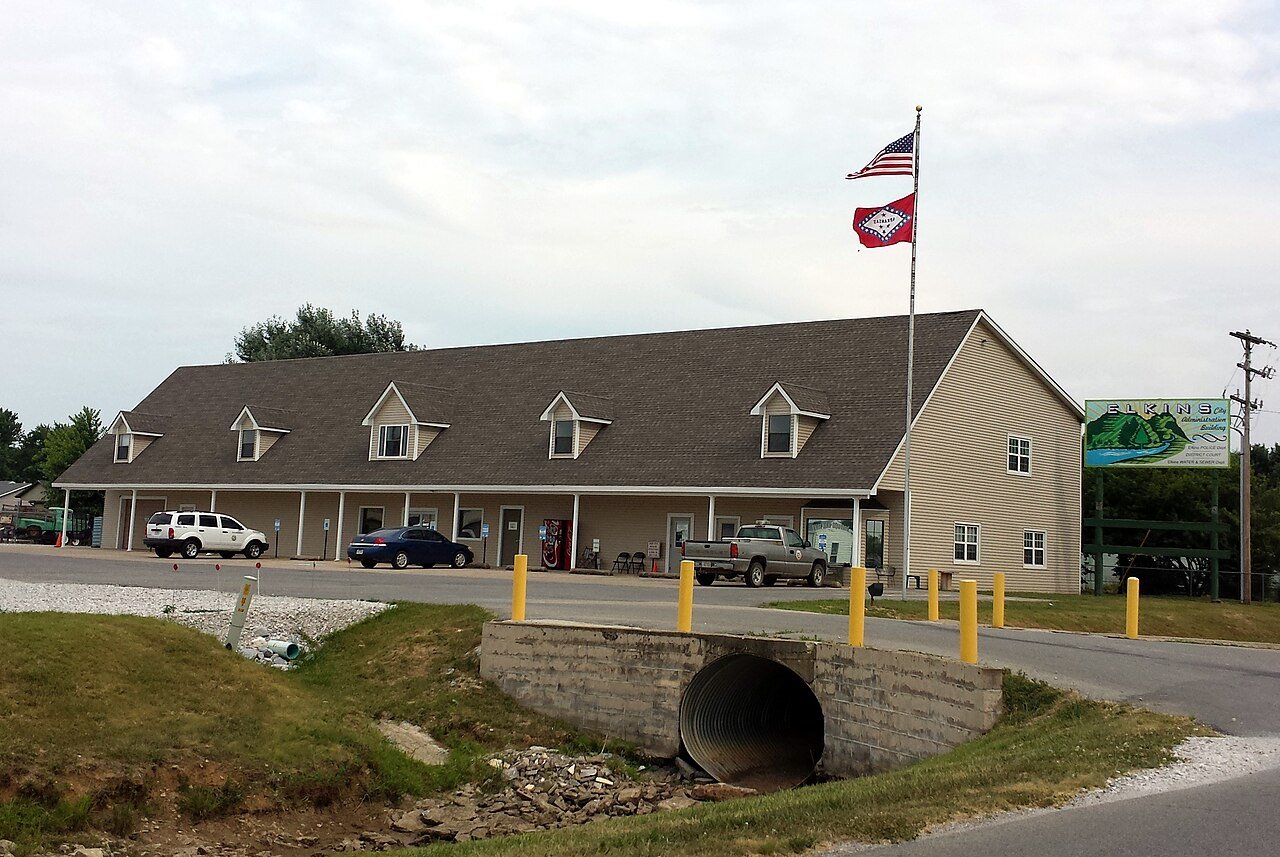
15 Elkins Elkins3,808 people 3.0 per home 954 315
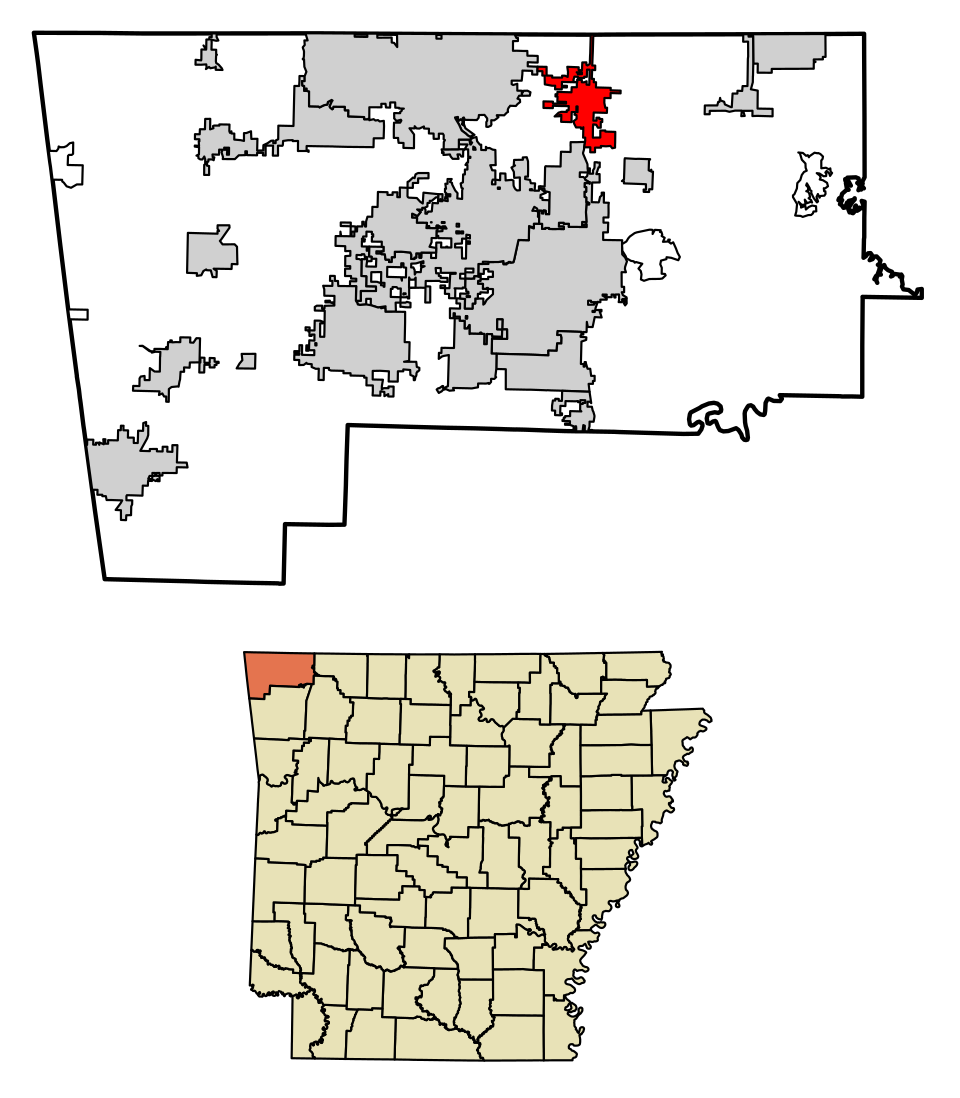
16 Map of Pea Ridge Pea Ridge8,108 people 2.9 per home 1,765 603
17 Cave Springs Cave Springs6,008 people 2.9 per home 3,766 1,296
18 Lowell Lowell10,849 people 2.9 per home 2,512 879
19 Map of Ward Ward6,573 people 2.8 per home 1,985 700
20 Berryville Berryville5,707 people 2.8 per home 326 115
21 Rogers Rogers72,981 people 2.8 per home 13,944 4,936
22 Map of Centerton Centerton21,920 people 2.8 per home 8,277 2,966
23 Map of Greenbrier Greenbrier6,018 people 2.7 per home 1,001 372
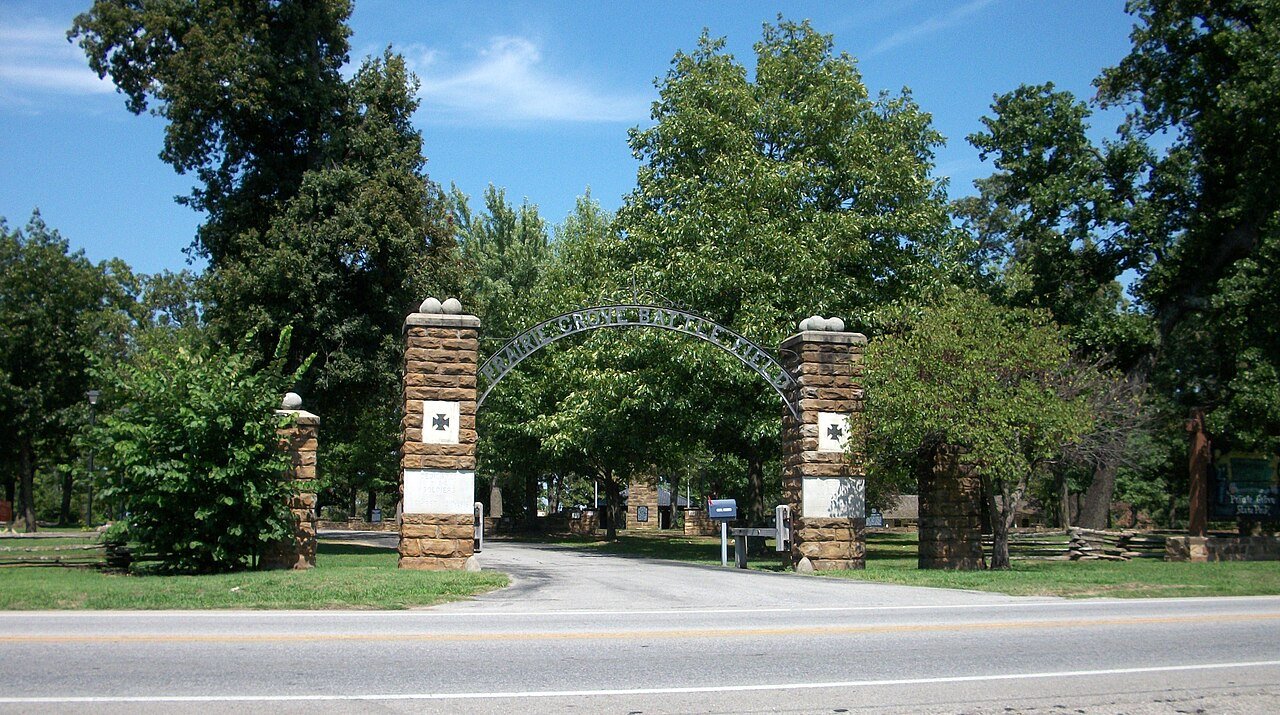
24 Prairie Grove Prairie Grove7,798 people 2.7 per home 2,665 993
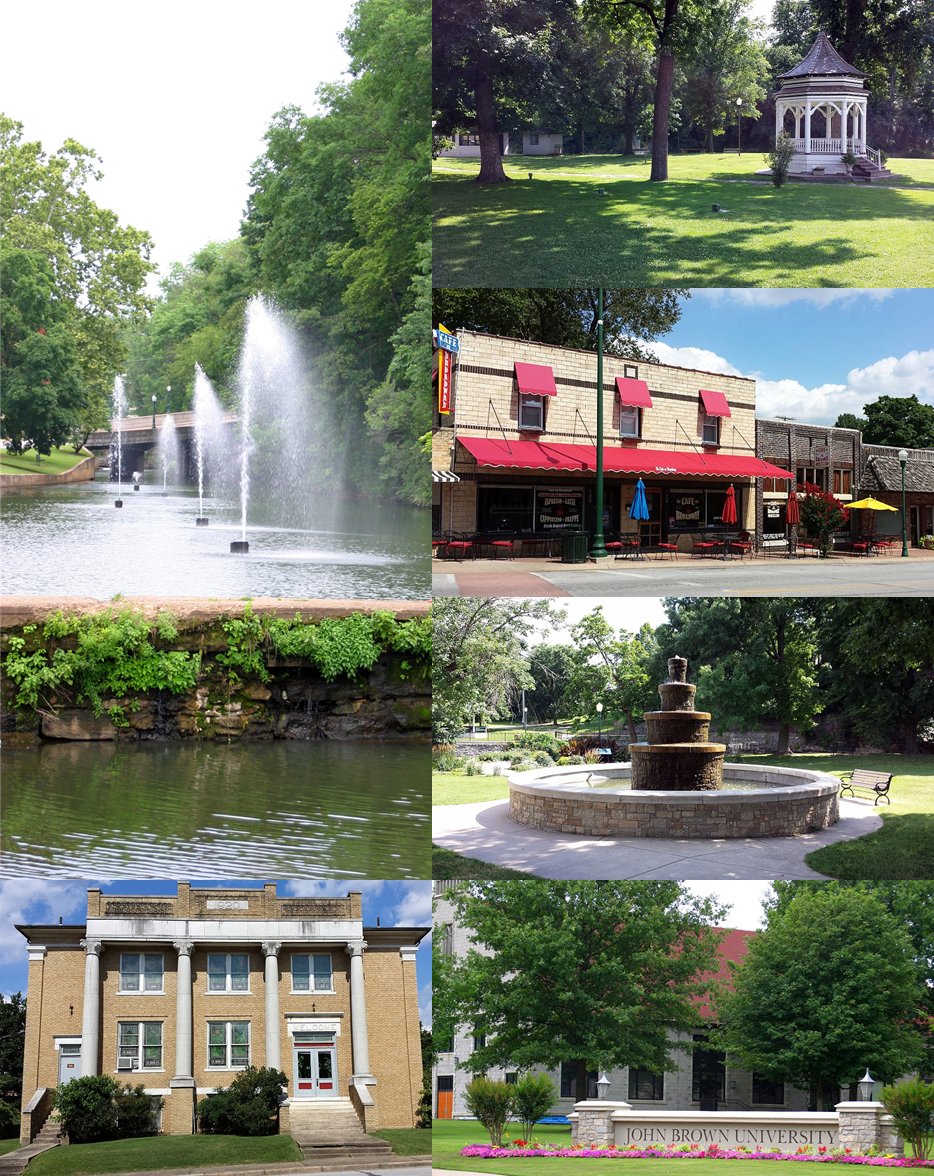
25 Siloam Springs Siloam Springs18,699 people 2.6 per home 2,248 855
26 Map of Brookland Brookland4,377 people 2.6 per home 2,422 935
27 Map of Batesville Batesville11,445 people 2.6 per home 943 366
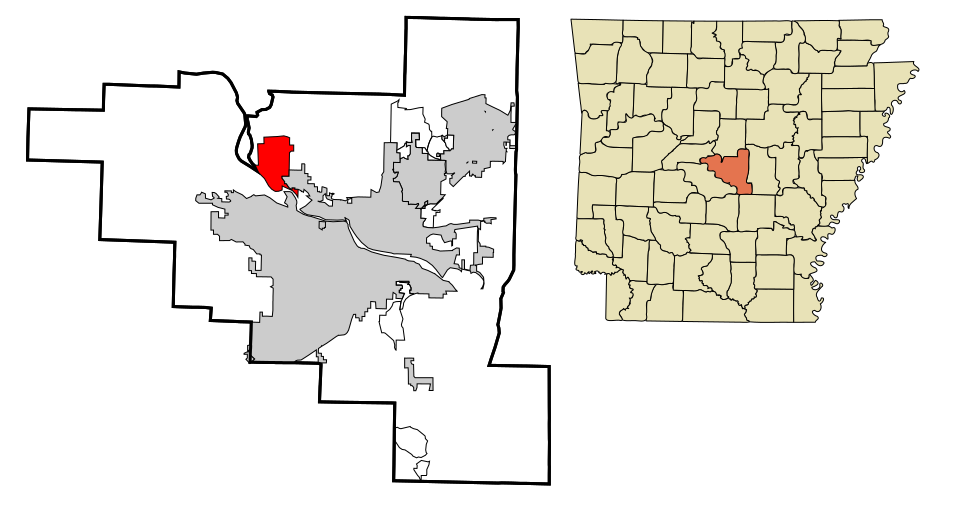
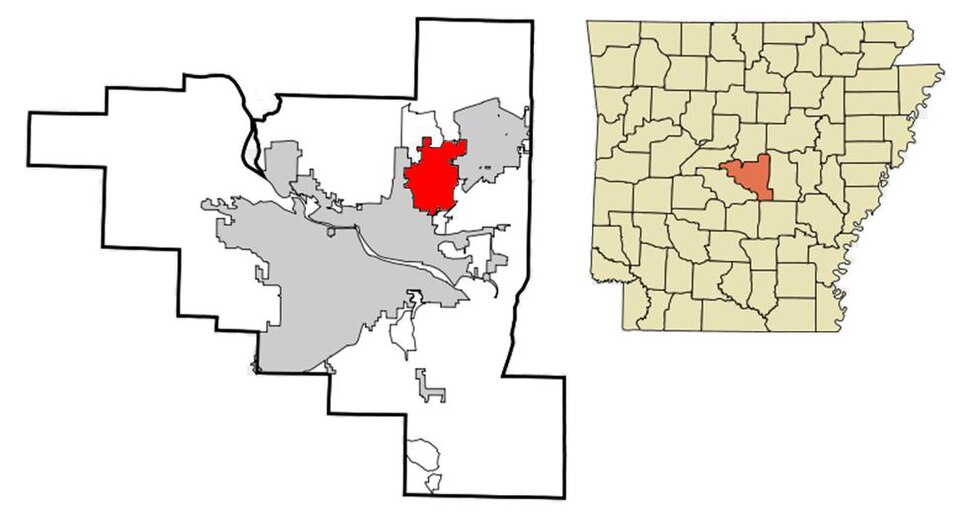
28 Map of Maumelle Maumelle19,373 people 2.5 per home 2,088 829
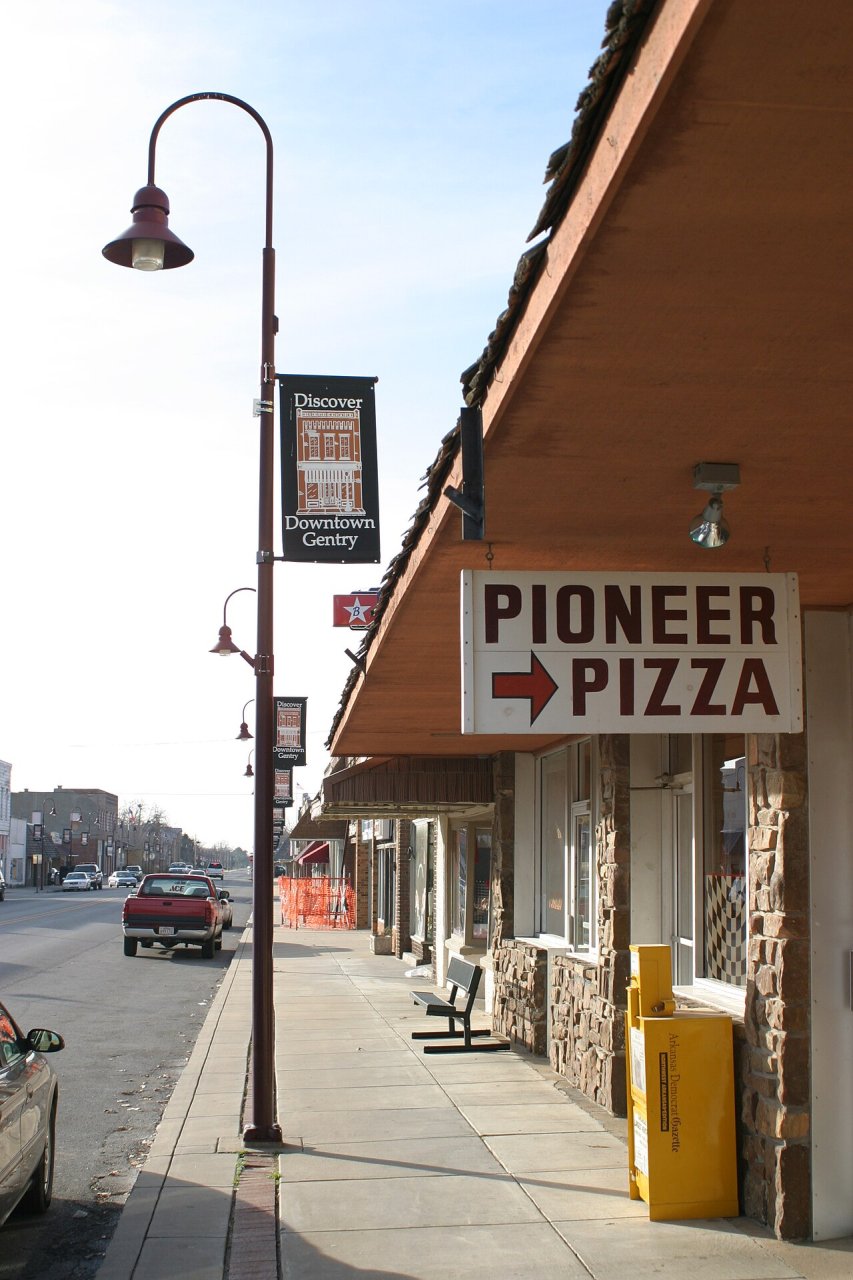
29 Gentry Gentry4,240 people 2.4 per home 632 263
30 Map of Beebe Beebe8,707 people 2.3 per home 1,122 480
31 Map of Bryant Bryant21,504 people 2.3 per home 3,975 1,711
32 Bentonville Bentonville58,249 people 2.2 per home 18,863 8,507
33 Paragould Paragould30,215 people 2.2 per home 3,424 1,547
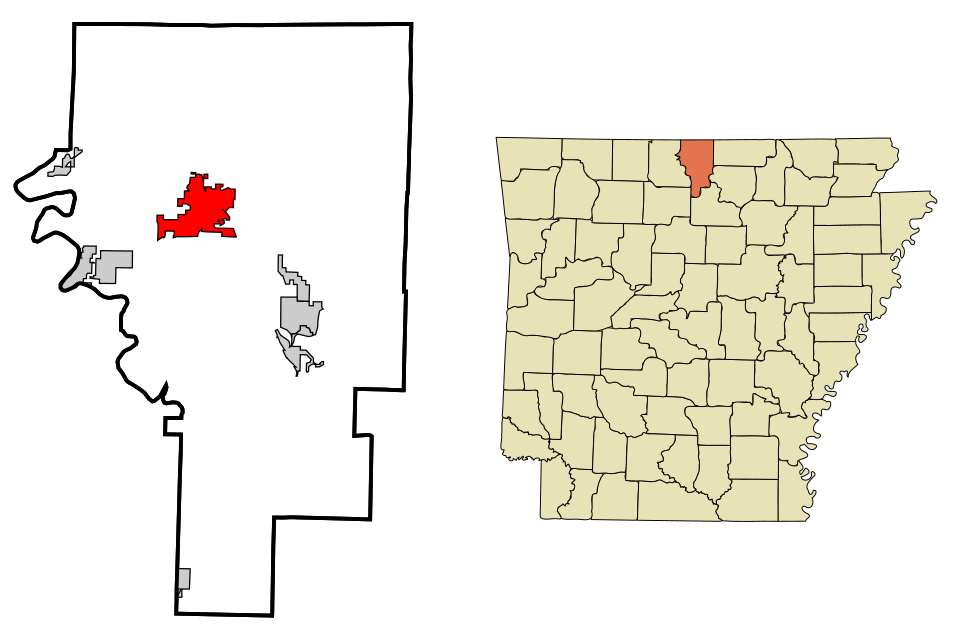
34 Map of Cabot Cabot26,960 people 2.0 per home 2,793 1,375

35 Map of Sherwood Sherwood33,070 people 1.9 per home 3,208 1,705
36 Jonesboro Jonesboro80,137 people 1.9 per home 11,313 6,102
37 Map of Alma Alma5,906 people 1.9 per home 406 220
38 Map of Greenwood Greenwood9,616 people 1.8 per home 564 309
39 Benton Benton36,595 people 1.8 per home 4,333 2,378
40 Manila Manila3,691 people 1.7 per home 340 202
41 Map of Mountain Home Mountain Home13,108 people 1.6 per home 377 233
42 Jacksonville Jacksonville29,221 people 1.6 per home 1,113 705
43 Conway Conway67,642 people 1.6 per home 5,226 3,371
44 Vilonia Vilonia4,498 people 1.5 per home 473 316
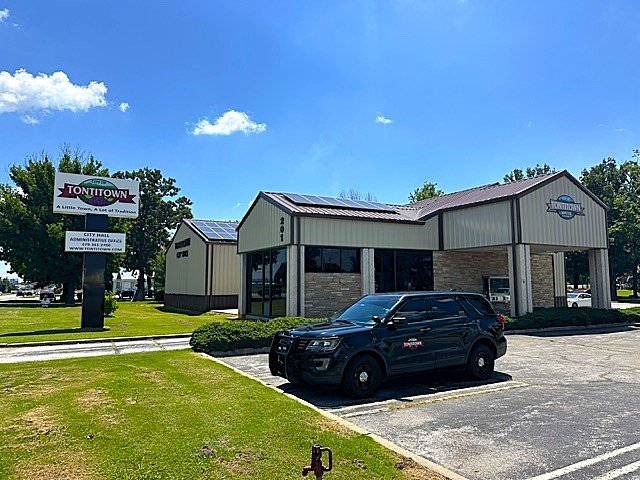
45 Tontitown Tontitown6,425 people 1.4 per home 1,841 1,294
46 Russellville Russellville29,162 people 1.4 per home 1,020 728
47 Sheridan Sheridan5,165 people 1.4 per home 317 229
48 Pottsville Pottsville3,229 people 1.4 per home 302 222
49 Little Rock Little Rock203,436 people 1.1 per home 9,067 8,004
50 Austin Austin3,915 people 1.1 per home 1,422 1,265
51 Fort Smith Fort Smith89,805 people 0.9 per home 2,933 3,139
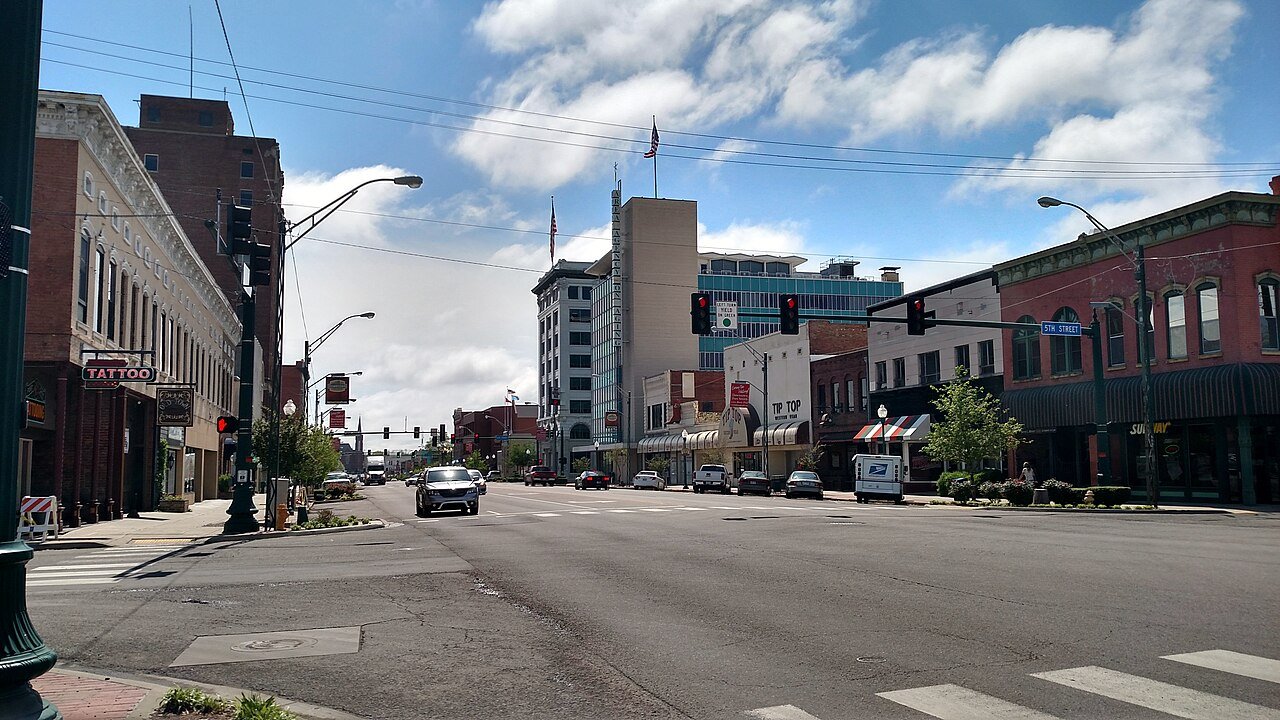
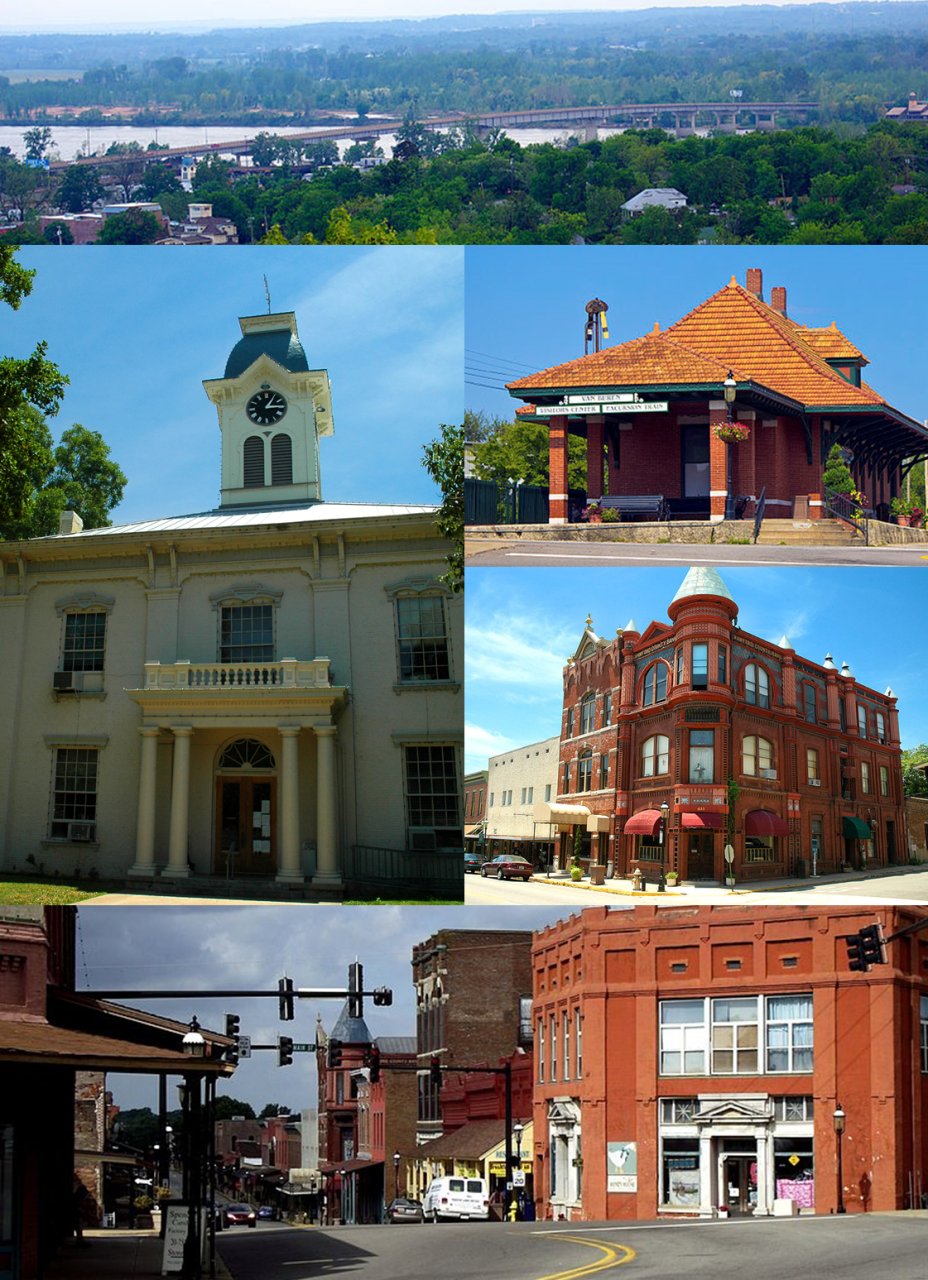
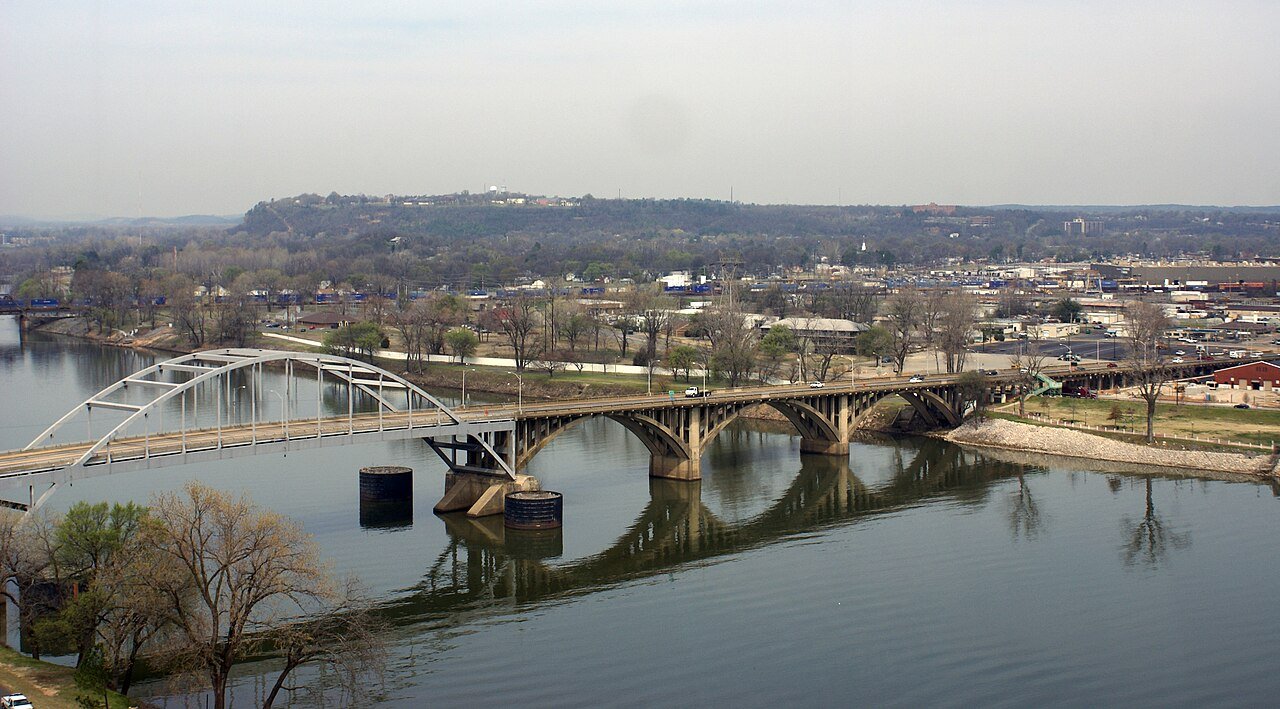
52 Van Buren Van Buren23,763 people 0.6 per home 427 732
53 North Little Rock North Little Rock64,538 people 0.6 per home 2,287 4,082

How this ranking works

We take each town’s population change between the 2010 and 2020 censuses and divide it by the new homes its building permits authorized over 2010–2019. The result is how many new residents arrived for every new home. A high number means people came faster than homes were built, so existing homes filled up: larger households, fewer vacancies and tighter supply. The highest ratio ranks #1. Across Arkansas it’s 1.1 per home.

Only towns that gained at least 250 residents and permitted at least 10 homes are ranked, because a ratio built on a handful of either is noise. College towns, where 20% or more of residents are enrolled in college, are left out: a growing college adds dorm students as residents, but dorms never show up as permitted homes.

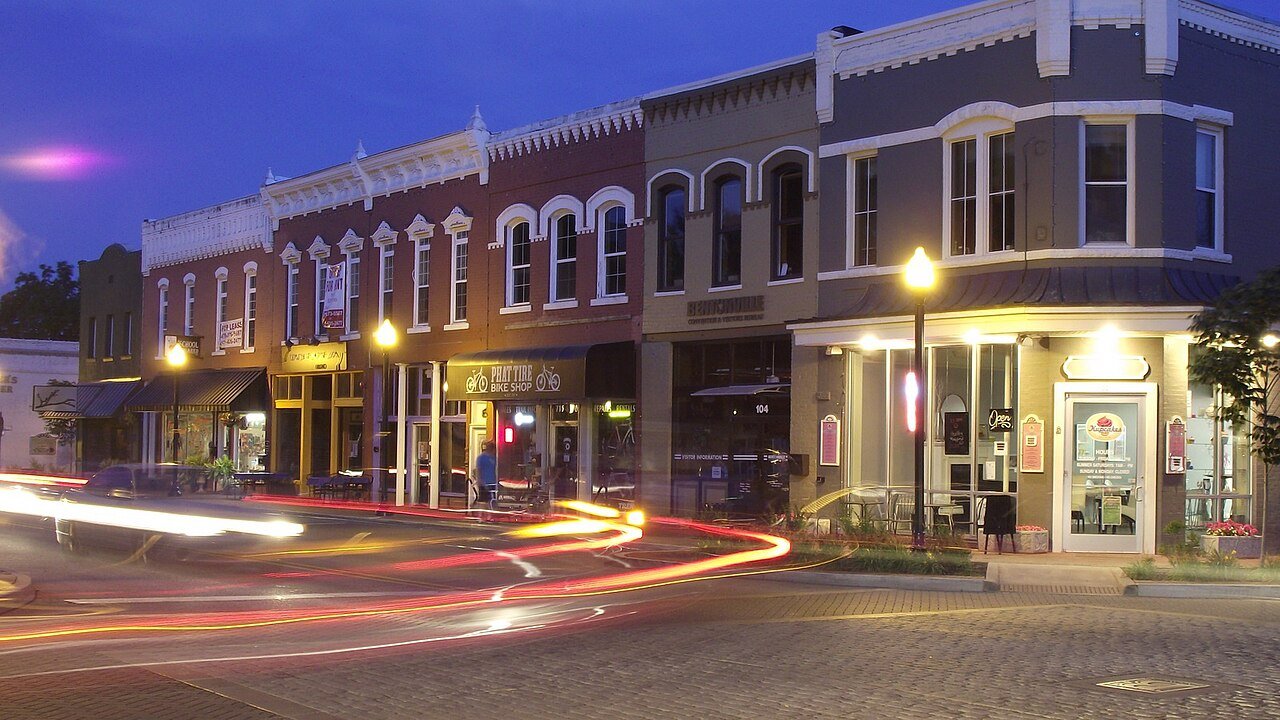
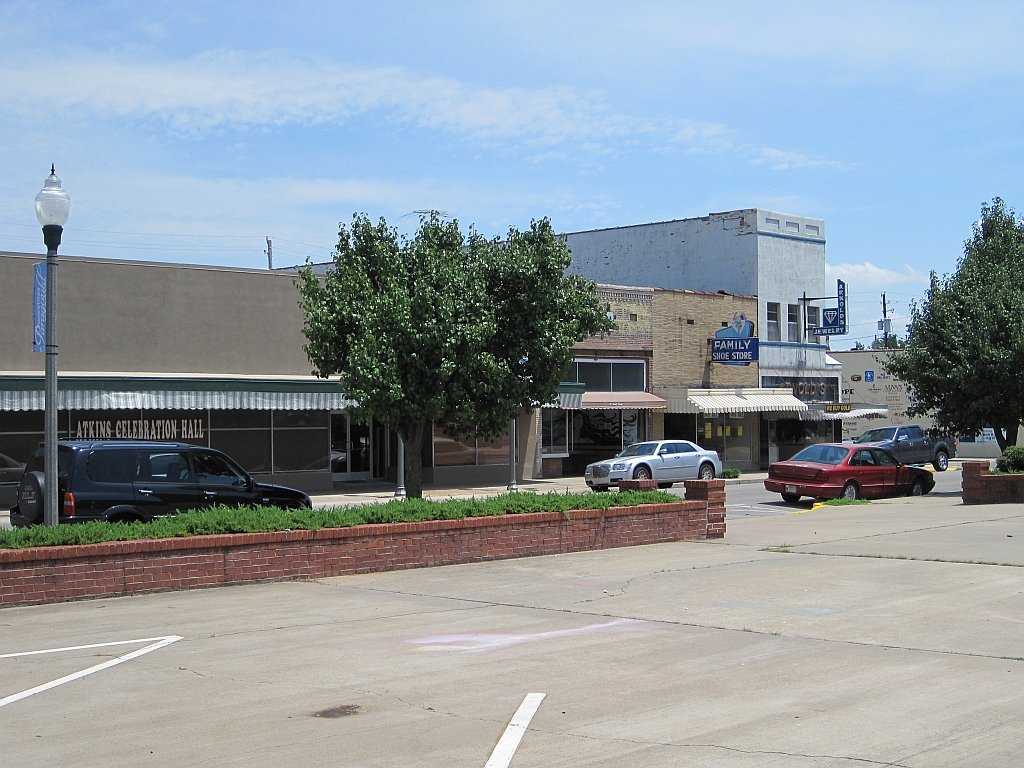
Only towns with at least 2,500 residents are ranked; Census estimates for smaller places are too uncertain. Population and income: U.S. Census Bureau American Community Survey 5-year estimates. New homes: U.S. Census Bureau Building Permits Survey. Residents: 2010 and 2020 decennial censuses. Town photos: Wikimedia Commons, credited on each town’s page.

Same ranking in other states