ALAlabama rankings

Towns where housing hasn't kept up with growth in Alabama

Ranked by how many new residents each town gained for every new home it permitted between the 2010 and 2020 censuses. 73 towns with 2,500+ residents.
U.S. Census ACS 2020–2024 5-year

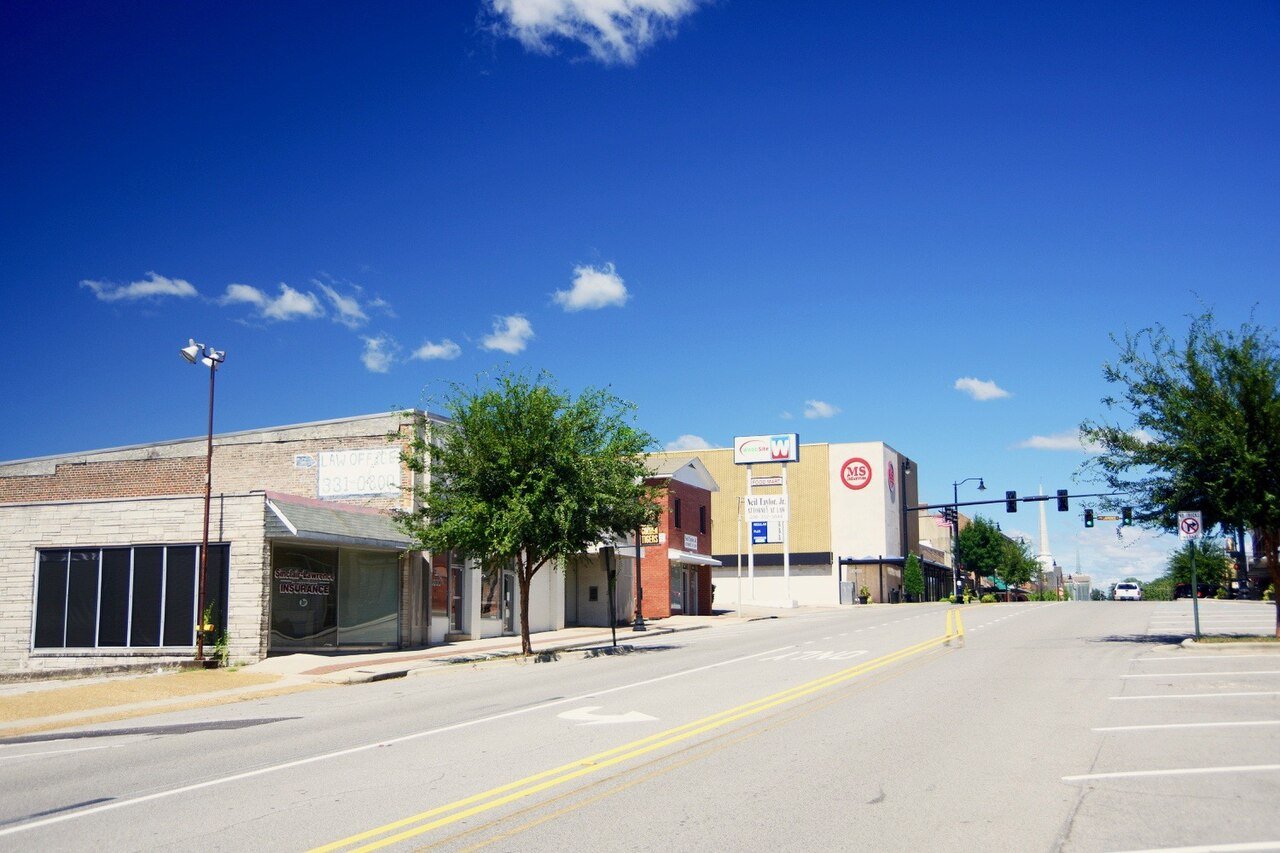
Trinity
Alabama · Housing hasn't kept up

Where Trinity lands: #8 of 73

6.6 per home new residents for every new home, 2010–2020 · Visit Trinity →
#TownNew residents per new homeResidents gainedHomes permitted
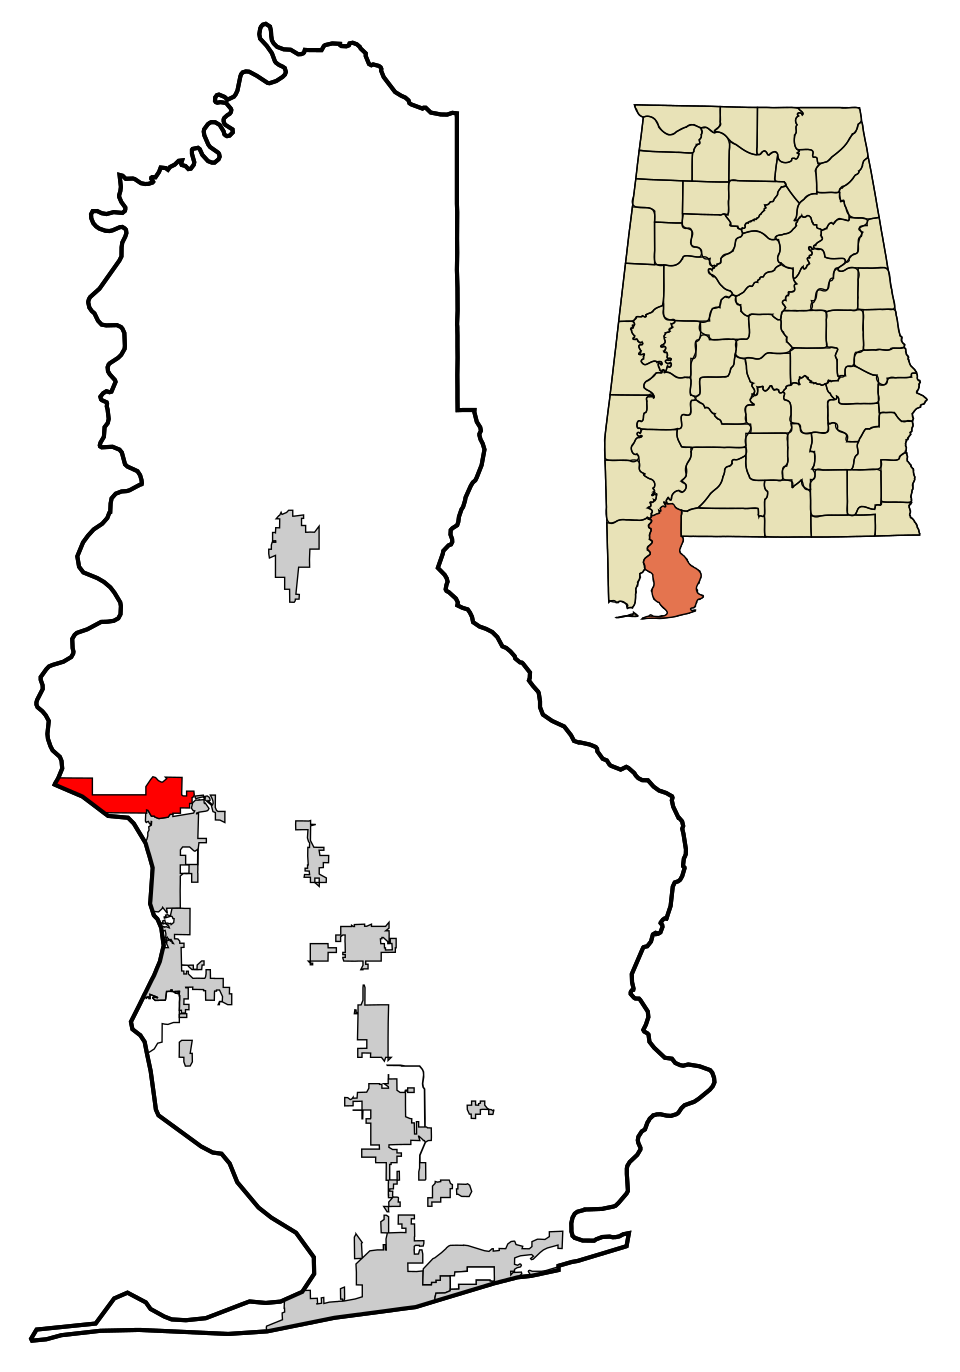
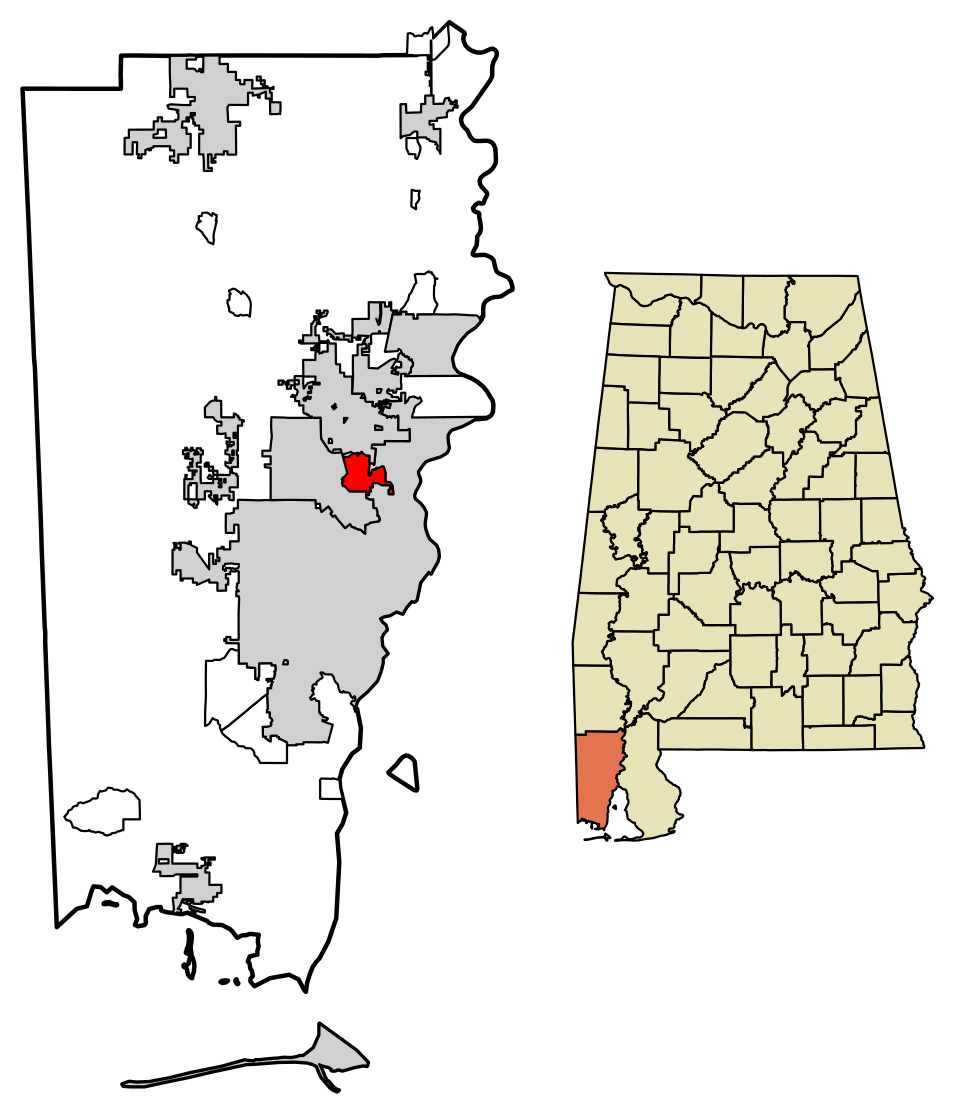
1 Map of Chickasaw Chickasaw6,332 people 31.9 per home 351 11
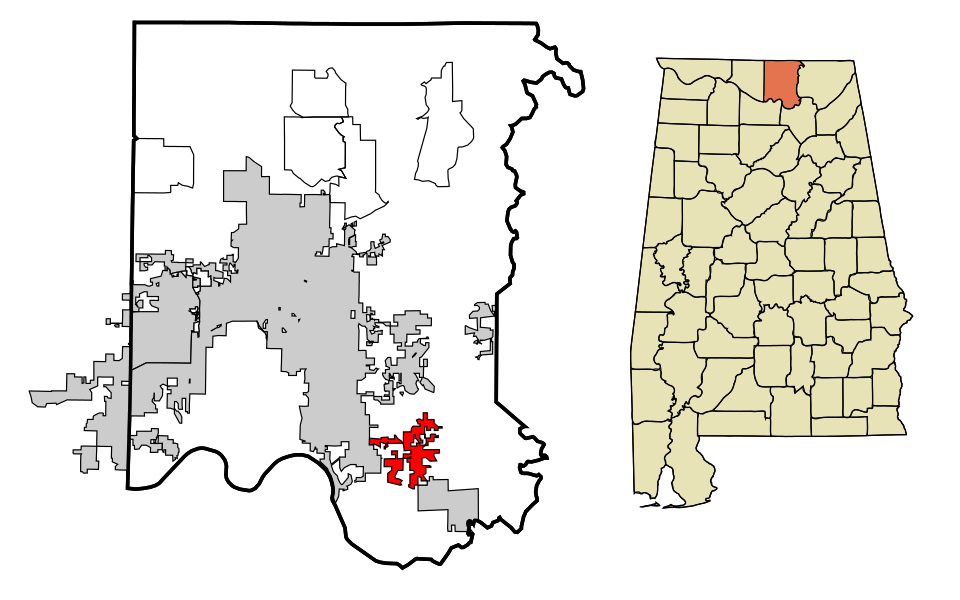
2 Map of Hueytown Hueytown16,414 people 30.5 per home 671 22
3 Lanett Lanett6,814 people 27.9 per home 502 18
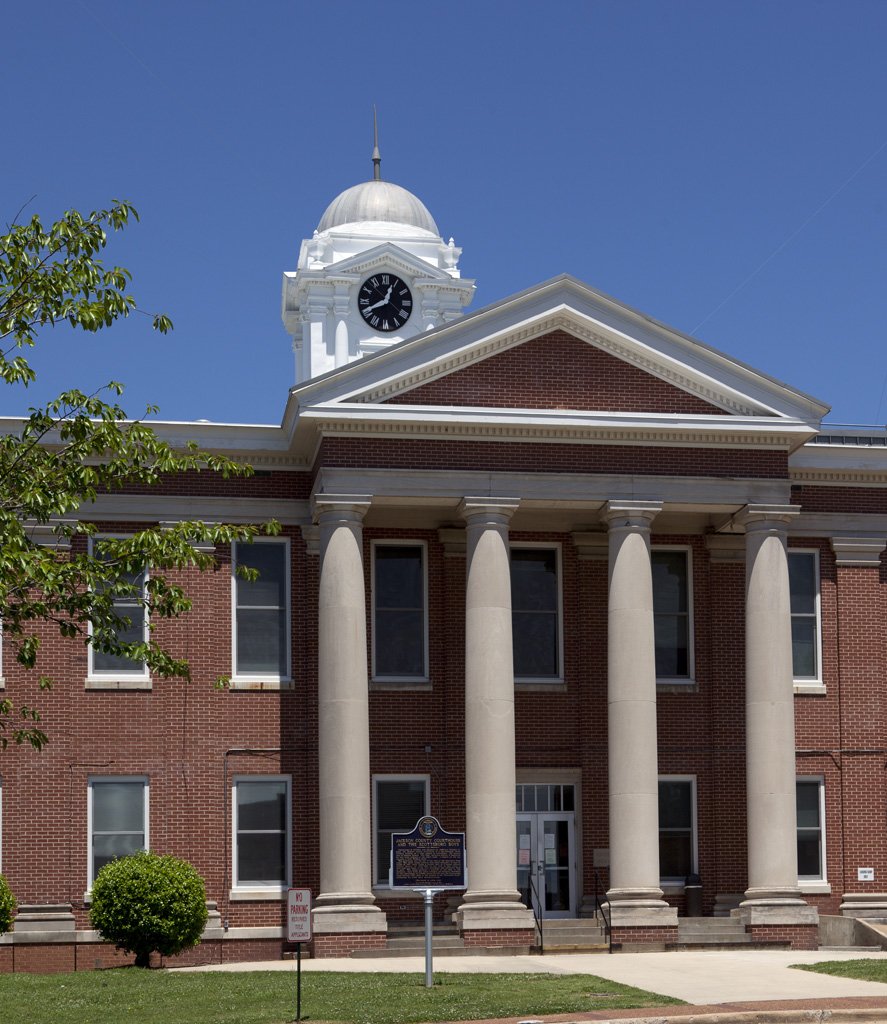
4 Albertville Albertville22,813 people 9.0 per home 1,226 136
5 Valley Valley10,277 people 8.8 per home 1,005 114
6 Russellville Russellville10,799 people 8.5 per home 1,025 121
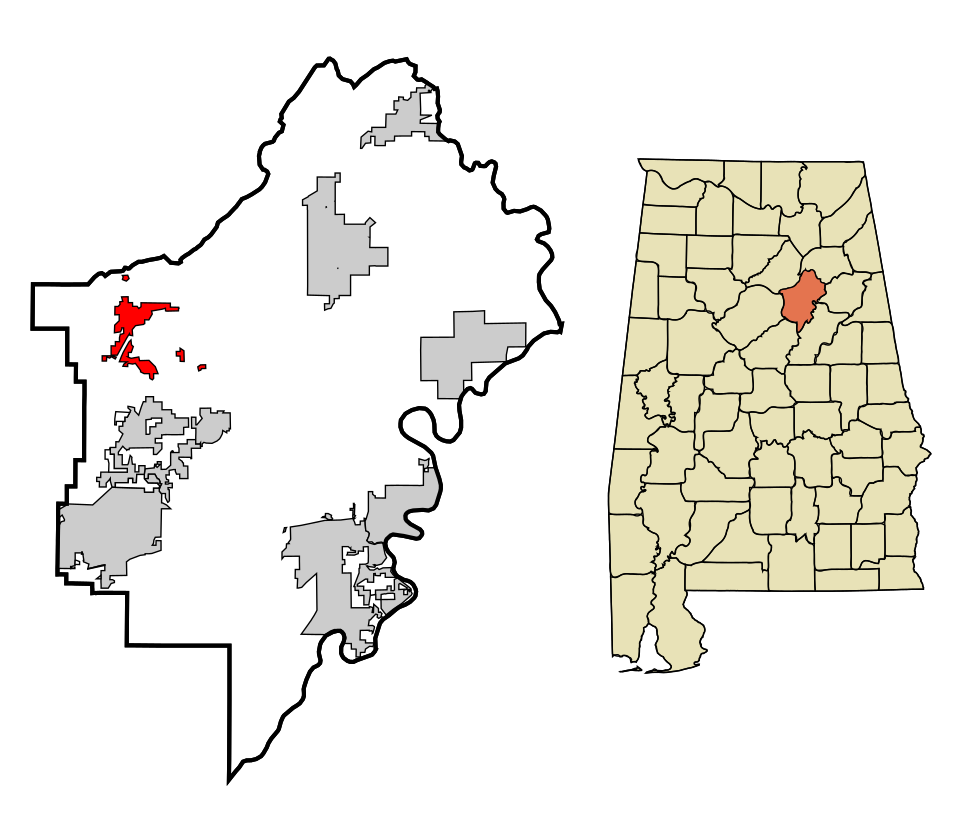
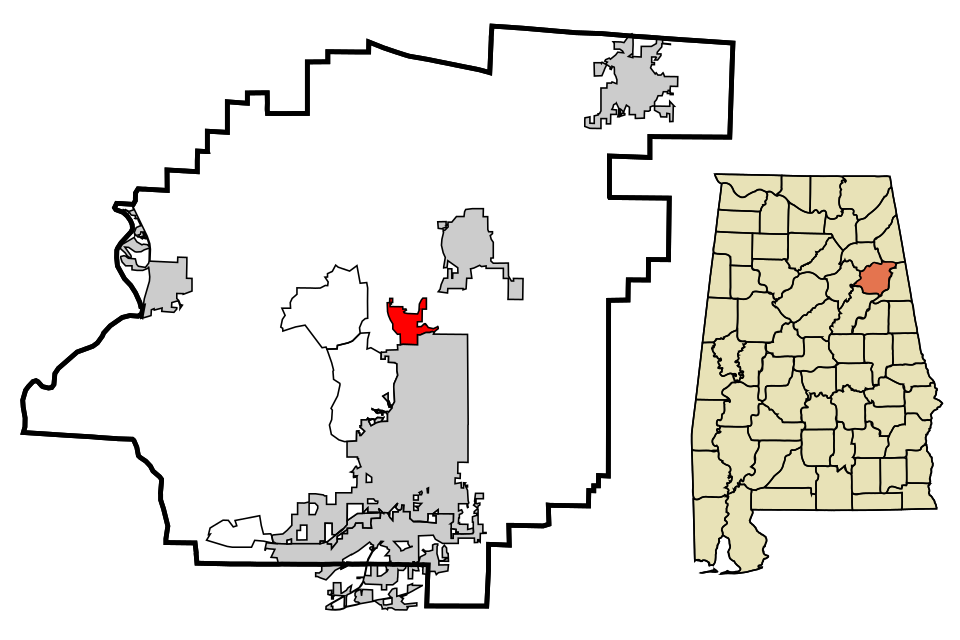
7 Map of Springville Springville5,081 people 7.8 per home 706 90
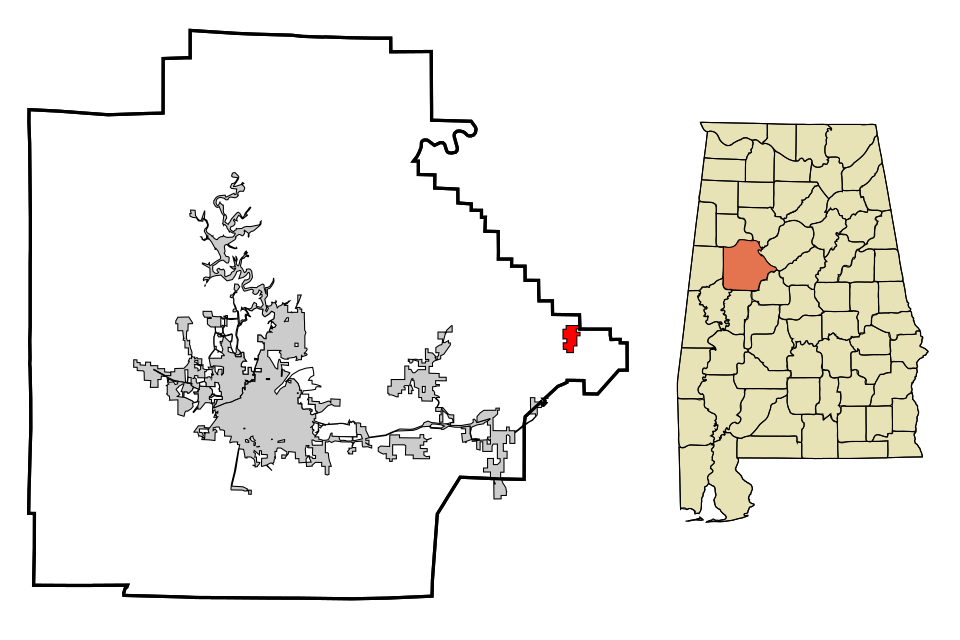
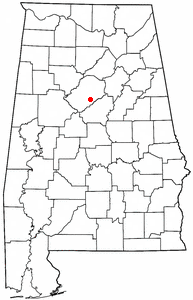
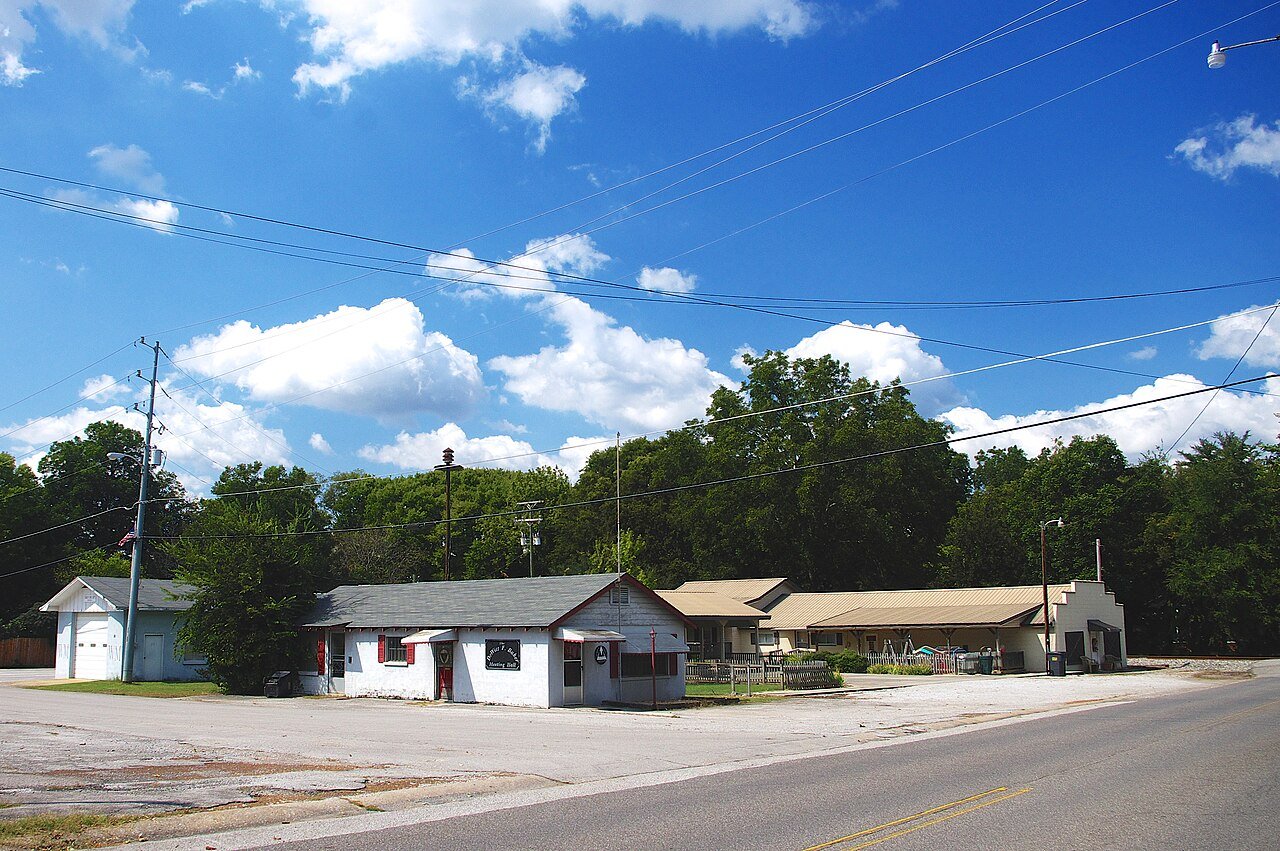
8 Trinity Trinity2,561 people 6.6 per home 431 65
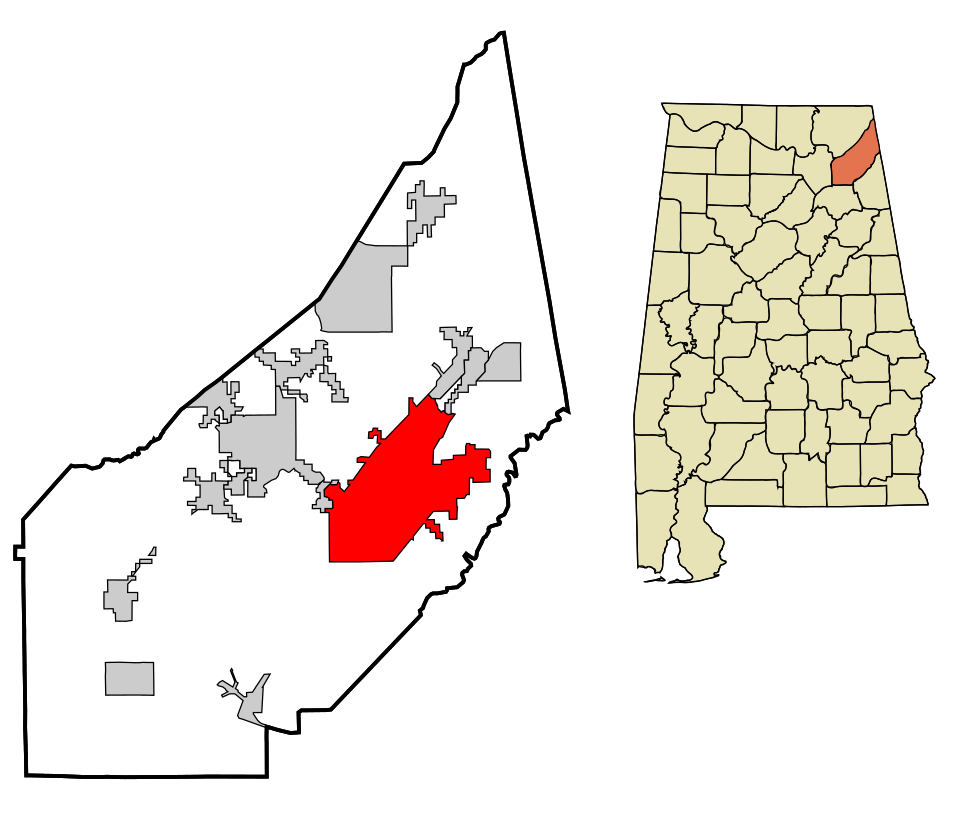
9 Map of Fort Payne Fort Payne14,927 people 6.3 per home 865 137
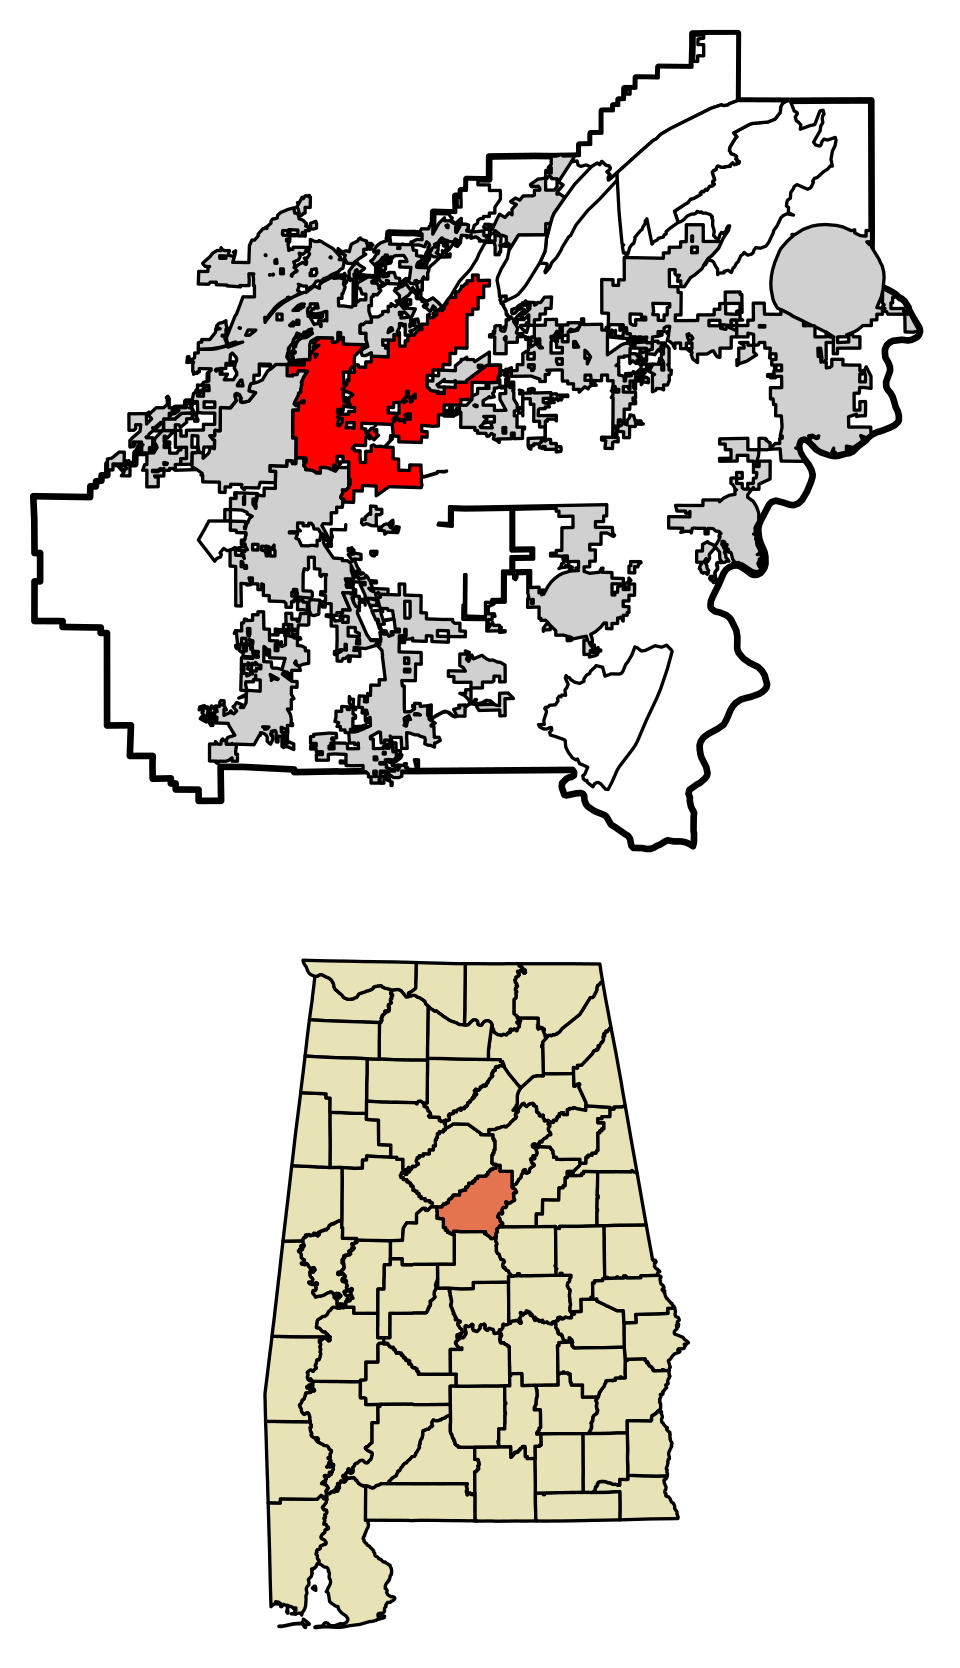
10 Map of Lake View Lake View4,063 people 5.6 per home 1,617 287
11 Northport Northport31,218 people 5.6 per home 7,795 1,395
12 Map of Moundville Moundville3,754 people 5.2 per home 597 115
13 Gardendale Gardendale16,534 people 5.0 per home 2,151 428
14 Boaz Boaz10,814 people 5.0 per home 556 112
15 Cullman Cullman19,319 people 4.7 per home 3,438 731
16 Decatur Decatur57,361 people 4.4 per home 2,255 509
17 Vestavia Hills Vestavia Hills38,616 people 4.4 per home 5,069 1,146
18 Mountain Brook Mountain Brook22,029 people 4.2 per home 2,048 490
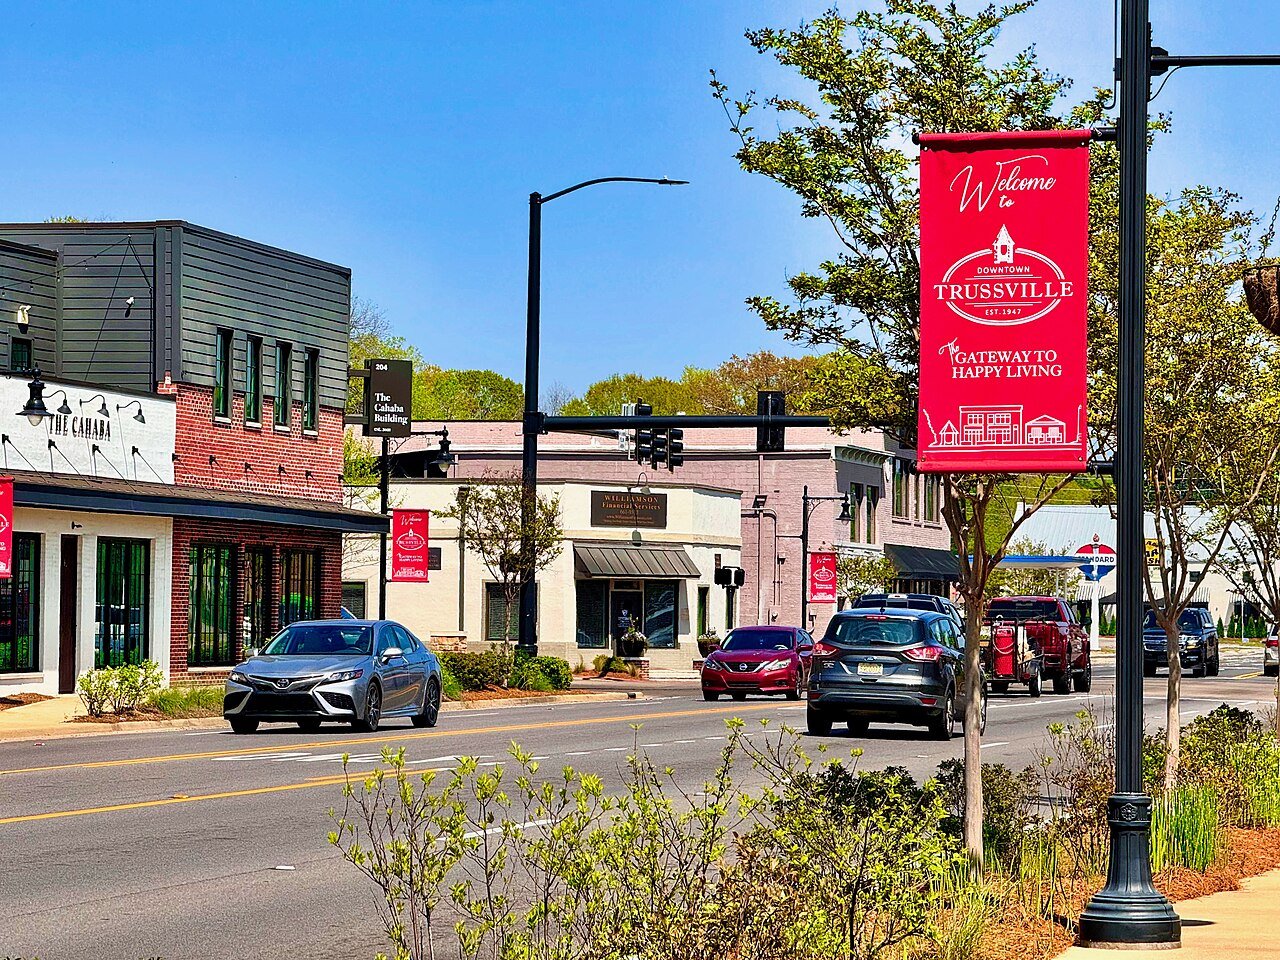
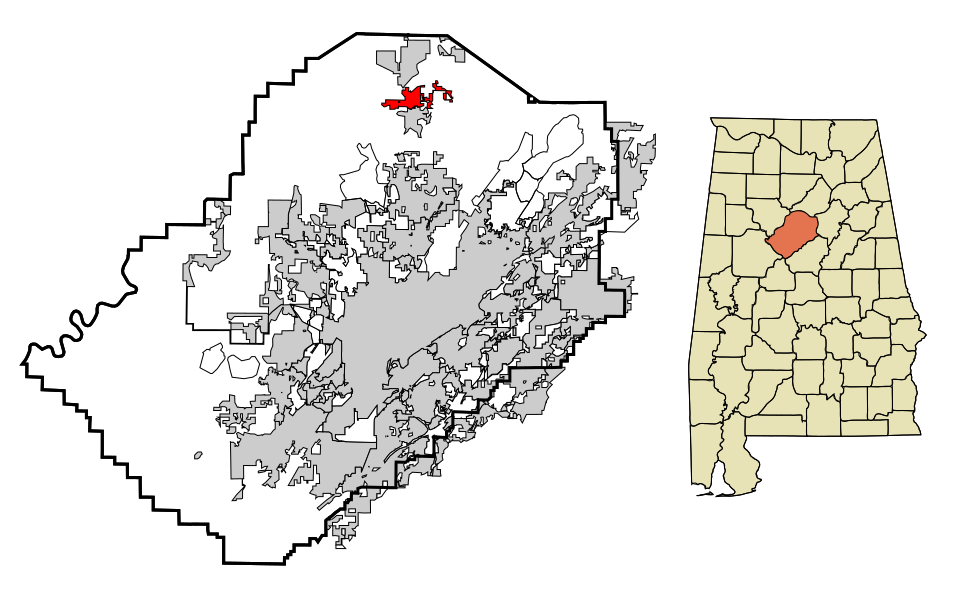
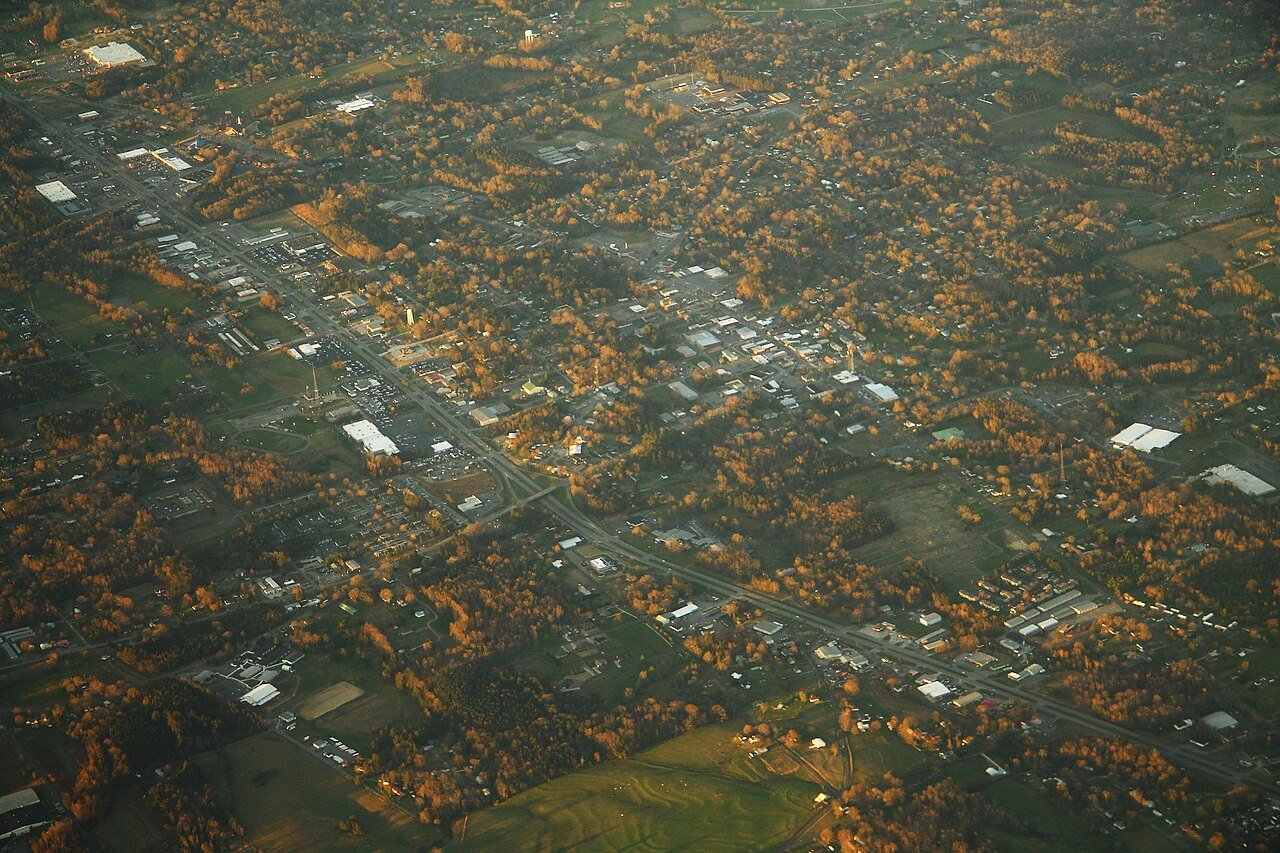
19 Trussville Trussville26,673 people 3.8 per home 6,190 1,629
20 Map of Kimberly Kimberly4,439 people 3.8 per home 1,130 300
21 Arab Arab8,679 people 3.7 per home 411 112
22 Millbrook Millbrook17,189 people 3.6 per home 1,924 536
23 Map of Saraland Saraland16,404 people 3.6 per home 2,766 778
24 Madison Madison60,106 people 3.6 per home 13,995 3,937
25 Alabaster Alabaster33,917 people 3.5 per home 2,932 841
26 Tuscumbia9,115 people 3.5 per home 631 181
27 Loxley Loxley4,357 people 3.4 per home 2,078 609
28 Robertsdale Robertsdale7,194 people 3.4 per home 1,432 426
29 Hartselle Hartselle15,847 people 3.3 per home 1,200 361
30 Chelsea Chelsea16,260 people 3.3 per home 4,799 1,451
31 Map of Rainbow City Rainbow City10,284 people 3.3 per home 589 179
32 Map of Satsuma Satsuma6,822 people 3.3 per home 581 177
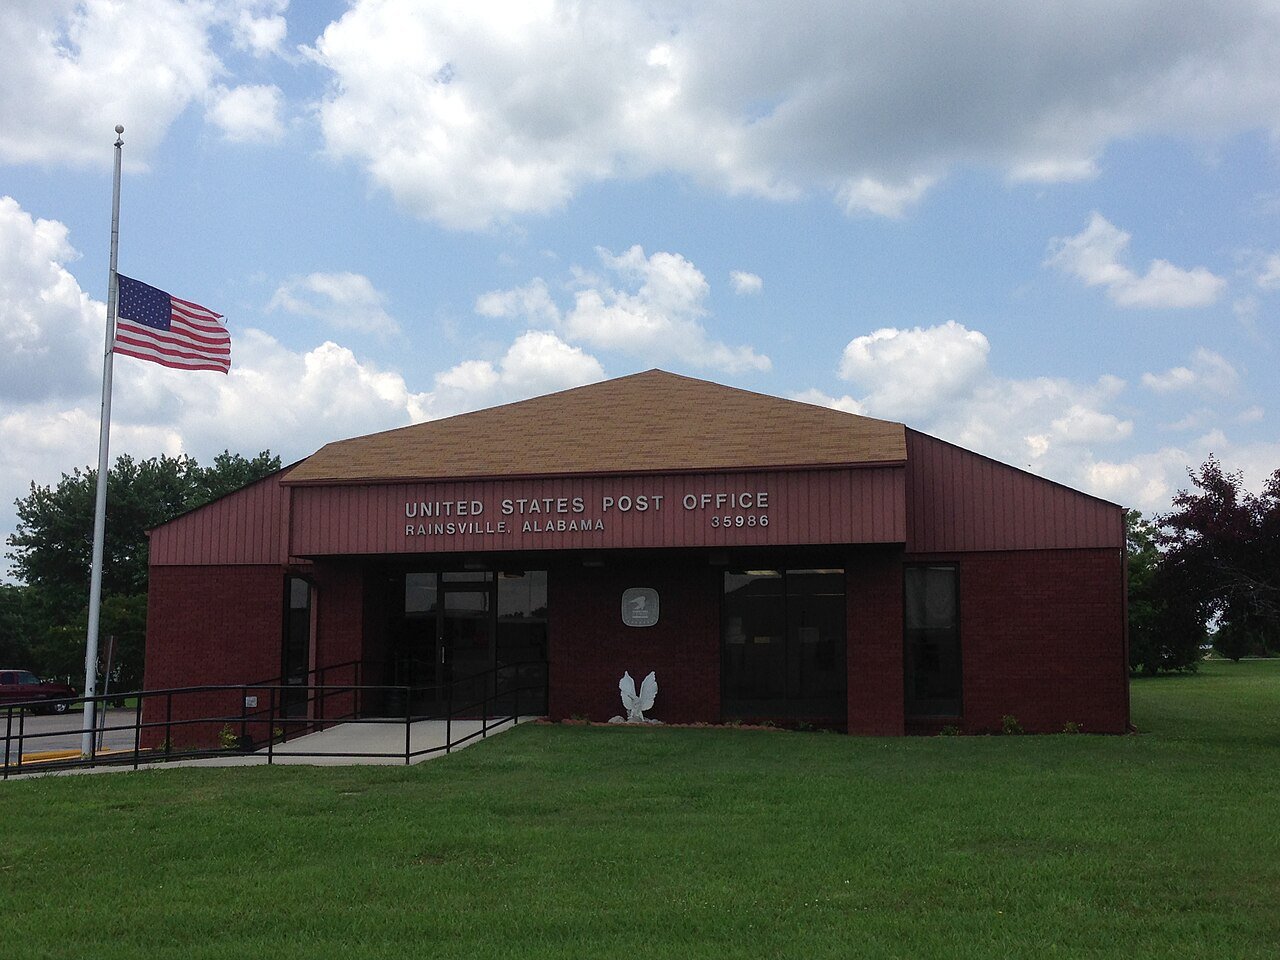
33 Rainsville Rainsville5,702 people 3.2 per home 557 172
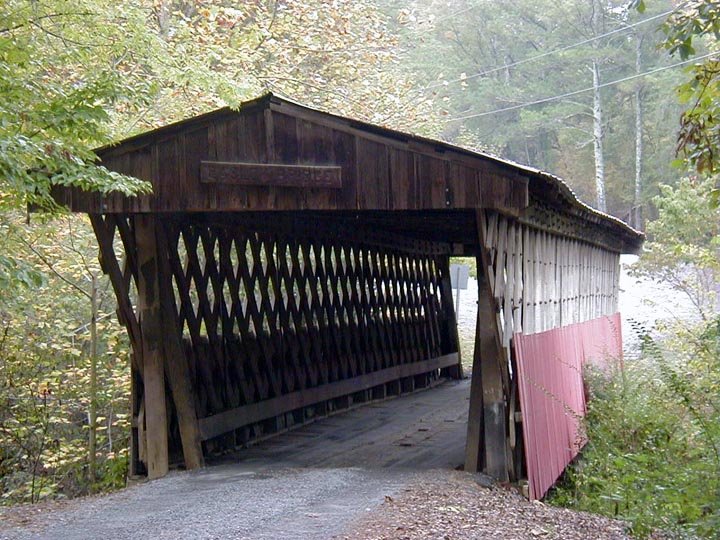
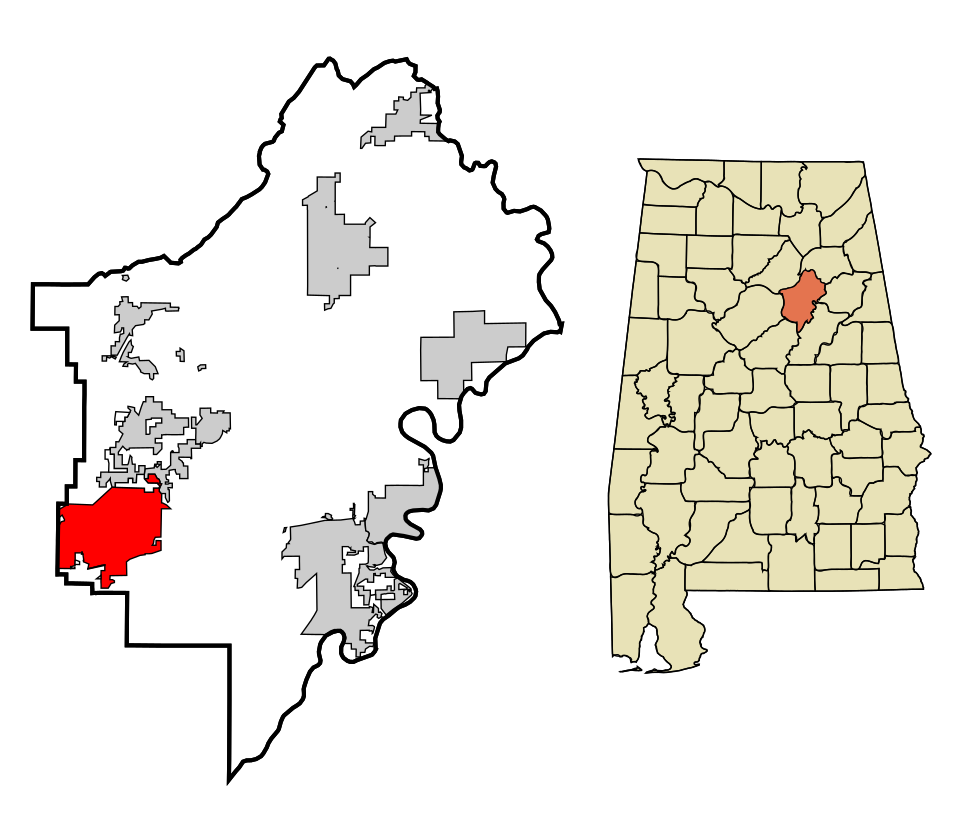
34 Helena Helena21,769 people 3.2 per home 4,121 1,281
35 Calera Calera17,714 people 3.2 per home 4,874 1,512
36 Map of Spanish Fort Spanish Fort10,662 people 3.2 per home 3,251 1,020
37 Map of Owens Cross Roads Owens Cross Roads2,826 people 3.2 per home 1,073 337
38 Map of Weaver Weaver3,324 people 3.1 per home 301 98
39 Map of Pelham Pelham24,827 people 3.1 per home 2,966 972
40 Map of Muscle Shoals Muscle Shoals16,951 people 3.0 per home 3,129 1,029
41 Scottsboro Scottsboro15,712 people 2.9 per home 808 275
42 Hoover Hoover92,642 people 2.9 per home 10,987 3,771
43 Oneonta Oneonta6,971 people 2.9 per home 371 128
44 Map of Moody Moody13,488 people 2.8 per home 1,444 523
45 Gulf Shores Gulf Shores16,401 people 2.7 per home 5,273 1,926
46 Daphne Daphne29,453 people 2.7 per home 5,892 2,223
47 Athens Athens29,002 people 2.6 per home 3,509 1,329
48 Southside Southside9,483 people 2.6 per home 1,014 391
49 Map of Morris Morris2,673 people 2.6 per home 400 155
50 Huntsville Huntsville222,791 people 2.4 per home 34,901 14,362
51 Phenix City Phenix City38,499 people 2.4 per home 5,994 2,496
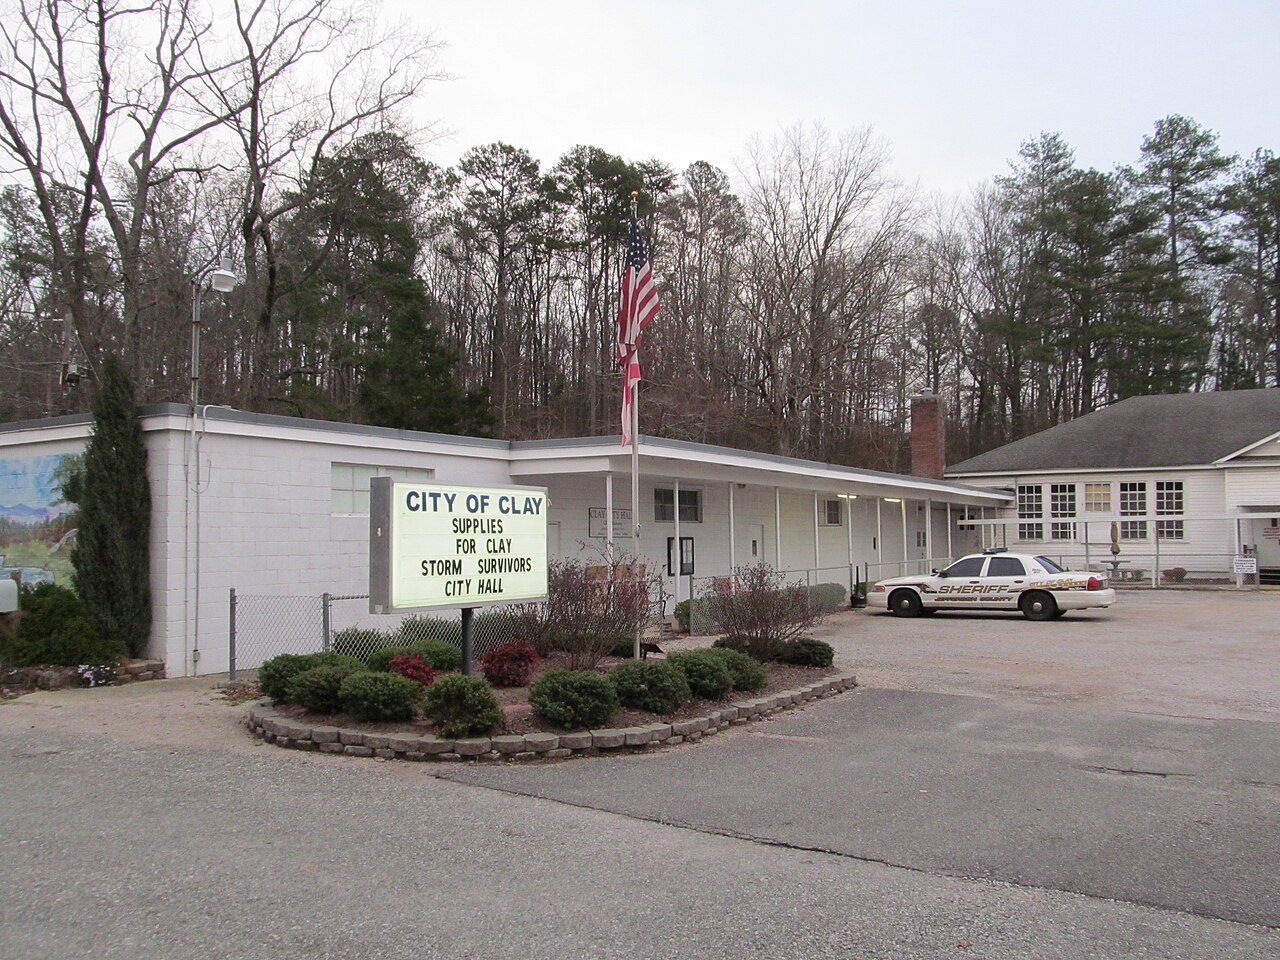
52 Clay Clay10,273 people 2.4 per home 583 247
53 Map of Fairhope Fairhope24,190 people 2.3 per home 7,151 3,120
54 Map of Foley Foley24,026 people 2.3 per home 5,717 2,505
55 Opelika Opelika32,820 people 2.3 per home 4,518 1,994
56 Map of Fultondale Fultondale9,384 people 2.3 per home 1,496 662
57 Orange Beach Orange Beach8,407 people 2.1 per home 2,654 1,239
58 Dothan Dothan71,514 people 2.1 per home 5,576 2,663
59 Prattville Prattville39,482 people 2.0 per home 3,821 1,875
60 Irondale Irondale13,464 people 1.9 per home 1,148 591
61 Headland Headland5,217 people 1.9 per home 463 243
62 Map of Homewood Homewood27,829 people 1.9 per home 1,247 660
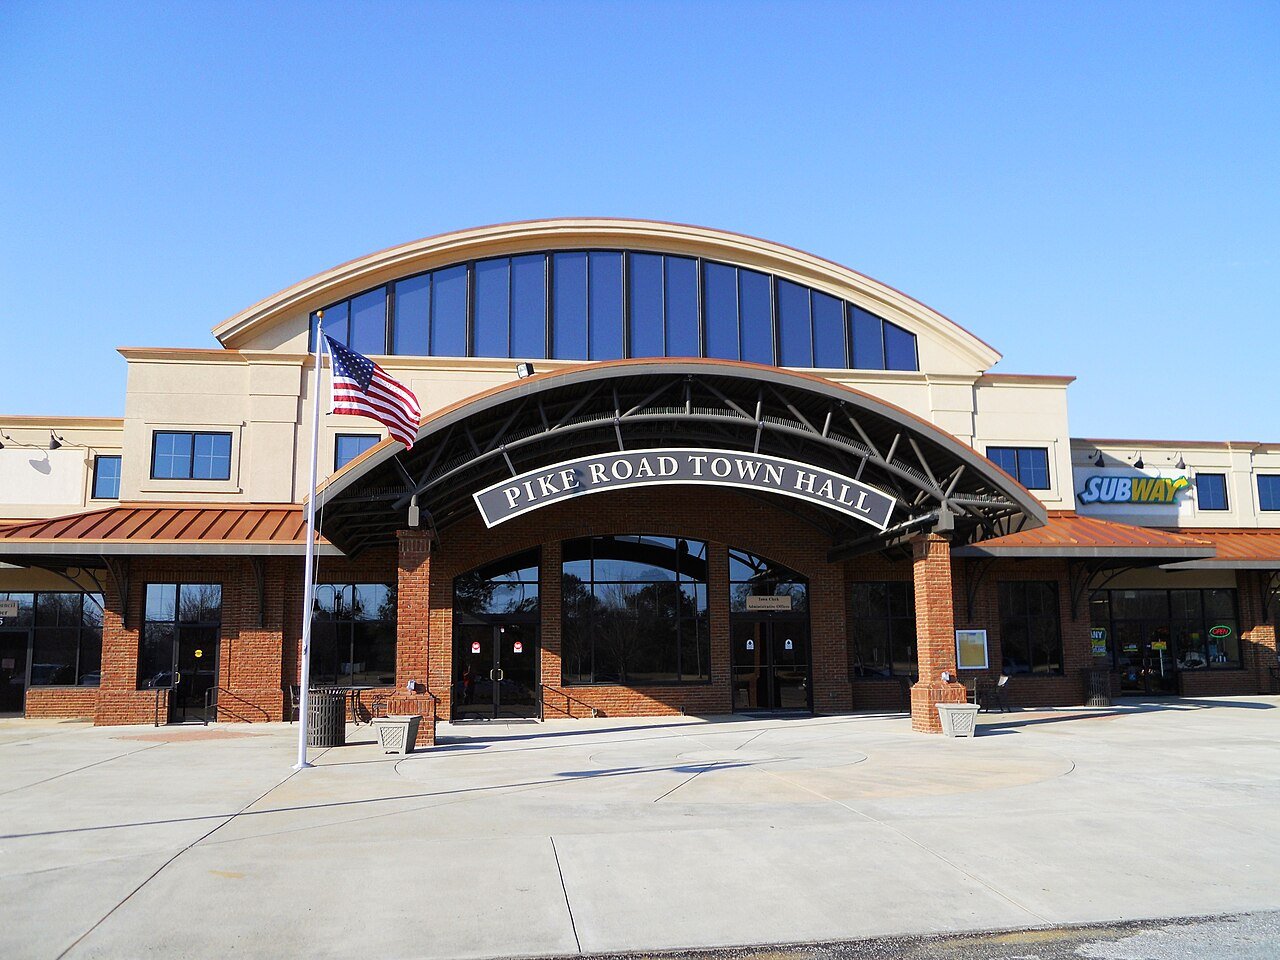
63 Pike Road Pike Road10,574 people 1.8 per home 4,033 2,232
64 Guntersville Guntersville8,916 people 1.8 per home 356 198
65 Sheffield9,340 people 1.8 per home 364 205
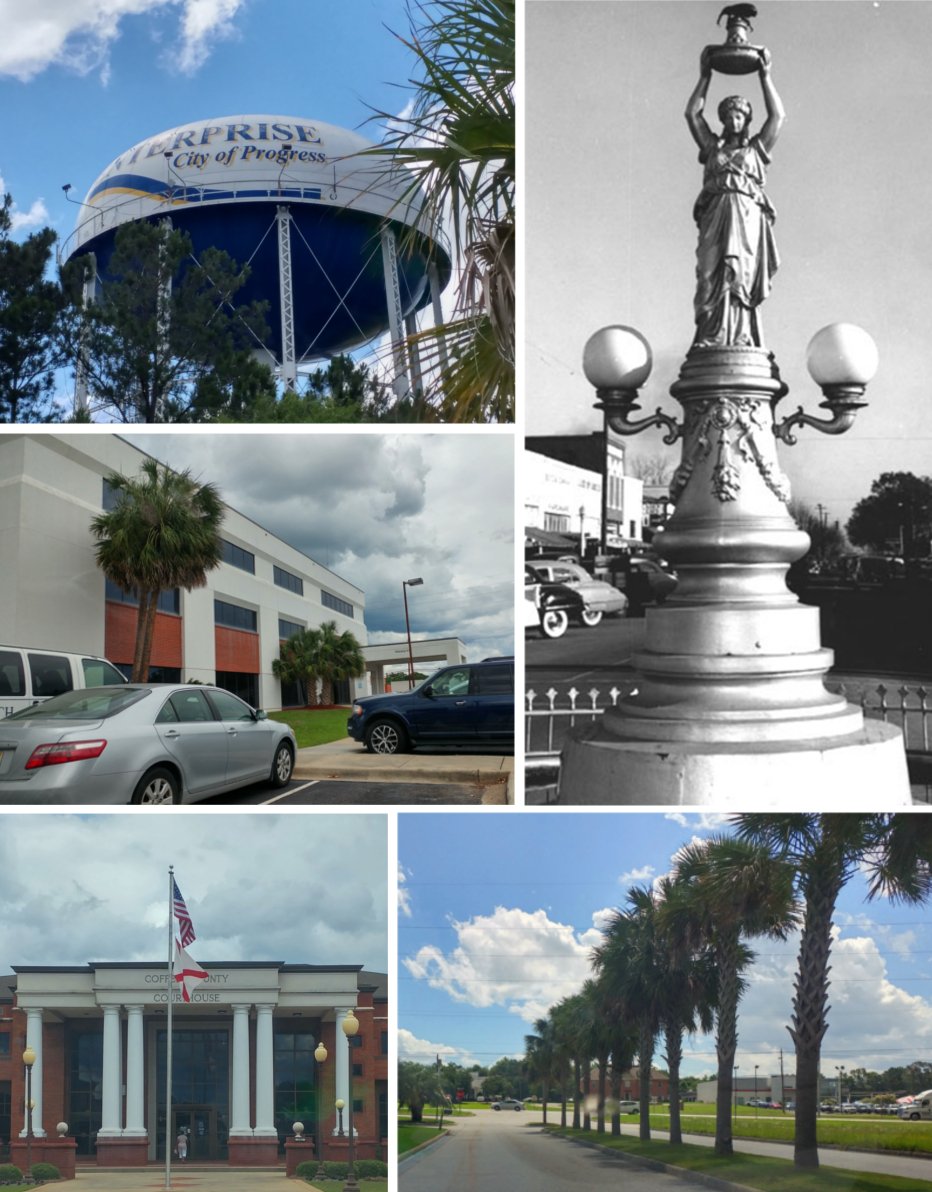
66 Enterprise Enterprise29,505 people 1.7 per home 2,149 1,244
67 Map of Leeds Leeds12,028 people 1.5 per home 551 357
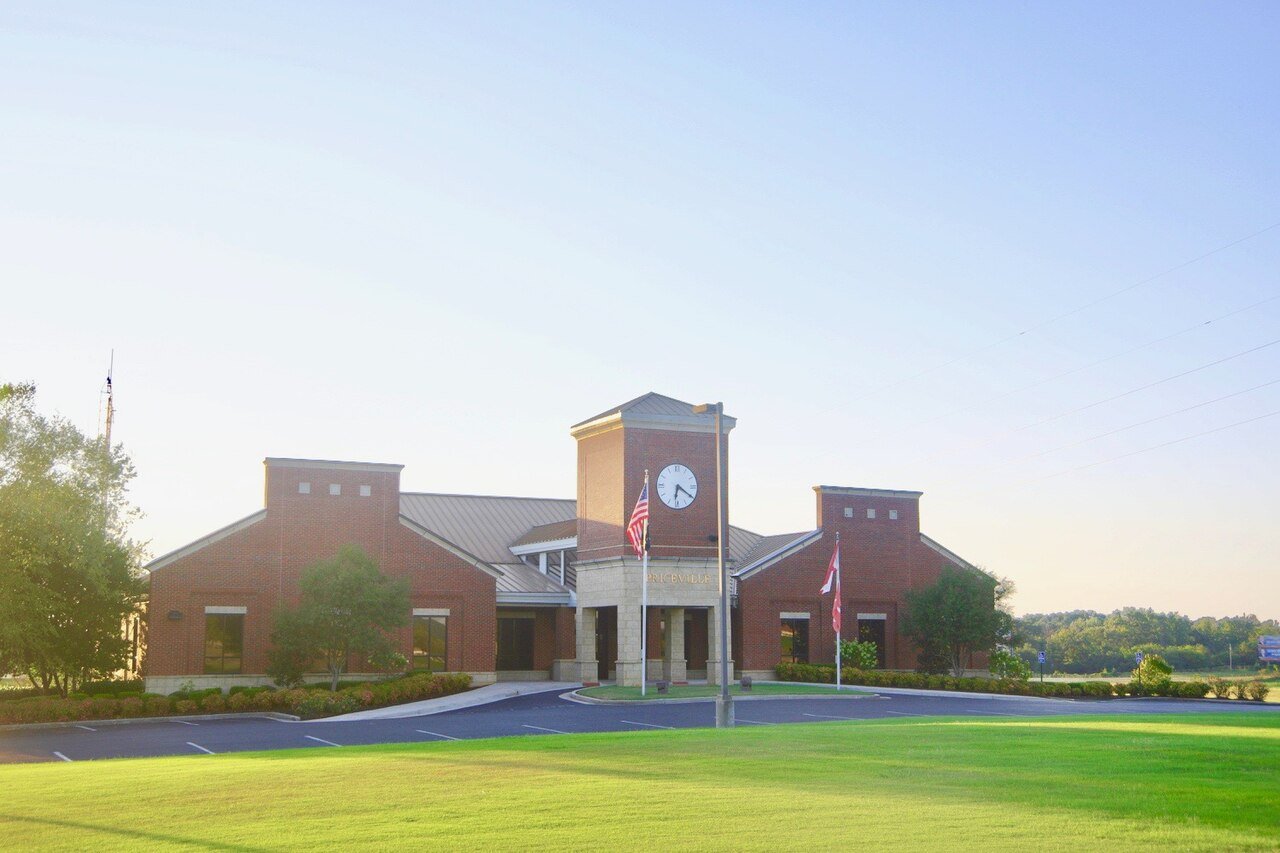
68 Priceville Priceville3,726 people 1.5 per home 854 562
69 Oxford Oxford22,063 people 1.4 per home 721 503
70 Map of Lincoln Lincoln7,305 people 1.1 per home 579 533
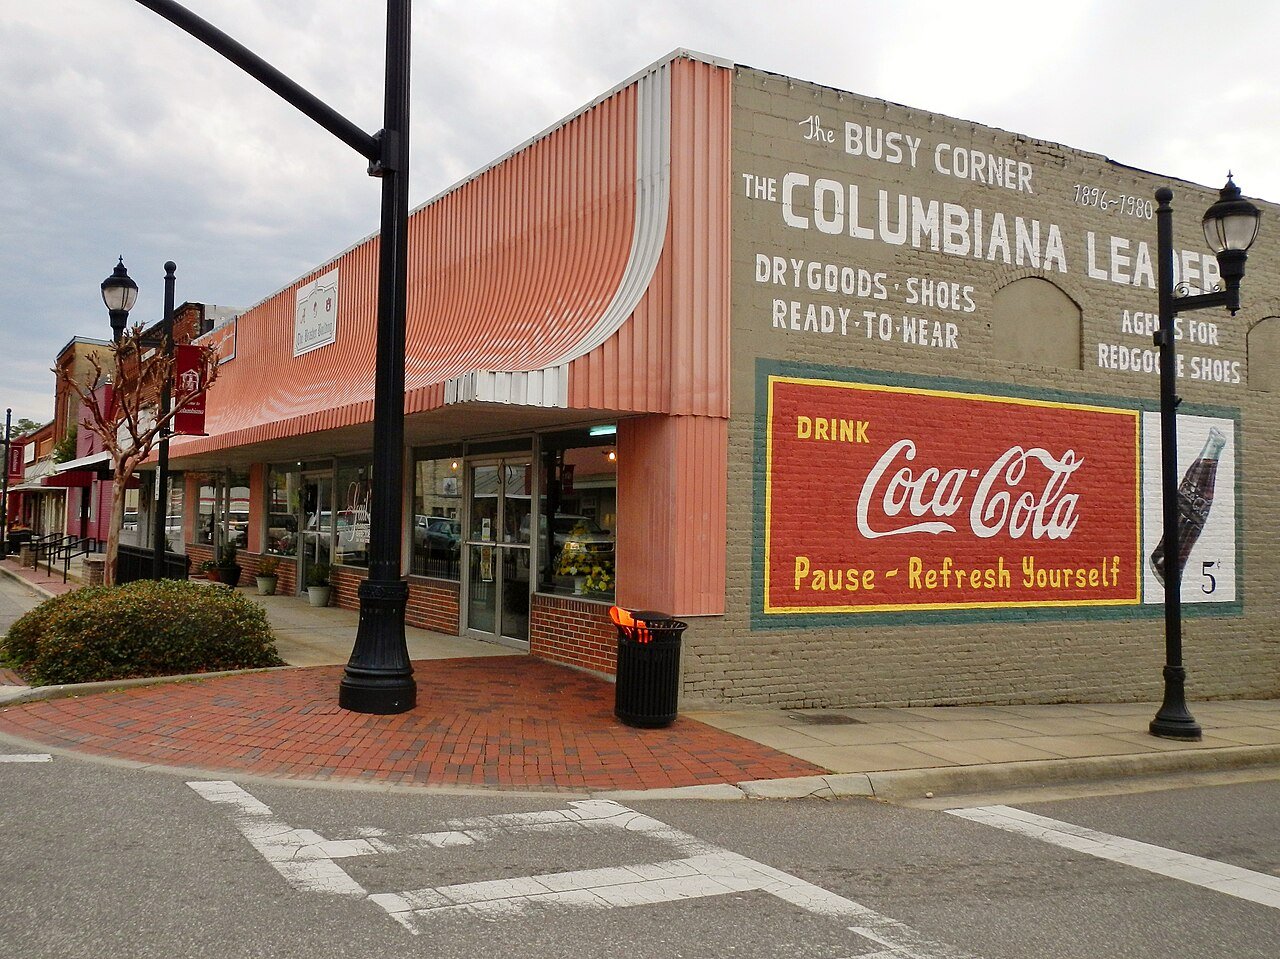
71 Columbiana Columbiana4,725 people 1.0 per home 265 269
72 Wetumpka Wetumpka7,437 people 0.8 per home 692 863
73 Florence Florence41,701 people 0.5 per home 865 1,877

How this ranking works

We take each town’s population change between the 2010 and 2020 censuses and divide it by the new homes its building permits authorized over 2010–2019. The result is how many new residents arrived for every new home. A high number means people came faster than homes were built, so existing homes filled up: larger households, fewer vacancies and tighter supply. The highest ratio ranks #1. Across Alabama it’s 1.8 per home.

Only towns that gained at least 250 residents and permitted at least 10 homes are ranked, because a ratio built on a handful of either is noise. College towns, where 20% or more of residents are enrolled in college, are left out: a growing college adds dorm students as residents, but dorms never show up as permitted homes.

Only towns with at least 2,500 residents are ranked; Census estimates for smaller places are too uncertain. Population and income: U.S. Census Bureau American Community Survey 5-year estimates. New homes: U.S. Census Bureau Building Permits Survey. Residents: 2010 and 2020 decennial censuses. Town photos: Wikimedia Commons, credited on each town’s page.

Same ranking in other states