WVWest Virginia rankings

Most active towns in West Virginia

Ranked by the share of adults who get no exercise outside of work, as estimated by the CDC. 63 towns with 2,500+ residents.
CDC PLACES health estimates, 2025 release

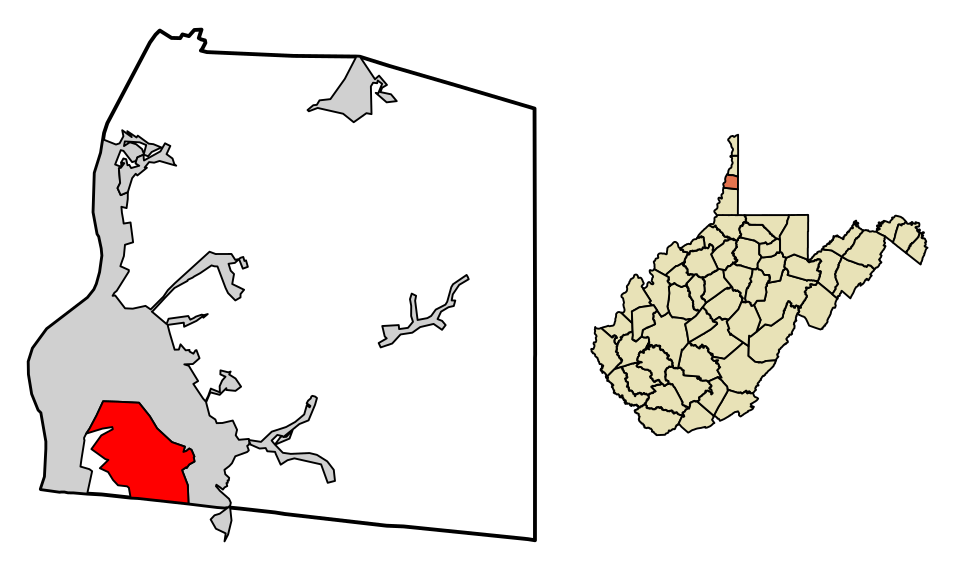
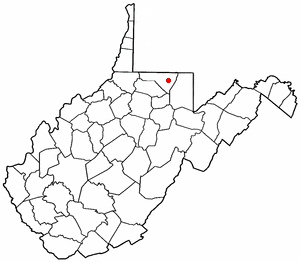
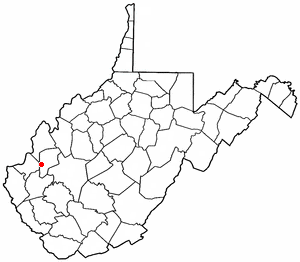
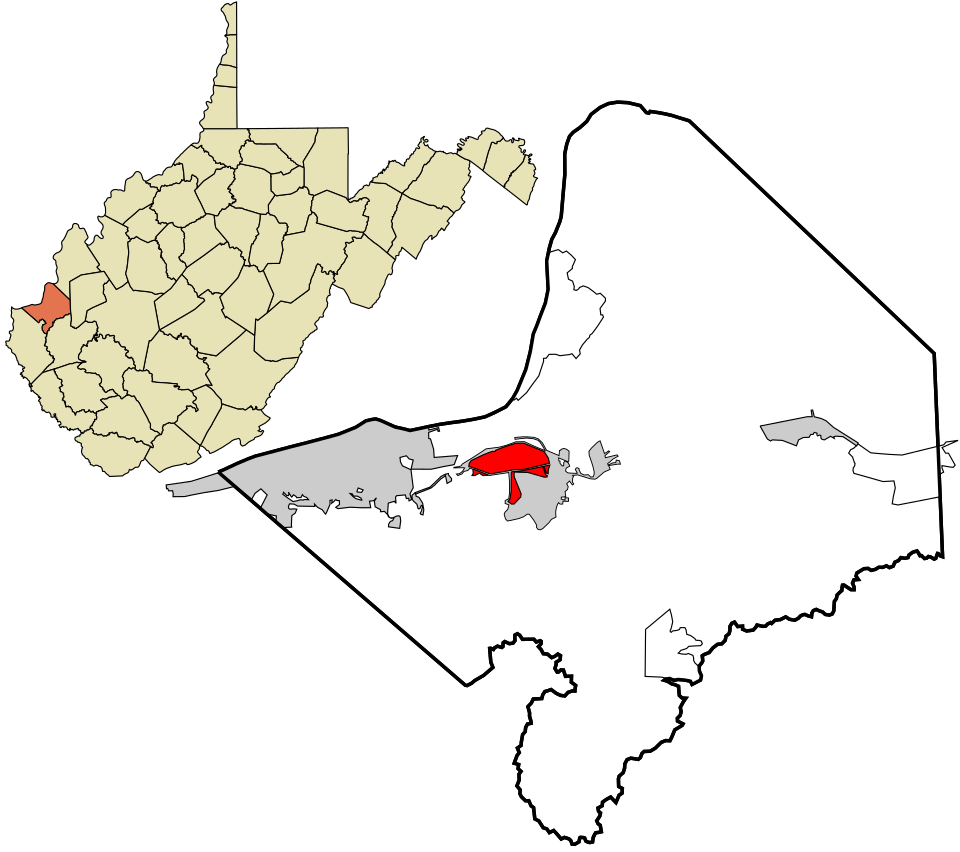
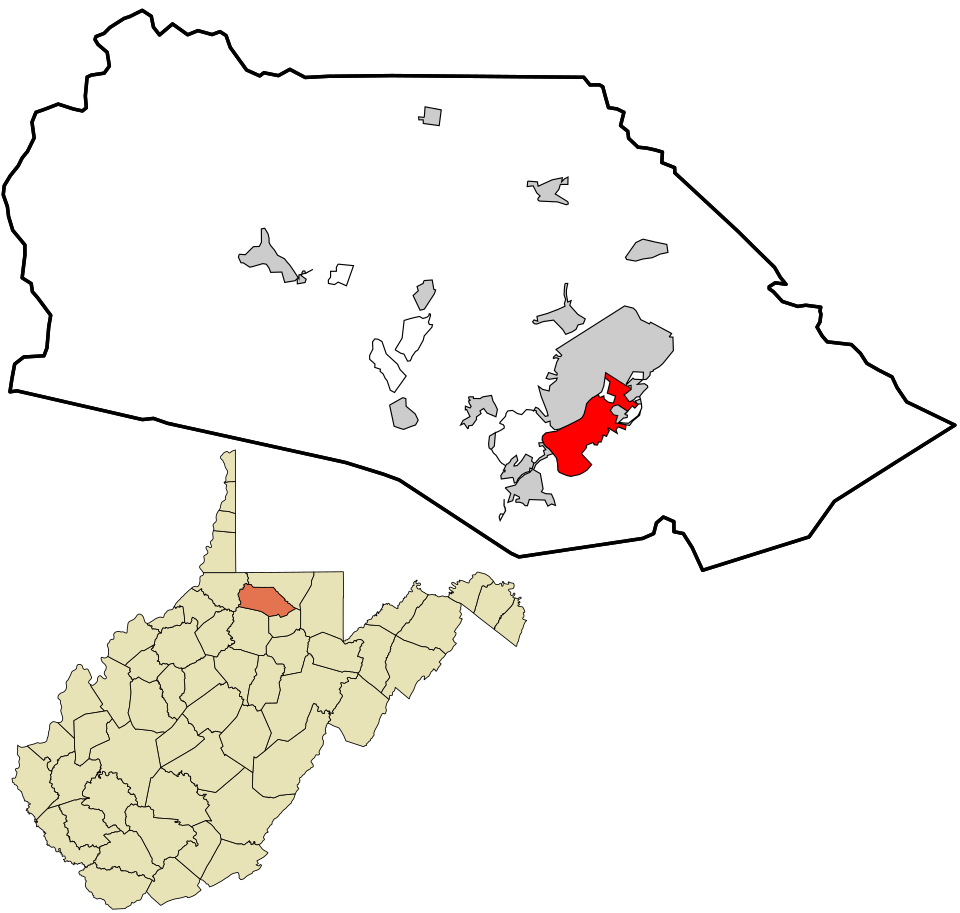
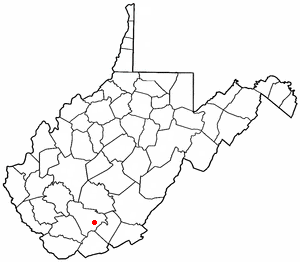
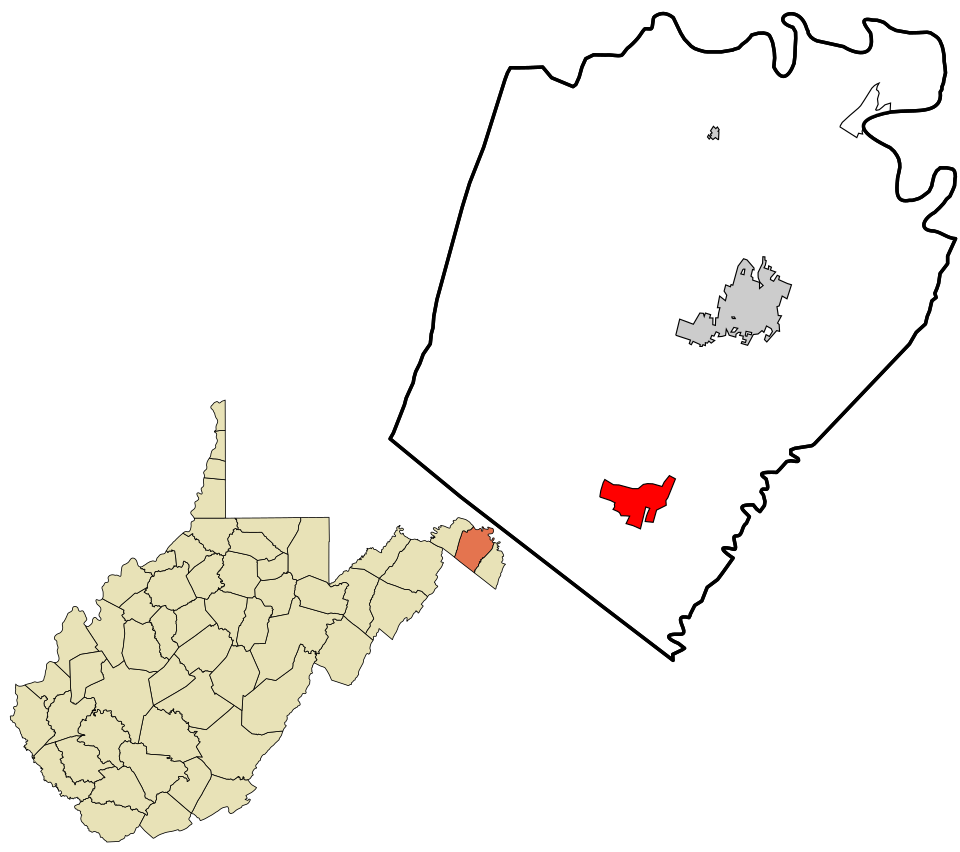
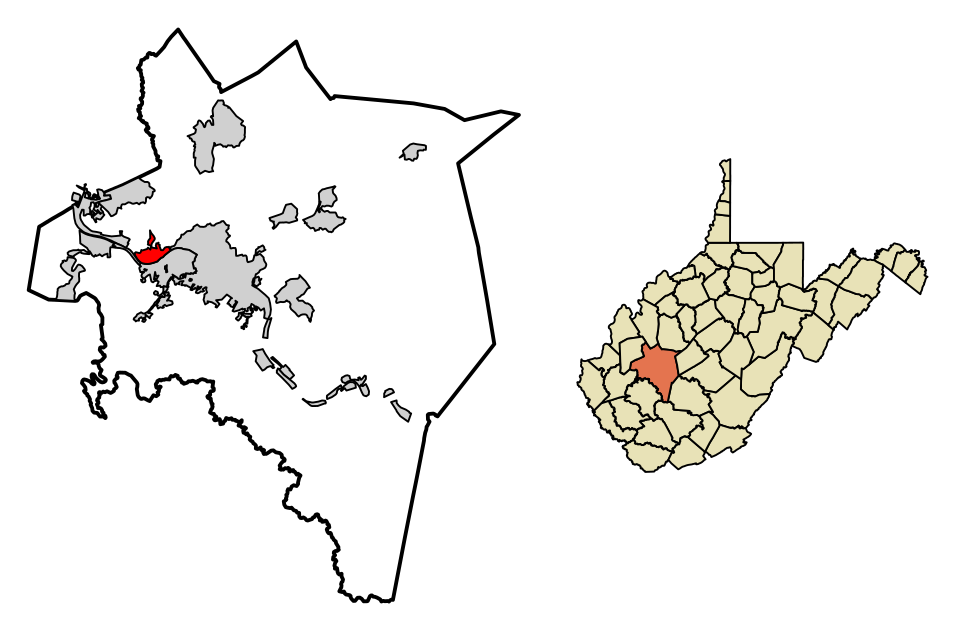
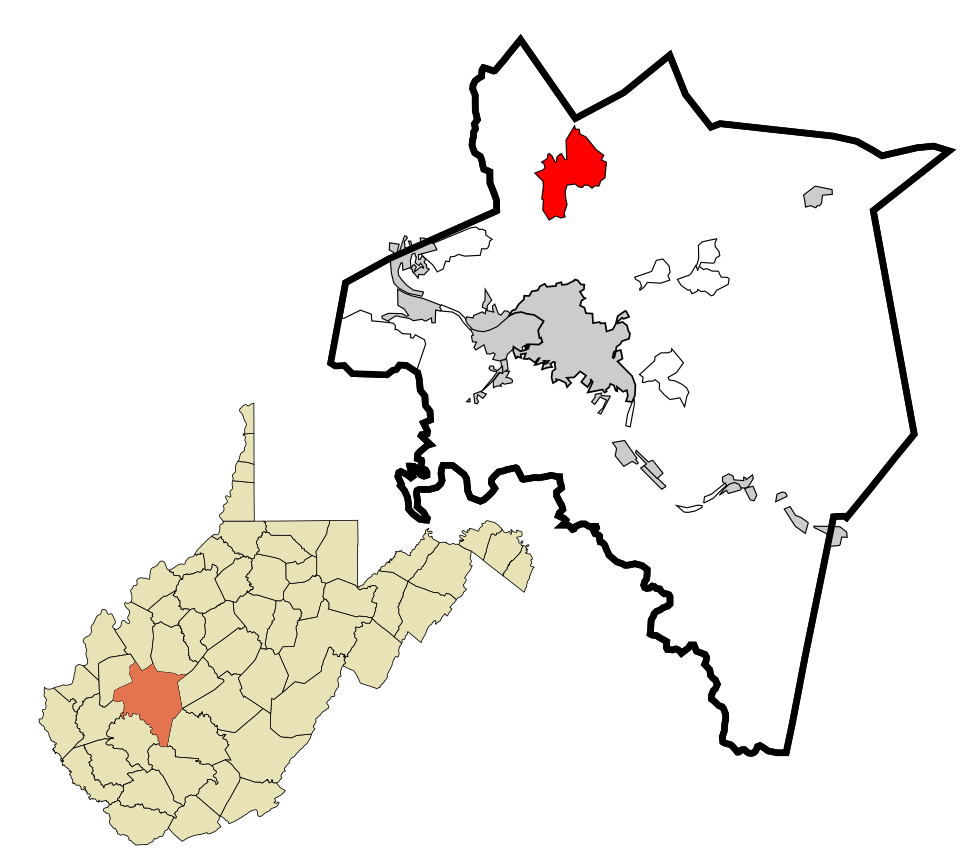
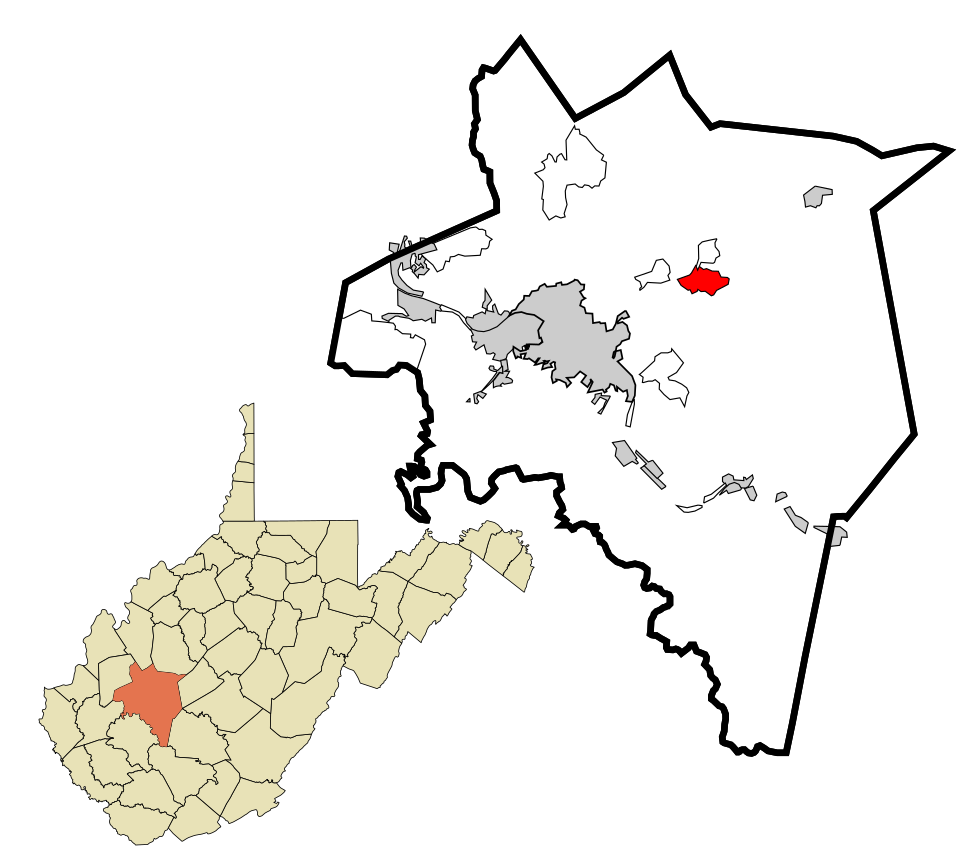
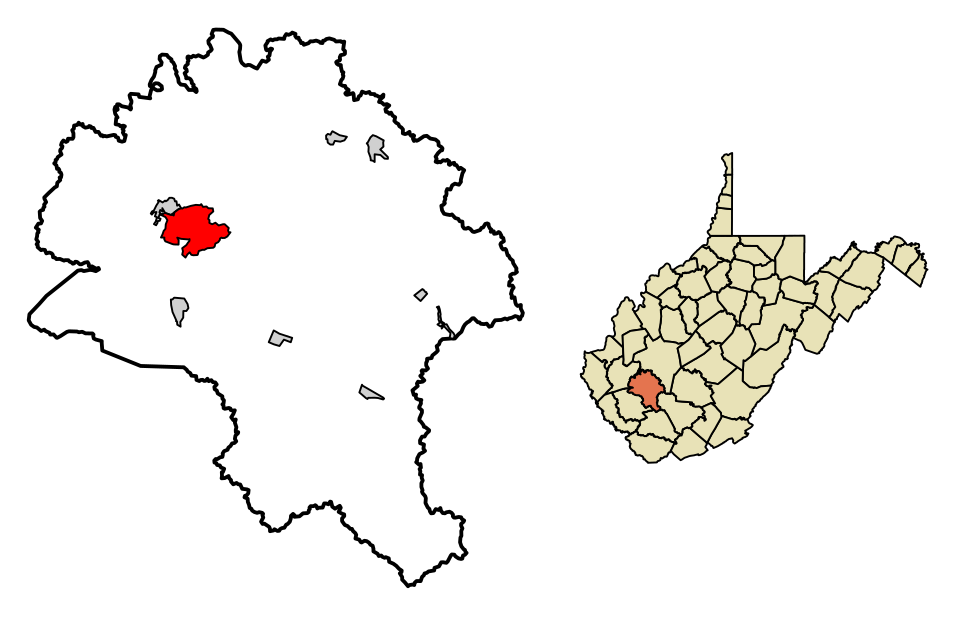
Map of Pinch
West Virginia · Most active

Where Pinch lands: #14 of 63

28% of adults get no exercise (CDC estimate) · Visit Pinch →
#TownGet no exerciseLikely rangePopulation
1 Cheat Lake10,902 people 18% 15–22% 10,902
T2 Bridgeport Bridgeport9,252 people 23% 19–27% 9,252
T2 Map of Bethlehem Bethlehem2,592 people 23% 19–28% 2,592
4 Teays Valley Teays Valley14,151 people 24% 20–28% 14,151
T5 Map of Brookhaven Brookhaven6,212 people 25% 21–30% 6,212
T5 Morgantown Morgantown30,236 people 25% 21–29% 30,236
7 Map of Hurricane Hurricane6,855 people 26% 22–31% 6,855
T8 Westover Westover4,026 people 27% 23–31% 4,026
T8 Williamstown Williamstown2,980 people 27% 22–32% 2,980
T8 Charles Town Charles Town7,337 people 27% 23–31% 7,337
T8 Shannondale3,465 people 27% 22–32% 3,465
T8 Map of Pea Ridge Pea Ridge6,988 people 27% 23–32% 6,988
T8 Map of Cross Lanes Cross Lanes9,671 people 27% 24–31% 9,671
T14 Winfield Winfield2,918 people 28% 23–33% 2,918
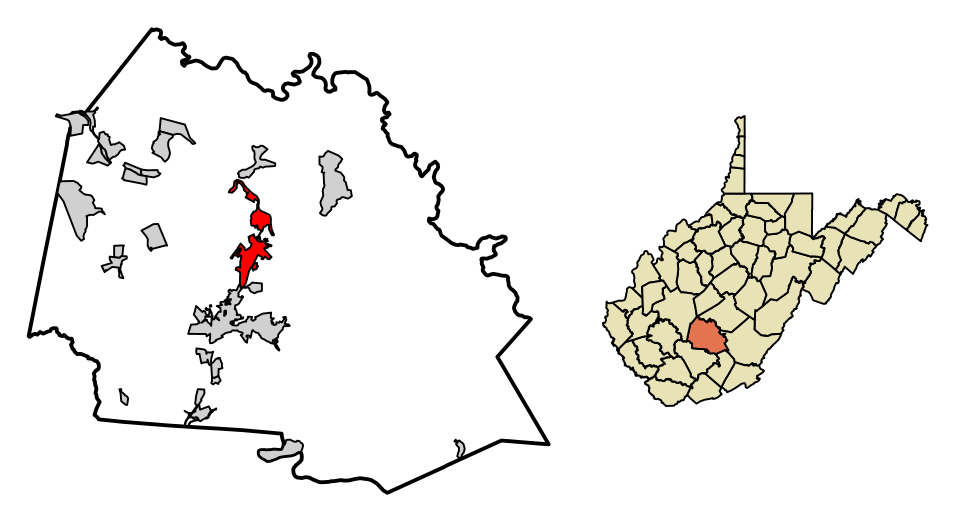
T14 Map of Pinch Pinch4,037 people 28% 23–33% 4,037
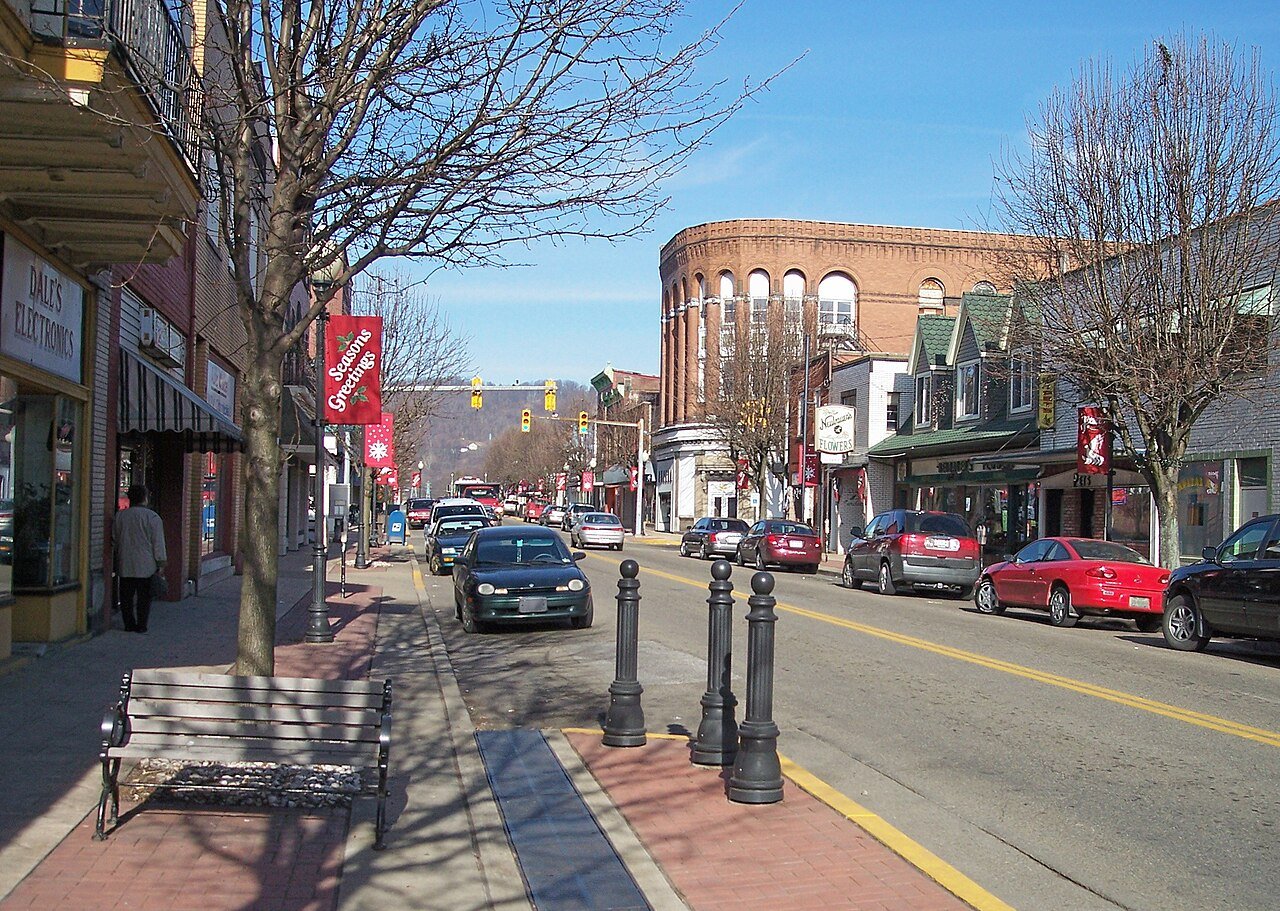
T14 Vienna Vienna10,518 people 28% 25–33% 10,518
T17 Keyser Keyser4,857 people 29% 24–33% 4,857
T17 Milton2,817 people 29% 24–34% 2,817
T17 Map of Pleasant Valley Pleasant Valley3,482 people 29% 24–34% 3,482
T17 Follansbee Follansbee2,757 people 29% 24–34% 2,757
T17 Map of Culloden Culloden3,040 people 29% 25–33% 3,040
T22 Map of Shady Spring Shady Spring3,381 people 30% 25–35% 3,381
T22 Lewisburg Lewisburg3,835 people 30% 25–35% 3,835
T22 Map of Blennerhassett Blennerhassett3,282 people 30% 26–35% 3,282
T22 Barboursville Barboursville4,376 people 30% 26–35% 4,376
T22 Map of Inwood Inwood2,794 people 30% 26–35% 2,794
T22 Fairmont Fairmont18,221 people 30% 26–35% 18,221
28 Charleston Charleston47,421 people 31% 27–34% 47,421
T29 Map of Weirton Weirton18,647 people 32% 27–36% 18,647
T29 Kingwood Kingwood2,973 people 32% 26–37% 2,973
T29 Ranson corporation5,729 people 32% 27–37% 5,729
T29 Buckhannon Buckhannon5,116 people 32% 27–37% 5,116
T29 White Sulphur Springs White Sulphur Springs2,549 people 32% 27–37% 2,549
T29 South Charleston South Charleston13,457 people 32% 28–36% 13,457
T35 Wheeling Wheeling26,350 people 33% 28–37% 26,350
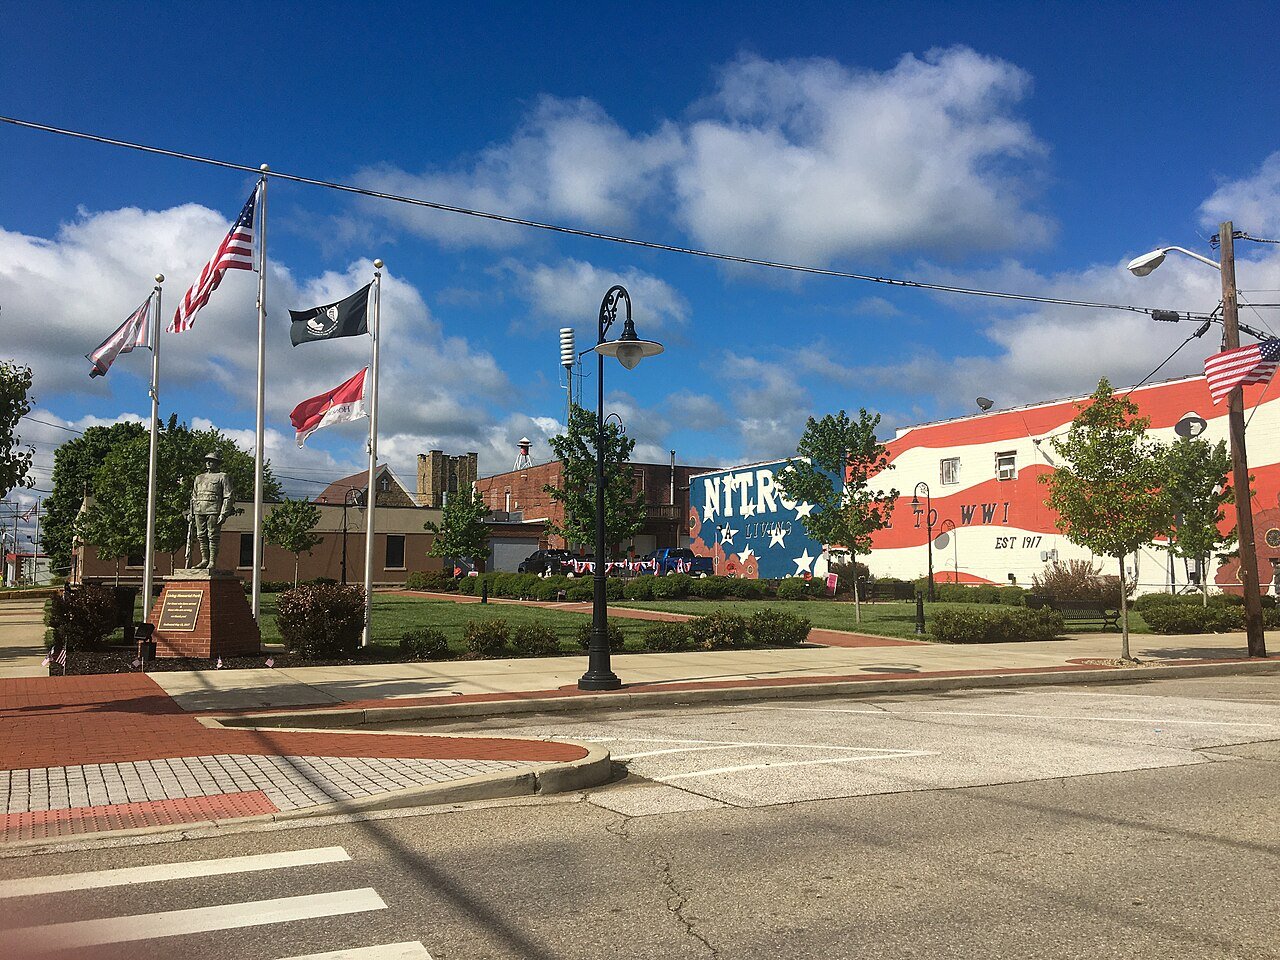
T35 Nitro Nitro6,853 people 33% 29–36% 6,853
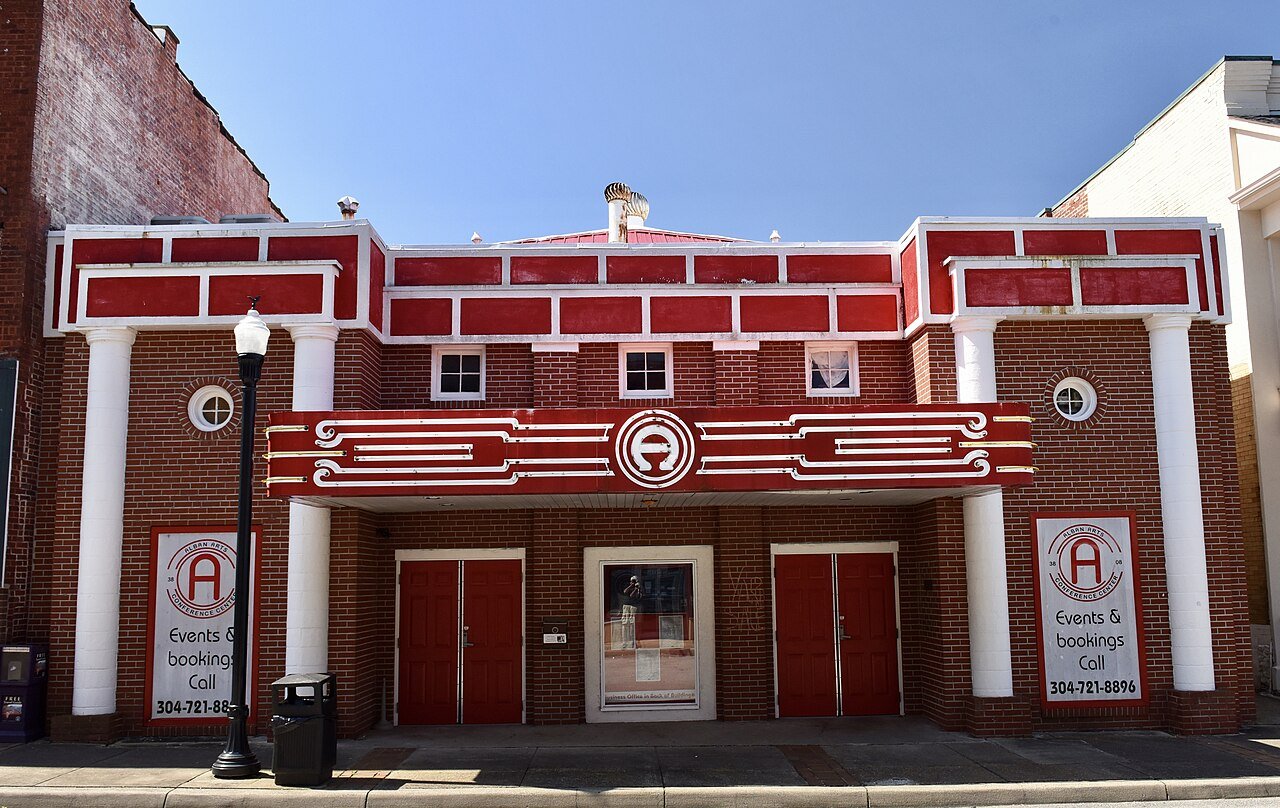
T35 St. Albans St. Albans10,522 people 33% 29–37% 10,522
T35 Map of Dunbar Dunbar7,254 people 33% 29–37% 7,254
T35 Elkins Elkins6,811 people 33% 28–38% 6,811
T35 Summersville Summersville3,373 people 33% 28–40% 3,373
T35 Philippi Philippi2,861 people 33% 27–39% 2,861
T42 Clarksburg Clarksburg15,549 people 34% 29–39% 15,549
T42 Huntington Huntington45,787 people 34% 30–38% 45,787
T42 Map of Fayetteville Fayetteville2,817 people 34% 29–40% 2,817
T45 Moundsville Moundsville7,869 people 35% 30–40% 7,869
T45 Map of Madison Madison2,788 people 35% 30–40% 2,788
T45 Princeton Princeton5,736 people 35% 31–41% 5,736
T48 New Martinsville New Martinsville5,133 people 36% 31–41% 5,133
T48 Bluefield Bluefield9,387 people 36% 32–41% 9,387
T48 Oak Hill Oak Hill7,937 people 36% 31–41% 7,937
T51 Ripley Ripley3,071 people 37% 31–43% 3,071
T51 Grafton Grafton4,618 people 37% 32–43% 4,618
T51 Weston Weston3,840 people 37% 32–43% 3,840
T51 Map of Sissonville Sissonville3,593 people 37% 33–42% 3,593
T55 Martinsburg Martinsburg18,904 people 38% 33–42% 18,904
T55 Beckley Beckley16,818 people 38% 33–42% 16,818
T55 Parkersburg Parkersburg29,240 people 38% 34–43% 29,240
T58 Point Pleasant Point Pleasant3,961 people 39% 33–45% 3,961
T58 Kenova Kenova2,944 people 39% 33–45% 2,944
T58 Ravenswood Ravenswood3,830 people 39% 33–45% 3,830
61 Moorefield Moorefield2,525 people 40% 34–46% 2,525
62 Welch Welch3,507 people 41% 35–47% 3,507
63 Williamson Williamson2,919 people 43% 37–50% 2,919

How this ranking works

We rank every town by the share of adults who get no exercise outside of work, as estimated by the CDC. The lowest share ranks as the most active. The lowest share ranks #1. Across West Virginia it’s 33%.

These are the CDC’s modeled estimates, not a count: national survey answers combined with each area’s age, sex, race and income mix. Each carries a likely range (shown in the table), so we rank on the whole percent and towns at the same figure share a rank (T = tied). Differences of a point or two are within the estimates’ margins.

Cities and villages use the CDC’s own estimate for that place. New England towns and townships, which the CDC doesn’t publish, use the ZIP codes that cover them, weighted by land area.

Only towns with at least 2,500 residents are ranked; Census estimates for smaller places are too uncertain. Population and income: U.S. Census Bureau American Community Survey 5-year estimates. Health estimates: CDC PLACES. Town photos: Wikimedia Commons, credited on each town’s page.

Same ranking in other states