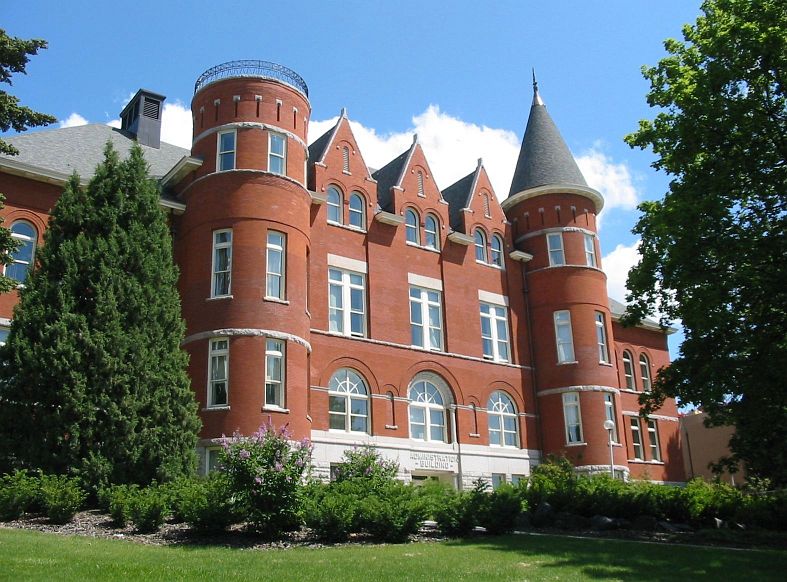
c. 1892 · from Pullman’s archive PullmanWA
A town of 32,229. Public schools that outperform most of Washington.
Wikimedia Commons
Population
32,229
+10.4% since 2010
Typical home
$434K
−1.9% in a year
Household income
$47K
median
Jobs based here
14,677
Balanced
What makes Pullman stand out The 3 things Pullman does most differently from other towns.
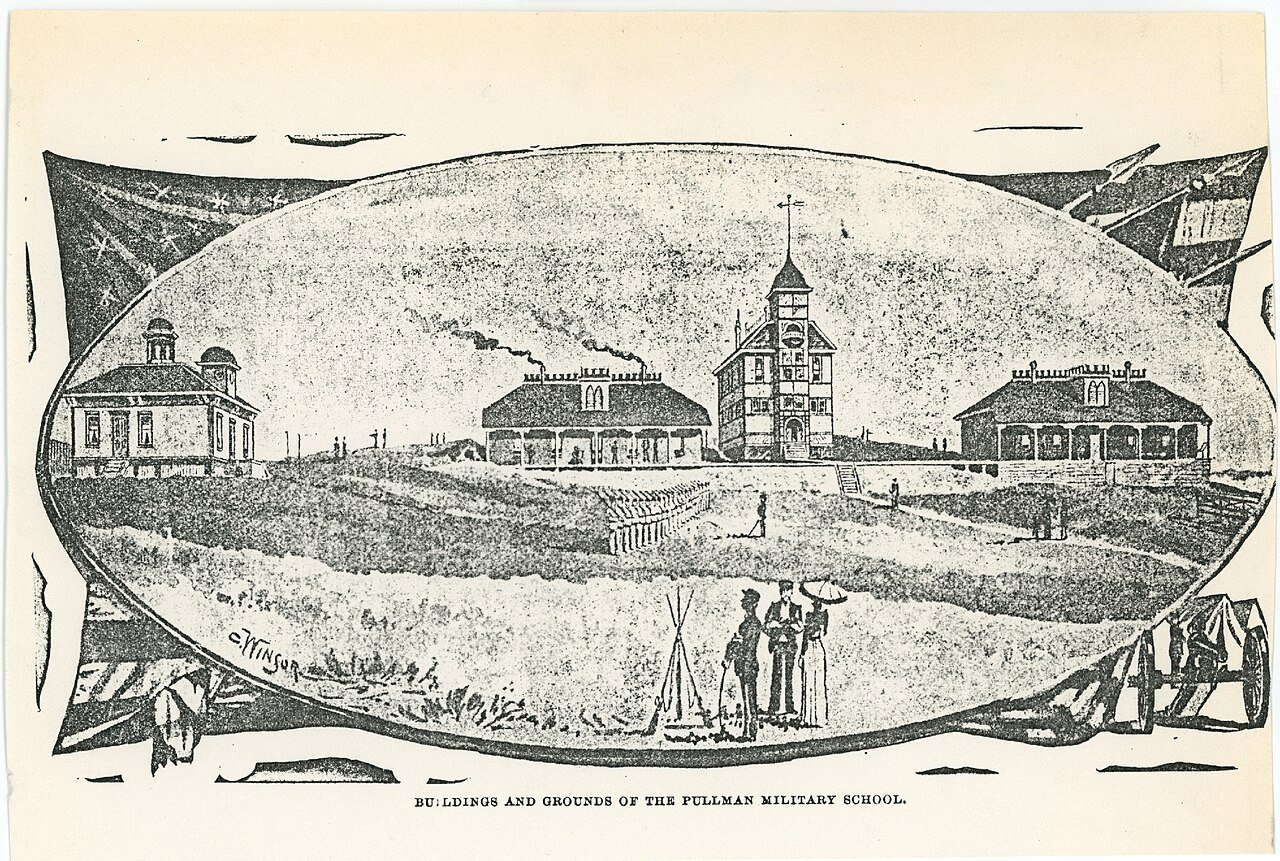
c. 1892 · Pullman School buildings, Pullman, Washington, circa 1892 - DPLA - 9a3b6bed4f2a06bd7331c549f21c7389 · Wikimedia Commons
Pullman’s story
Pullman in pictures
6 postcards, papers and photographs from public archives, and 12 places on the National Register.
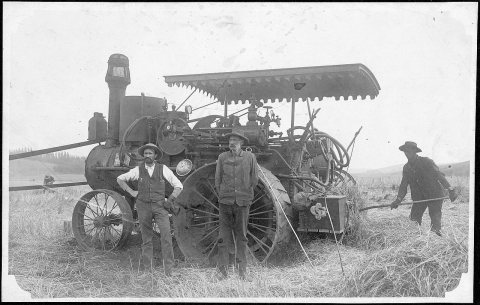
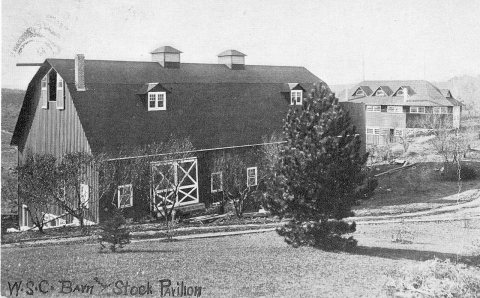
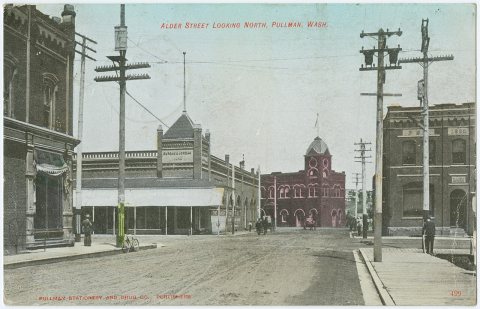
c. 1892 Pullman School buildings, Pullman, Washington, circa 1892 -… c. 1905 Gaar-Scott steam engine, Albion, Washington, circa 1905 - D… c. 1908 Alder Street, looking north, Pullman, Washington, circa 190… 1908 W.S.C. [Washington State College] from top of the Totem Pole Explore the history →
College town
45% of Pullman is in college
Residents weigh in
Pullman is #282 of 284 in WA for “Highest income”. Fair?
Agree Disagree
Your answer becomes a post in Pullman’s Town Square. Ask me another →
Share something about Pullman… Post Start a conversation
In the news: Pullman vs Clarkston - Boys Varsity Football 09/25/2026 | Watch Live … → How do you get to work from Pullman? → What do families love about Pullman’s schools? → Is Pullman still affordable for young families? →
Upcoming events
Nothing on the calendar. Add an event
The data Ordered by what stands out in Pullman. Another town gets a different order.
Work & commute
About half of working residents work right in Pullman 60% of Pullman’s working residents work right in town. The top destinations are Moscow (6%), Spokane (3%) and Richland (2%). Half commute less than 2 miles.
60% work in town
Where working residents work In Pullman 60%
Moscow 6%
Spokane 3%
Richland 2%
Lewiston 2%
2 mi
median commute distance
14,677
jobs based in Pullman
Balanced
jobs vs. working residents
Schools
Pullman’s public schools outperform 93% of Washington districts The public schools Pullman’s kids attend, from kindergarten through graduation, outperform 93% of Washington’s districts on state tests and graduation. Among towns with similar incomes, they rank near the top.
A School Grade
Housing
A typical Pullman home is worth about $434K The typical Pullman home is worth about $434,000, down 1.9% in a year, 27% below the Washington typical home.
$434K Zillow home value
Typical home value Pullman $434K
Washington $592K
Market temperature
Seller’s market A seller's market Buyer’s Seller’s −1.9%
value change, 1 year
Outdoors
3.4% of Pullman is conserved land 15 miles of trails across 17 parks and preserves.
#75 for trails in WA
Green: conserved land · dashed: trails · numbers: the places below 3.4%
conserved · 239 of 7,065 acres
15 mi
of trails · 1.4 per sq mi
Biggest places to walk Trails Acres 1. Washington State University Arboretum 1.8 mi 110 2. Conservation Park 1.1 mi 19 3. Sunnyside Park 1 mi 21
Health
Healthier than 78% of U.S. towns Pullman beats the Washington average on 8 of 26 CDC measures and trails it on 7.
A− Health Grade
26 measures vs. Washington
What stands out Pullman WA Fewer adults who have had cancer 3.8% 7.9% Fewer adults with arthritis 13% 24.4% More adults in frequent mental distress 24.4% 16.4%
Pullman Regional Hospital
1.4 mi away · emergency room
3 of 3
care shortages: primary care, dental, mental health
60th
percentile among WA towns
Natural hazards
Low risk, with inland flooding at the top Expected storm and flood damage is higher than in 25% of U.S. communities.
25 risk score of 100
FEMA risk score
25 Low risk Lower Higher Inland flooding Cold waves Heat waves
24
paid flood claims since 1979
1
federal disasters paid out here
Climate
Four seasons, pleasant summers Pullman has chilly, snowy winters and pleasant summers, with very little rain. A typical July afternoon reaches 84°, a January night drops to 27°, and about 33 inches of snow falls in a normal winter.
33″ snow a winter
Typical low → high °F Winter 27–39°
Spring 37–58°
Summer 49–80°
Fall 37–60°
Sep 29
typical first frost
+1.7°
vs. the 20th-century average
Safety
Less crime per resident than 61% of U.S. towns Pullman reports less crime per resident than 61% of the U.S. towns and cities we grade.
B Safety Grade
Violent crime per 1,000 residents Pullman 1.5
Washington 2.9
U.S. 3.3
Property crime per 1,000 residents Pullman 7.8
Washington 20.2
U.S. 15.5
61st
percentile among U.S. towns we grade
80th
percentile among WA towns
52
violent crimes reported in 2025
263
property crimes reported in 2025
A growing town Pullman has grown 10.4% since 2010 29,799 people in 2010; 32,229 today.
What’s changed most in Pullman? 29,799 2010
32,901 2020
32,229 Today
U.S. Census 2010 & 2020 · ACS
Landmarks 12 places in Pullman on the National Register of Historic Places.
All landmarks → Famous people from Pullman 35 notable people were born in Pullman.
See all 35 →