Sign inJoin

← How Lead ranks

South Dakota rankings · Climate

Towns with the coolest summers in South Dakota

Ranked by the typical afternoon high in July, 1991–2020, from NOAA’s gridded climate normals for each town. Neighboring towns on the same 5 km grid square have the same numbers, so each square is listed once, under its largest town. 37 towns with 2,500+ residents.

Other SD lists
Lead’s spot
#1of 37
80.7°July high
The race around Lead

Lead leads South Dakota

All 37 towns

July high, lowest first. Towns next door to Lead are tagged.

#TownJuly highDays at 90°+July low
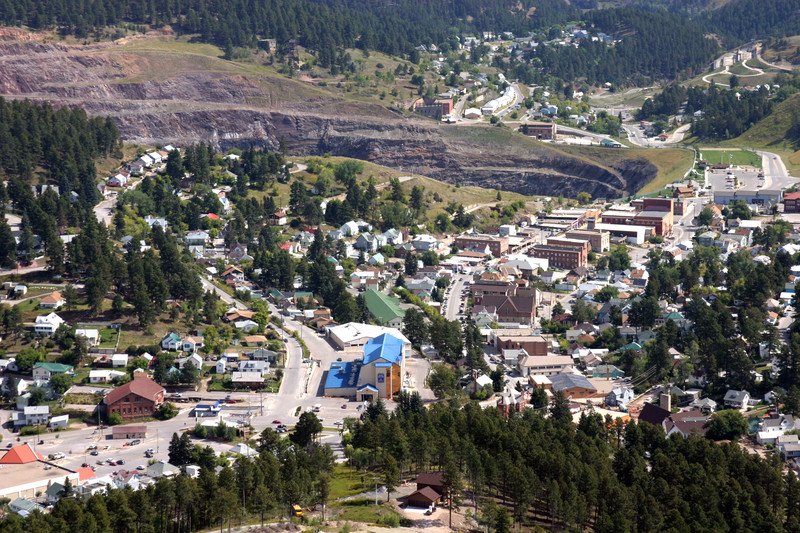
1 Lead3,006 people 80.7° 654°
2 Watertown23,044 people 81.3° 959°
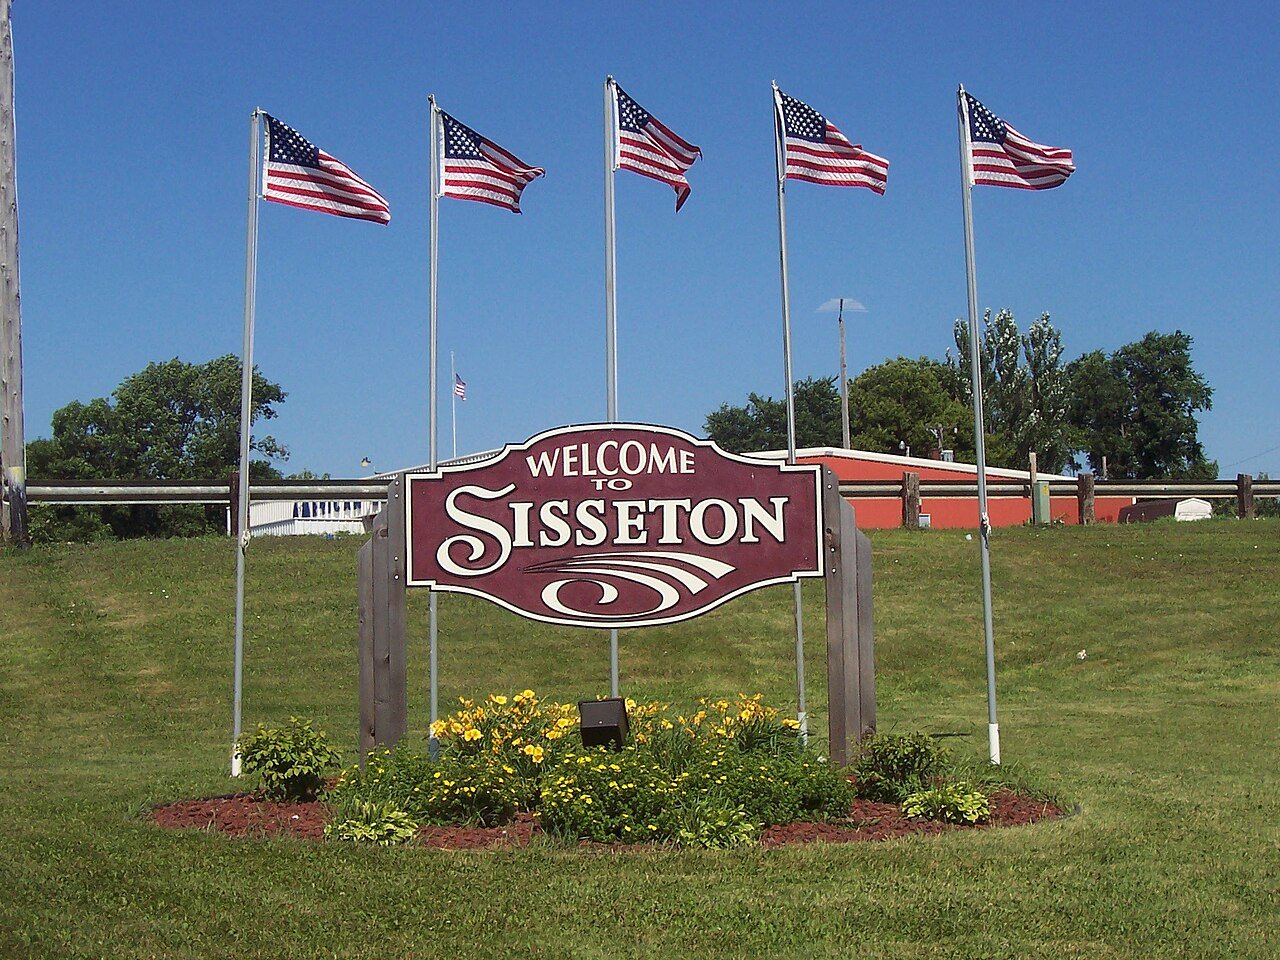
3 Sisseton2,670 people 81.9° 1160°
4 Brookings23,948 people 82.1° 860°
5 Madison6,094 people 82.5° 1260°
6 Milbank3,525 people 82.9° 861°
7 Dell Rapids3,905 people 83.2° 1161°
8 Blackhawk2,934 people 83.2° 2057°
9 Hartford3,478 people 83.5° 1562°
10 Aberdeen28,189 people 83.7° 1560°
11 Sioux Falls201,469 people 83.9° 1562°
12 Harrisburg8,519 people 83.9° 1562°
13 Tea6,786 people 83.9° 1562°
14 Summerset3,022 people 83.9° 2057°
15 Split RockMinnehaha County · 3,143 people 84.0° 1562°
16 Brandon10,996 people 84.1° 1562°
17 Colonial Pine Hills2,609 people 84.1° 2057°
18 Canton3,033 people 84.5° 1562°
19 Sturgis7,086 people 85.3° 2858°
20 Spearfish12,930 people 85.5° 2657°
21 North Sioux City3,045 people 85.6° 2563°
22 Elk Point2,537 people 85.6° 2963°
23 Huron14,385 people 85.7° 2262°
24 Vermillion11,878 people 85.7° 2963°
25 Rapid City77,946 people 85.8° 2059°
26 Yankton15,540 people 85.8° 3363°
27 Big SiouxUnion County · 4,917 people 85.8° 2563°
28 Dakota Dunes3,936 people 85.8° 2563°
29 Mobridge2,932 people 86.0° 2160°
30 Rapid Valley6,975 people 86.1° 3259°
31 Box Elder12,902 people 86.3° 3260°
32 Mitchell15,649 people 86.4° 2662°
33 Hot Springs3,548 people 87.2° 4158°
34 Chamberlain2,588 people 88.0° 3462°
35 Belle Fourche5,804 people 88.1° 3859°
36 Pierre13,948 people 88.2° 3861°
37 Winner2,905 people 88.5° 4062°
How it works

How this ranking works

The SD list, with the map →

We rank every town by the typical afternoon high in July, 1991–2020, from NOAA’s gridded climate normals for each town. The lowest ranks first. The town with the lowest figure ranks #1. Normals are 30-year averages, not a forecast, and each town’s Climate page shows its whole year month by month.

Temperatures and rainfall come from NOAA’s gridded normals, about 5 km (3 miles) square, read at each town’s center, so hills and coastlines are built in. Towns whose centers fall in the same square have the same numbers, so only the largest of them is listed.

Only towns with at least 2,500 residents are ranked; Census estimates for smaller places are too uncertain. Population and income: U.S. Census Bureau American Community Survey 5-year estimates. Climate: NOAA NCEI U.S. Climate Normals, 1991–2020. Town photos: Wikimedia Commons, credited on each town’s page.

More on climate in Lead →

Tell Lead what the numbers miss

Your answer becomes a post in Lead’s Town Square.

Weigh in
#1 of 37 for coolest summers. Does that ring true?
Ask neighbors

Post to Lead

We’ll email a one-tap link to publish your post. No password, and nothing is public until you click it.
Already a member? Sign in