Sign inJoin

← How Jay ranks

Oklahoma rankings · Climate

Towns with the coolest summers in Oklahoma

Ranked by the typical afternoon high in July, 1991–2020, from NOAA’s gridded climate normals for each town. Neighboring towns on the same 5 km grid square have the same numbers, so each square is listed once, under its largest town. 133 towns with 2,500+ residents.

Other OK lists
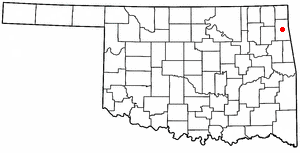
Jay’s spot
#2of 133
90.9°July high
The race around Jay

Just behind Stilwell, just ahead of Miami

All 133 towns

July high, lowest first. Towns next door to Jay are tagged.

#TownJuly highDays at 90°+July low
1 Stilwell3,755 people 90.5° 4369°
2 Jay2,731 people 90.9° 5769°
3 Miami12,926 people 91.1° 5770°
4 Grove7,176 people 91.5° 5870°
5 Vinita5,300 people 91.7° 5870°
6 Nowata3,542 people 91.7° 6071°
7 Tahlequah16,935 people 91.8° 5270°
8 Park Hill3,237 people 91.9° 5270°
9 Pawhuska2,930 people 92.0° 6170°
10 Bartlesville37,878 people 92.1° 7171°
11 Dewey3,412 people 92.1° 7170°
12 Pryor Creek9,569 people 92.2° 6071°
13 Claremore20,166 people 92.3° 6271°
14 Collinsville8,878 people 92.3° 7471°
15 Catoosa7,496 people 92.3° 7471°
16 Skiatook8,632 people 92.4° 7471°
17 Verdigris5,637 people 92.4° 6271°
18 Bristow4,272 people 92.4° 6970°
19 Hominy3,303 people 92.4° 6270°
20 Tulsa413,794 people 92.5° 7471°
21 Broken Arrow118,180 people 92.5° 6571°
22 Coweta10,433 people 92.5° 6571°
23 Idabel6,987 people 92.5° 8070°
24 Broken Bow4,226 people 92.5° 8170°
25 Mannford3,269 people 92.5° 6471°
26 Owasso40,151 people 92.6° 7471°
27 Sapulpa22,570 people 92.6° 8171°
28 Sand Springs20,117 people 92.6° 7471°
29 Kiefer2,639 people 92.6° 8171°
30 Muskogee36,758 people 92.7° 7071°
31 Jenks27,102 people 92.7° 8171°
32 Glenpool14,151 people 92.7° 8171°
33 Sallisaw8,605 people 92.7° 6170°
34 Cleveland3,225 people 92.7° 6471°
35 Heavener3,012 people 92.7° 7170°
36 Turley2,968 people 92.7° 7471°
37 Wagoner8,082 people 92.8° 6371°
38 Okemah3,063 people 92.8° 7571°
39 Okmulgee11,348 people 93.0° 6771°
40 Checotah3,064 people 93.0° 6871°
41 Stroud2,793 people 93.0° 6970°
42 Bixby30,155 people 93.1° 6571°
43 Henryetta5,608 people 93.1° 6771°
44 Fort Gibson3,808 people 93.1° 7071°
45 Wilburton2,602 people 93.1° 7371°
46 Midwest City58,297 people 93.2° 6971°
47 Cushing8,367 people 93.2° 6971°
48 Slaughterville4,251 people 93.2° 6971°
49 Roland3,687 people 93.2° 7870°
50 Muldrow3,309 people 93.2° 7870°
51 Bethel Acres3,165 people 93.2° 7471°
52 Eufaula2,825 people 93.2° —71°
53 Stigler2,729 people 93.2° 7571°
54 Mustang22,192 people 93.3° 7371°
55 McAlester18,111 people 93.3° 7371°
56 Poteau8,959 people 93.3° 7170°
57 Tecumseh6,332 people 93.3° 7471°
58 Hugo5,182 people 93.3° 7171°
59 Davis2,814 people 93.3° 7372°
60 Longtown2,716 people 93.3° 7572°
61 Nicoma Park2,566 people 93.3° 6971°
62 Norman129,672 people 93.4° 7671°
63 Moore63,420 people 93.4° 7371°
64 Shawnee31,671 people 93.4° 7470°
65 Ponca City24,326 people 93.4° 7470°
66 Noble7,493 people 93.4° 6971°
67 Pocola4,423 people 93.4° 7871°
68 Spencer3,928 people 93.4° 6971°
69 Ada16,575 people 93.5° 7671°
70 Choctaw12,303 people 93.5° 6971°
71 Seminole7,194 people 93.5° 8270°
72 Holdenville5,902 people 93.5° 7871°
73 McLoud4,425 people 93.5° 5971°
74 Chandler2,899 people 93.5° 7370°
75 Del City21,494 people 93.6° 7371°
76 Warr Acres10,466 people 93.6° 7671°
77 Harrah6,684 people 93.6° 5971°
78 Sulphur4,874 people 93.6° 7371°
79 Wewoka3,091 people 93.6° 7871°
80 Jones3,053 people 93.6° 6971°
81 Oklahoma City697,125 people 93.7° 7371°
82 Bethany20,560 people 93.7° 7671°
83 Newcastle13,001 people 93.7° 7671°
84 Goldsby3,085 people 93.7° 6971°
85 Tuttle8,040 people 93.8° 7371°
86 Blackwell6,042 people 93.8° 7270°
87 Calera3,007 people 93.8° 8472°
88 Blanchard9,215 people 93.9° 7771°
89 Edmond96,825 people 94.0° 8371°
90 Stillwater49,269 people 94.0° 7671°
91 Yukon25,529 people 94.0° 7671°
92 Durant19,746 people 94.0° 8272°
93 Guymon12,539 people 94.0° 8966°
94 The Village9,447 people 94.0° 7672°
95 Purcell6,803 people 94.0° 7571°
96 Perry4,452 people 94.0° 8171°
97 Perkins3,262 people 94.0° 7971°
98 Madill4,004 people 94.1° 8773°
99 Tonkawa3,014 people 94.1° 7270°
100 El Reno18,557 people 94.2° 7571°
101 Piedmont8,342 people 94.2° 7671°
102 Marlow4,451 people 94.2° 7671°
103 Ardmore24,877 people 94.3° 8572°
104 Hinton4,909 people 94.3° 8271°
105 Enid50,653 people 94.4° 8071°
106 Lone Grove5,125 people 94.4° 8872°
107 Weatherford12,004 people 94.5° 7870°
108 Pauls Valley6,062 people 94.5° 8571°
109 Atoka2,894 people 94.5° 8272°
110 Marietta2,865 people 94.5° 9673°
111 Watonga2,623 people 94.5° 7871°
112 Woodward11,882 people 94.6° 8069°
113 Elk City11,361 people 94.6° 7870°
114 Guthrie11,243 people 94.6° 8371°
115 Tishomingo3,083 people 94.6° 8072°
116 Lindsay2,884 people 94.9° 7671°
117 Duncan22,958 people 95.1° 7672°
118 Chickasha16,539 people 95.1° 9171°
119 Elgin3,608 people 95.1° 8272°
120 Hennessey2,567 people 95.1° 8071°
121 Anadarko5,572 people 95.2° 7571°
122 Alva4,982 people 95.3° 8869°
123 Kingfisher5,026 people 95.4° 8971°
124 Clinton8,388 people 95.5° 8370°
125 Sayre4,796 people 95.5° 7870°
126 New Cordell2,740 people 95.5° 9371°
127 Fairview2,687 people 95.7° 9071°
128 Cache3,074 people 95.8° 8372°
129 Hobart3,358 people 96.1° 9471°
130 Mangum2,755 people 96.2° 9271°
131 Lawton90,595 people 96.3° 8372°
132 Altus18,646 people 96.9° 10672°
133 Frederick3,445 people 97.0° 10972°
How it works

How this ranking works

The OK list, with the map →

We rank every town by the typical afternoon high in July, 1991–2020, from NOAA’s gridded climate normals for each town. The lowest ranks first. The town with the lowest figure ranks #1. Normals are 30-year averages, not a forecast, and each town’s Climate page shows its whole year month by month.

Temperatures and rainfall come from NOAA’s gridded normals, about 5 km (3 miles) square, read at each town’s center, so hills and coastlines are built in. Towns whose centers fall in the same square have the same numbers, so only the largest of them is listed.

Only towns with at least 2,500 residents are ranked; Census estimates for smaller places are too uncertain. Population and income: U.S. Census Bureau American Community Survey 5-year estimates. Climate: NOAA NCEI U.S. Climate Normals, 1991–2020. Town photos: Wikimedia Commons, credited on each town’s page.

More on climate in Jay →

Tell Jay what the numbers miss

Your answer becomes a post in Jay’s Town Square.

Weigh in
#2 of 133 for coolest summers. Does that ring true?
Ask neighbors

Post to Jay

We’ll email a one-tap link to publish your post. No password, and nothing is public until you click it.
Already a member? Sign in