Guest, Sign inJoin
Compare towns

Wakonda vs Buffalo

365 miles apart. The biggest differences: average commute (13 min in Buffalo) and household income (+39% in Buffalo).
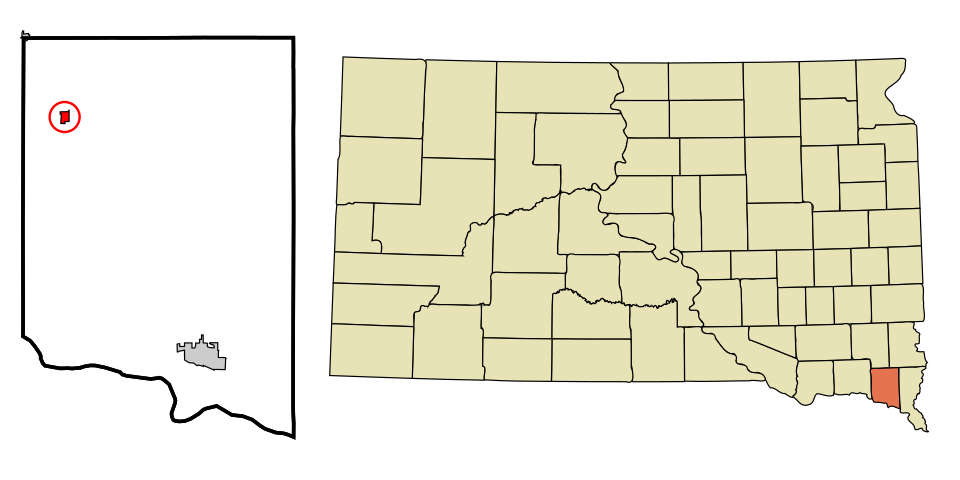
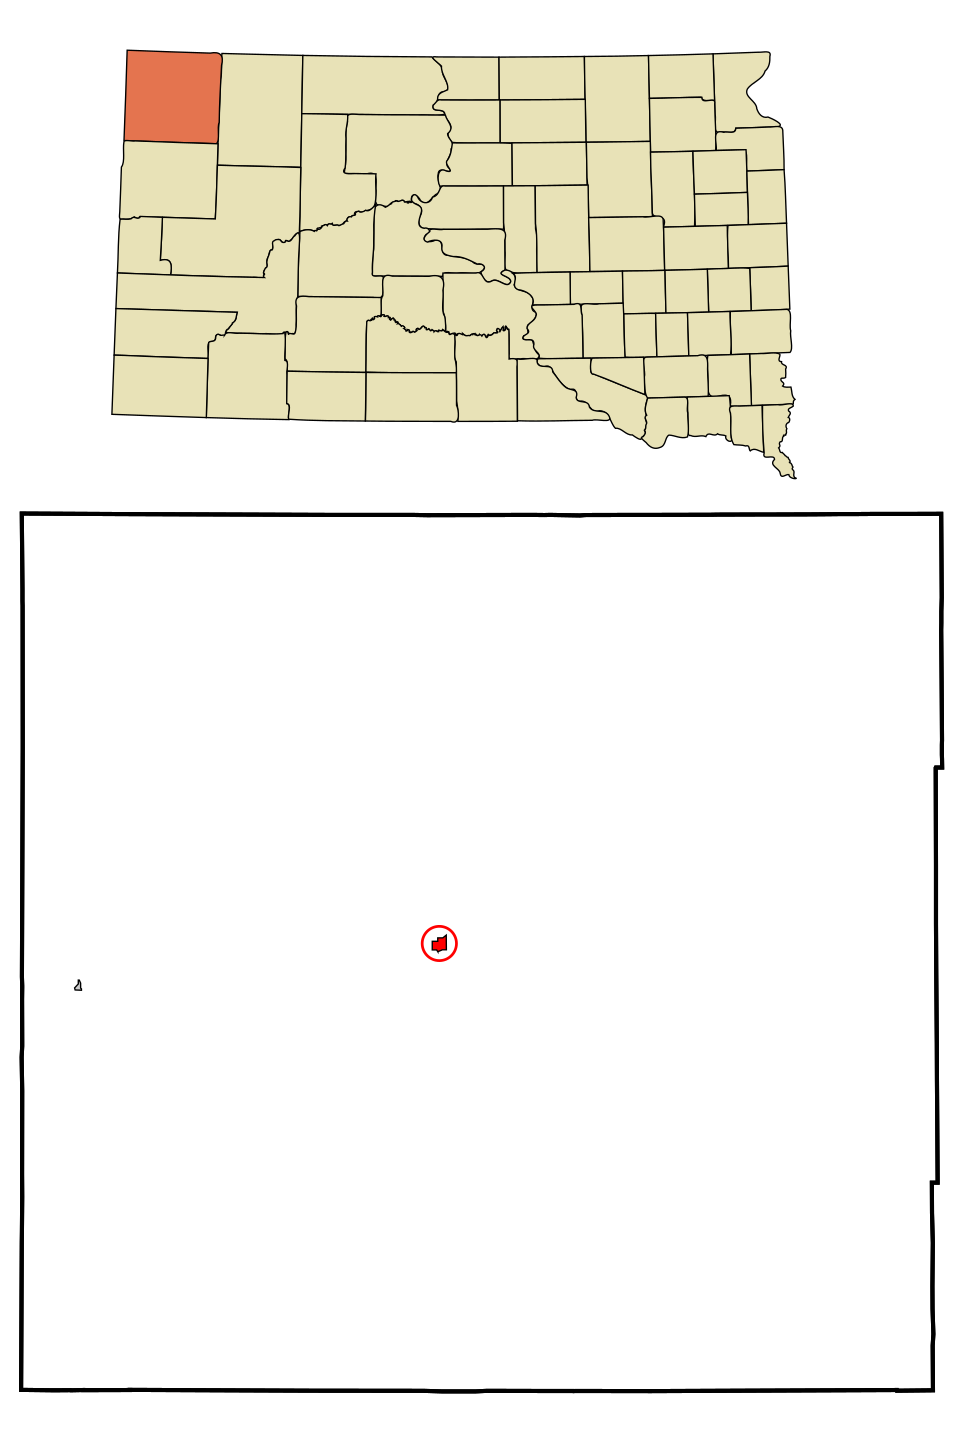
×
Wakonda, SDHomes around $261KSouth Dakota · 399 people
×
Buffalo, SDHomes around $199KSouth Dakota · 278 people
Where each one shines

Two towns, two different strengths

What each town does better than most of its state (not better than each other). Tap one to see the page behind it.

The biggest differences

Where they differ most

The rows below where the towns are furthest apart, beyond the Census margin of error. The full table is further down.

★ What stands out · Monthly cost

A typical home costs $410 more a month in Wakonda

A typical home in each town, bought with 20% down at 6.3% for 30 years, plus property tax at the town’s own rate and insurance. Change the numbers to fit you.

Wakonda$1,710/mo
Typical home $261K (Zillow) · tax rate 1.57% · or rent about $807/mo · Housing →
Buffalo$1,300/mo
Typical home $199K (Zillow) · tax rate 1.52% · or rent about $725/mo · Housing →

The difference: $410 a month, about $5,000 a year, between Wakonda and Buffalo.

Estimates, not a quote: your price, rate, tax bill and insurance will differ. Tax rate = the Census median tax bill over the median home value.

Life in each

What daily life feels like in each

The weather, the land, the history and the people, row by row. None of it is a grade: more snow is a plus to a skier.

Seasons
WakondaBuffalo
Snow a year31″51″
January low7°F9°F
July high84°F87°F
Growing season (days)151d131d
Hazard risk (U.S. pctl)66th71st
Outdoors & history
WakondaBuffalo
Trails—0 mi
Conserved land—0%
Settled18881909
National Register places21
Community
WakondaBuffalo
Library hours a week—20 hrs
Posts this month00
Neighbors joined00

A dot marks the most on each row. Climate: NOAA 1991–2020 normals at the nearest station. Hazard risk: FEMA National Risk Index, expected yearly damage vs U.S. towns.

Where they are

365 miles apart

Straight-line miles between town centers.

Wakonda ↔ Buffalo365 miles apart
Everything, side by side

What matters to you?

Pick a few. Those rows jump to the top and the best fit on each is marked. There’s no overall score: what matters is up to you.

WakondaBuffalo
People
Population 399Highest 278Lowest
Median age 54.4±16.3Lowest 43% above SD 57.2±6.6Highest 51% above SD
Buffalo and Wakonda are within the Census margin of error here, so we can’t say which is really higher.
Kids under 18 21.8%±7.8Highest SD: 24.2% 10.8%±8.1Lowest SD: 24.2%
Wakonda and Buffalo are within the Census margin of error here, so we can’t say which is really higher.
Age 65+ 36.1%±6.9Highest SD: 18% 20.5%±7.4Lowest SD: 18%
Bachelor’s degree+adults 25+ 20.5%Highest SD: 31.9% 15.8%Lowest SD: 31.9%
Enrolled in collegeshare of residents 0.5%±2.6Lowest SD: 5% 0.7%±3.7Highest SD: 5%
Buffalo and Wakonda are within the Census margin of error here, so we can’t say which is really higher.
Cost of living
Household incomemedian $61,250±$10kLowest 18% below SD $85,104±$10kHighest 13% above SD
Home valuemedian, owner-occupied $107,100±$15kLowest 58% below SD $114,100±$44kHighest 56% below SD
Buffalo and Wakonda are within the Census margin of error here, so we can’t say which is really higher.
Rentmedian gross, monthly $807±$275Highest 15% below SD $725±$321Lowest 23% below SD
Wakonda and Buffalo are within the Census margin of error here, so we can’t say which is really higher.
Property taxmedian, yearly $1,680Lowest 38% below SD $1,735Highest 36% below SD
Renters paying 30%+of income on rent 73.3%±78.5Highest SD: 39.8% 11.5%±66.9Lowest SD: 39.8%
Wakonda and Buffalo are within the Census margin of error here, so we can’t say which is really higher.
Below poverty line 20.1%Highest SD: 11.9% 6.8%Lowest SD: 11.9%
Housing
Homeownersof occupied homes 82.8%Highest SD: 68.6% 82%Lowest SD: 68.6%
Typical home builtmedian year 1944Lowest 36 yrs older than SD 1953Highest 27 yrs older than SD
Getting to work
Average commuteone way 23 minHighest 31% above SD 10 minLowest 42% below SD
Work from home 9.4%±7.3Highest SD: 9.7% 5.5%±4.7Lowest SD: 9.7%
Wakonda and Buffalo are within the Census margin of error here, so we can’t say which is really higher.
Work in townworking residents 3.2%Lowest 24.1%Highest
Typical commute distancemedian, straight-line 18.3 miHighest 16.3 miLowest
Jobs per working residentover 1.5 = a job hub 0.68Lowest 1.24Highest
Top workplaceoutside town Vermillion (21%)Camp Crook (5%)
Between these townsresidents who work in the others Few work in BuffaloFew work in Wakonda
Outdoors
Conserved landshare of the town 0% 0%
Trailsmapped miles 0.0 mi 0.0 mi
Trail densitymiles per sq mi 0.0 mi 0.0 mi
Parks & preservesnamed on the map 0Lowest 1Highest
Street connectivityintersections per sq mi, a walkability measure 102Highest 96.3Lowest
South Dakota average“±” Census margin of errorACS 2020–2024
Deciding?

Ask the people who live there

The numbers stop at the town line. Neighbors can tell you about the commute at 7am, the schools, the winters and the feel of the place.

Wakonda neighborsTown Square →

Your question goes to Wakonda’s Town Square.

Buffalo neighborsTown Square →

Your question goes to Buffalo’s Town Square.

Add a town

Set another town beside Wakonda and Buffalo

One tap adds it. Up to 4 towns at once.

Towns like Wakonda

Sources: U.S. Census Bureau American Community Survey 5-year estimates, 2010 & 2020 censuses, LEHD commute flows; Zillow Home Value Index; NCES Common Core of Data; FBI crime reporting; CDC PLACES; FEMA National Risk Index; NOAA U.S. Climate Normals 1991–2020; USGS PAD-US and OpenStreetMap. “±” is the Census margin of error; differences inside it are never called. Property tax is top-coded by the Census at $10,000+. There is no overall score: which town is better depends on what matters to you.

Post to Wakonda

We’ll email a one-tap link to publish your post. No password, and nothing is public until you click it.
Already a member? Sign in