Compare towns
Picayune vs Nicholson
Cost, people, housing, commute and schools, side by side, each benchmarked against Mississippi.
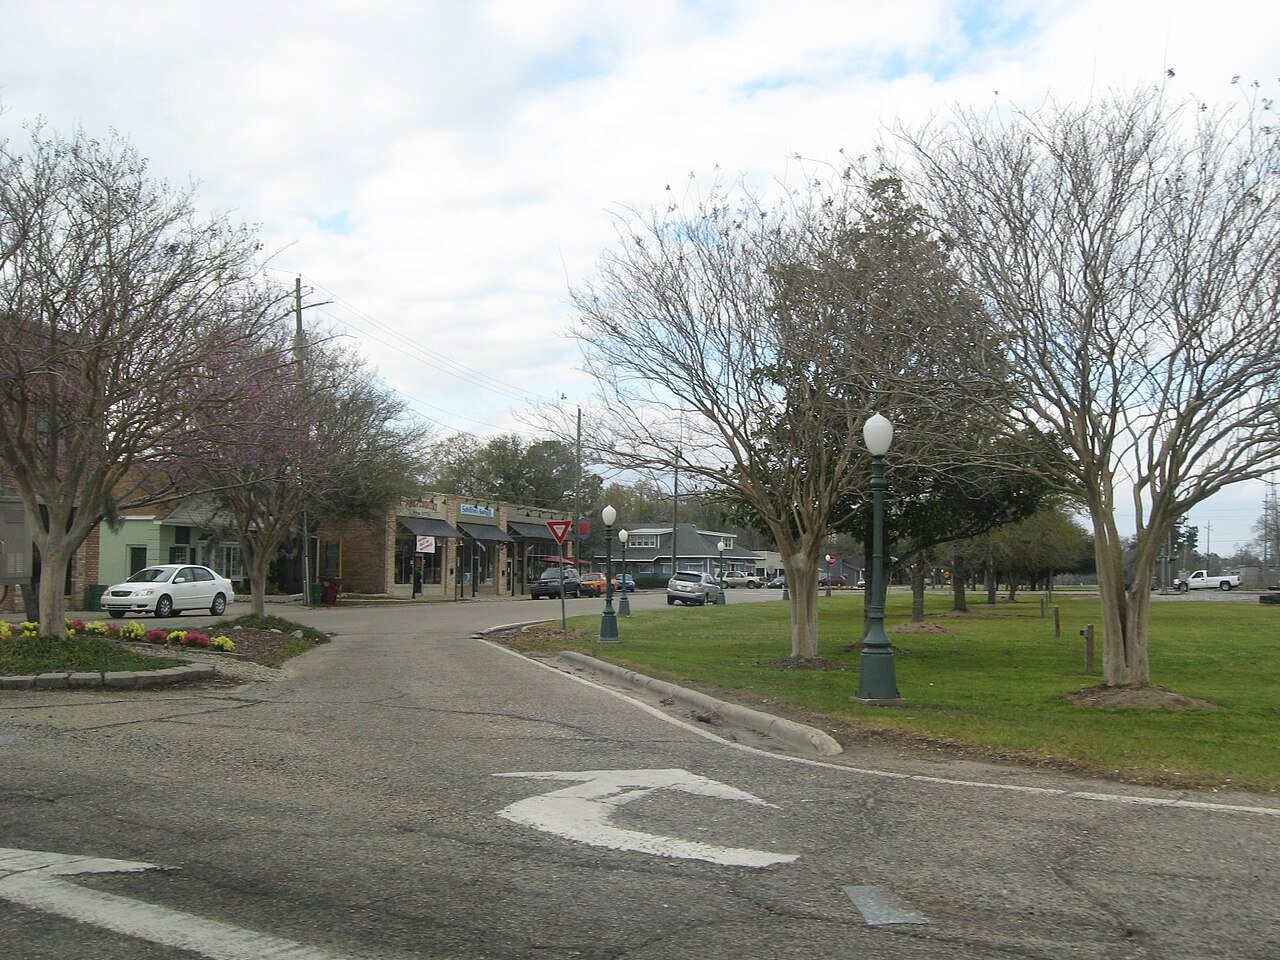
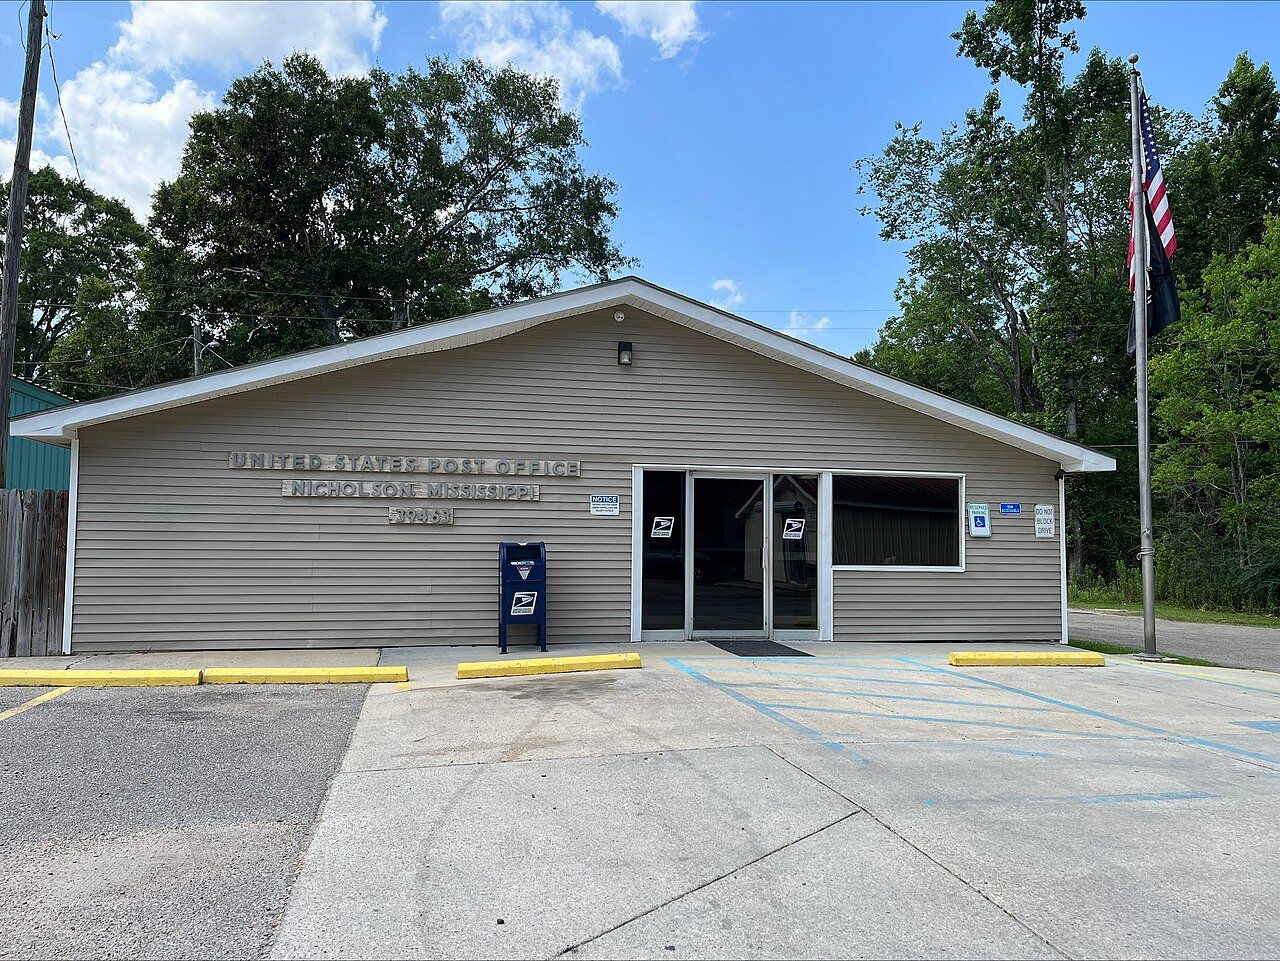
Bordering PicayuneHide-A-Way Lake
What stands out worked out from the figures below
Picayune has grown the fastest since 2010 (+9.3%).
Nicholson has the most affordable homes ($97k median).
What matters to you?
Pick a few. We’ll pull those rows to the top and mark which town comes out ahead on each. There’s no overall score: what matters is up to you.
| Measure | Picayune | Nicholson |
|---|---|---|
| Your priorities | ||
| People | ||
| Population | 11,900Highest |
3,146Lowest |
| Growth since 20102010 → 2020 census | +9.3%Highest |
-8.4%Lowest |
| Median age | 41.8±2.3Highest 8% above MS |
33.9±10.7Lowest 12% below MS |
| Picayune and Nicholson are within the Census margin of error here, so we can’t say which is really higher. | ||
| Kids under 18 | 23.8%±3.7Highest MS: 23.3% |
23.5%±6.7Lowest MS: 23.3% |
| Picayune and Nicholson are within the Census margin of error here, so we can’t say which is really higher. | ||
| Age 65+ | 19.8%±3.1Highest MS: 17.2% |
13.8%±4.9Lowest MS: 17.2% |
| Picayune and Nicholson are within the Census margin of error here, so we can’t say which is really higher. | ||
| Bachelor’s degree+adults 25+ | 16.2%Highest MS: 25.1% |
7.3%Lowest MS: 25.1% |
| Enrolled in collegeshare of residents | 5.1%±1.7Highest MS: 6.1% |
3.5%±3.2Lowest MS: 6.1% |
| Picayune and Nicholson are within the Census margin of error here, so we can’t say which is really higher. | ||
| Cost of living | ||
| Household incomemedian | $41,213±$8kLowest 27% below MS |
$50,114±$20kHighest 11% below MS |
| Nicholson and Picayune are within the Census margin of error here, so we can’t say which is really higher. | ||
| Home valuemedian, owner-occupied | $157,100±$15kHighest 7% below MS |
$97,400±$77kLowest 43% below MS |
| Picayune and Nicholson are within the Census margin of error here, so we can’t say which is really higher. | ||
| Rentmedian gross, monthly | $931±$95Highest about the MS average |
$872±$53Lowest 9% below MS |
| Picayune and Nicholson are within the Census margin of error here, so we can’t say which is really higher. | ||
| Property taxmedian, yearly | $1,302Highest 7% above MS |
$752Lowest 38% below MS |
| Renters paying 30%+of income on rent | 47.5%±9.5Lowest MS: 51.3% |
47.9%±25.6Highest MS: 51.3% |
| Nicholson and Picayune are within the Census margin of error here, so we can’t say which is really higher. | ||
| Below poverty line | 20.6%Lowest MS: 18.9% |
25.4%Highest MS: 18.9% |
| Housing | ||
| Homeownersof occupied homes | 58.8%Lowest MS: 70% |
63%Highest MS: 70% |
| Typical home builtmedian year | 1976Lowest 10 yrs older than MS |
1995Highest 9 yrs newer than MS |
| Getting to work | ||
| Average commuteone way | 32 minHighest 25% above MS |
28 minLowest 10% above MS |
| Work from home | 5.9%±2.9Lowest MS: 5.9% |
7.6%±8.1Highest MS: 5.9% |
| Nicholson and Picayune are within the Census margin of error here, so we can’t say which is really higher. | ||
| Schools | ||
| Public school scoresrank in state, math + reading | #50 of 92 in MS | #63 of 92 in MS |
| School district | Picayune School District | Picayune School District |
| High school in town | Picayune Memorial High School | None in town |
| Students per teacherat that high school | 15.5 |
— |
| On TownTapestry | ||
| Old photos in History | None yet | None yet |
MS average · Sources: U.S. Census Bureau, American Community Survey 5-year estimates 2020–2024; 2010 & 2020 decennial census; NCES Common Core of Data. “±” is the Census margin of error. Property tax is top-coded by the Census at $10,000+. School rank compares math and reading proficiency against the state average.