A typical home costs $330 more a month in Waterloo
A typical home in each town, bought with 20% down at 6.3% for 30 years, plus property tax at the town’s own rate and insurance. Change the numbers to fit you.
Donalds$1,150/mo
Typical home $203K (Zillow) · tax rate 0.50% · or rent about $850/mo · Housing →
Waterloo$1,480/mo
Typical home $219K (Zillow) · tax rate est. 1.8% · Housing →
The difference: $330 a month, about $3,900 a year, between Waterloo and Donalds.
Estimates, not a quote: your price, rate, tax bill and insurance will differ. Tax rate = the Census median tax bill over the median home value.
Report cards
Grades and rankings, side by side
Our letter grades for safety, schools and health, then every South Carolina ranking list both towns are on. A grade is one measure; read the page behind it.
A dot marks the most on each row. Climate: NOAA 1991–2020 normals at the nearest station. Hazard risk: FEMA National Risk Index, expected yearly damage vs U.S. towns.
Where they are
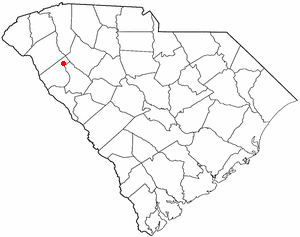
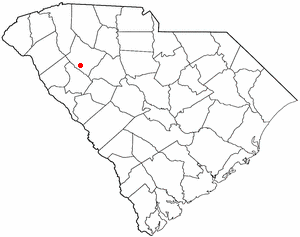
16 miles apart
Straight-line miles between town centers.
DonaldsWaterloo
Donalds ↔ Waterloo16 miles apart
Everything, side by side
What matters to you?
Pick a few. Those rows jump to the top and the best fit on each is marked. There’s no overall score: what matters is up to you.
DonaldsWaterloo
Your priorities
People
Population355Highest212Lowest
Median age46.4±11.8Lowest 15% above SC49±24.2Highest 22% above SC
Waterloo and Donalds are within the Census margin of error here, so we can’t say which is really higher.
Kids under 1818%±4.7Lowest SC: 21.4%25.5%±23.2Highest SC: 21.4%
Waterloo and Donalds are within the Census margin of error here, so we can’t say which is really higher.
Age 65+16.6%±6.8Lowest SC: 18.9%26.9%±13.8Highest SC: 18.9%
Waterloo and Donalds are within the Census margin of error here, so we can’t say which is really higher.
Sources: U.S. Census Bureau American Community Survey 5-year estimates, 2010 & 2020 censuses, LEHD commute flows; Zillow Home Value Index; NCES Common Core of Data; FBI crime reporting; CDC PLACES; FEMA National Risk Index; NOAA U.S. Climate Normals 1991–2020; USGS PAD-US and OpenStreetMap. “±” is the Census margin of error; differences inside it are never called. Property tax is top-coded by the Census at $10,000+. There is no overall score: which town is better depends on what matters to you.
 + Compare
 + Compare
 + Compare
 + Compare